HAL Id: cea-01272801
https://hal-cea.archives-ouvertes.fr/cea-01272801
Submitted on 11 Feb 2016HAL is a multi-disciplinary open access archive for the deposit and dissemination of sci-entific research documents, whether they are pub-lished or not. The documents may come from teaching and research institutions in France or abroad, or from public or private research centers.
L’archive ouverte pluridisciplinaire HAL, est destinée au dépôt et à la diffusion de documents scientifiques de niveau recherche, publiés ou non, émanant des établissements d’enseignement et de recherche français ou étrangers, des laboratoires publics ou privés.
Temperature influence on water transport in hardened
cement pastes
Emeline Drouet, Stéphane Poyet, Jean-Michel Torrenti
To cite this version:
Emeline Drouet, Stéphane Poyet, Jean-Michel Torrenti. Temperature influence on water trans-port in hardened cement pastes. Cement and Concrete Research, Elsevier, 2015, 76, pp.37-50. �10.1016/j.cemconres.2015.05.002�. �cea-01272801�
1
Temperature influence on water transport
1in hardened cement pastes.
2Emeline DROUET a, Stéphane POYET a,*, Jean-Michel TORRENTI b
3
a CEA, DEN, DPC, SECR, Laboratoire d’Etude du Comportement des Bétons et des Argiles, F-91191 Gif sur
4
Yvette Cedex, France. 5
b Université Paris-Est, IFSTTAR, Département Matériaux & Structures, 14-52 boulevard Newton, F-77447
6
Marne la Vallée cedex 2, France. 7
Abstract
8
Describing water transport in concrete is an important issue for the durability assessment of radioactive 9
waste management reinforced concrete structures. Due to the waste thermal output such structures 10
would be submitted to moderate temperatures (up to 80°C). We have then studied the influence of 11
temperature on water transport within hardened cement pastes of four different formulations. Using a 12
simplified approach (describing only the permeation of liquid water) we characterized the properties 13
needed to describe water transport (up to 80°C) using dedicated experiments. For each hardened 14
cement paste the results are presented and discussed. 15
Keywords: Waste management (E) – Cement paste (D) – Drying (A) – Temperature (A) - Permeability (C). 16
2
1. Introduction
17
Water plays a very important role in concrete structures durability. This fact is well illustrated by the 18
results of Tuutti [1] which relate the variations of the corrosion current of steel embedded in a 19
carbonated mortar as a function of the external relative humidity (RH). In a more general way water is 20
necessary for the chemical reactions to occur (in solution) and presents a significant impact on concrete 21
transport properties. The durability assessment of concrete structures thus necessitates an accurate 22
description of water transport all along service life. Among the data needed to compute water flow in 23
unsaturated conditions, the water sorption isotherm and permeability are the most important (see part 24
2). In the field of radioactive waste management, the concrete structures and containers would also 25
have to cope with heating due to the waste thermal output (the maximal temperature to be reached is 26
80°C). 27
It has been known for long that water transport is strongly influenced by temperature. Experiments 28
performed on cementitious materials have shown that the higher the temperature, the faster the water 29
transport [2-9]. Several authors used the diffusion equation to describe isothermal drying experiments. 30
In so doing, the resulting moisture diffusivity D was found to increase with temperature. Glover and 31
Raask [4] showed the moisture diffusivity of a Portland cement paste (water-to-cement ratio w/c = 0.28) 32
was multiplied by 11 to 15 between 30 and 70°C whereas Wong et al. [7] obtained a factor 6 to 8 33
between 20 and 40°C for three concretes (Portland cement, w/c = 0.4, 0.5 and 0.6). In the same way 34
Powers [5] measured the permeability of Portland cement pastes (w/c from 0.5 to 0.8) between 0 and 35
27°C using water. The resulting hydraulic conductivity (that depends on water viscosity, in m/s) was 36
found to increase by a factor 3. Hughes et al. [2] and Hancox [3] dried Portland cement paste samples 37
(w/c = 0.3 and 0.5) at temperatures ranging from 21 to 95°C. The diffusivity increase with temperature 38
was found to follow Arrhenius’ equation. The mean activation energy was 43 kJ/mol (10.2 kcal/g/mol). 39
3 It must be mentioned that smaller increase in water transport properties were obtained in recent
40
studies. Jooss and Reinhardt [9] measured water permeability and diffusivity of several different 41
cementitious materials (using water permeametry and cup method). They found that permeability and 42
diffusivity were only increased by 18-92% and 18-41% respectively between 20 and 80°C. Černy et al. [8] 43
used the so-called PCK method (similar to an imbibition test) to estimate the moisture diffusivity of two 44
concrete used for nuclear power plants containment building in France and Czech Republic. The values 45
obtained at 80°C were greater than the ones obtained at 5°C by a factor 2.0-2.5. 46
Temperature is also known to affect the water retention properties of cementitious materials [6, 10-15]. 47
A temperature increase leads to the reduction of the amount of water retained at equilibrium with a 48
given RH: the greater the temperature increase, the more the reduction. For instance for a high-49
performance concrete kept at 60% RH, increasing temperature from 30 to 80°C led to the reduction of 50
the water content (by mass) at equilibrium from 3% to about 1% [13]. The isotherm shape is also 51
modified; the water content reduction is not constant over the RH-range. It depends on the temperature 52
increase. Another important point is the absence of temperature threshold: any change in temperature 53
is expected to impact the water retention curve. 54
The influence of temperature is generally attributed to the variation of water physical properties (density 55
and surface tension) [16] as well as the coarsening of the pore structure in relation to ettringite 56
dissolution and C-S-H alteration [14]. It was however suggested recently that another phenomenon 57
might be at work [13]. A temperature change at a constant RH leads to the shift of equilibrium between 58
the adsorbed phase and water vapor. Since adsorption is an exothermic process, a temperature increase 59
shifts the equilibrium towards the endothermic reaction (that is to say desorption). Consequently water 60
is released. A simple tool was then proposed to describe this so-called “thermal desorption” [17]. It is 61
based on Clausius-Clapeyron equation [18]: 62
4
= − (1)
63
where: 64
• R is the universal gas constant (8.3145 J/mol/K);
65
• pv vapor pressure (Pa) at equilibrium with the water content w;
66
• T absolute temperature (K);
67
• qst isosteric energy (J/mol).
68
qst corresponds to the amount of heat involved in the adsorption process (J/mol). Note that in eq. (1) the
69
derivation operation must be carried out for a constant amount of adsorbed water w. The isosteric 70
energy qst can be obtained using two isotherms at two distinct temperatures. Once qst is known, the
71
water retention curve for any arbitrary temperature T can be easily estimated using: 72
ℎ , = ℎ , exp ! " (2)
73
where: 74
• pvs(T) is the vapor pressure at saturation (Pa) for the absolute temperature T;
75
• h(w,T) relative humidity at equilibrium with the water content w at the absolute temperature T.
76
This simple model was found to satisfactorily reproduce the temperature-induced evolution of concrete 77
water retention curve [13, 17]. This model implicitly assumes that the shift of equilibrium is the only 78
mechanism at work and that the microstructure modifications can be neglected. 79
For the description of unsaturated water transport, the intrinsic permeability is commonly evaluated 80
through inverse analysis [19-22]: the temperature-induced modifications of the water retention curve 81
described above are then expected to have a significant influence on the permeability assessment [23]. 82
The main objective of this study was to assess the influence of temperature on unsaturated permeability. 83
5 With regards to Andra’s (the French agency for radioactive waste management) requirements in the 84
context of nuclear waste storage, we have designed an experimental campaign to acquire all the data 85
needed to describe unsaturated water transport using a simplified model (see section 2) and 86
cementitious materials of interest. The results do constitute a unique and consistent dataset. 87
2. Background
88
Water transport within porous media involves three different motions: (1) permeation of the liquid 89
water; (2) permeation of the gaseous phase (water vapor + dry air) and (3) diffusion of water vapor 90
within the gaseous phase. The neat description of these phenomena leads to three coupled differential 91
equations [20, 21, 24-27]. The major drawback of such an approach is the very large number of input 92
data that are difficult to acquire experimentally. 93
From a practical point of view, water transport can be profitably described in a simplified way using a 94
single equation accounting for liquid permeation only. The others motions (permeation of the gaseous 95
phase and water vapor diffusion) are neglected. This assumption was found to be valid for a hardened 96
cement paste (w/c = 0.35) with a permeability equal to 1.0×10⁻²¹ m2 [20]. In a recent study Thiery et al.
97
[28, 29] estimated the respective contribution of each motion to the overall water flow. They showed 98
that the assumption validity domain depends on the material properties and especially on permeability. 99
For a high-performance concrete (w/c = 0.27) with low permeability (2×10-22 m2) the assumption is valid
100
between RH=20% and 100% whereas it is only valid between RH=65% and 100% for a low-strength 101
concrete (w/c = 0.84) with high permeability (4×10-19 m2).
102
The liquid water flow rate is given by the extension of Darcy’s law for incompressible unsaturated media 103
[30]: 104
6
# = −$%&'(grad - , (3)
105
In which: 106
• η is the water viscosity [Pa s];
107
• ρ water density [kg/m3]; 108
• K intrinsic permeability [m2]; 109
• kr relative permeability to water [without unit];
110
• P water pressure [Pa]. 111
In unsaturated conditions the water pressure presents negative values P∈]-∞ ; 0]. It is evaluated using 112
Kelvin-Laplace equation: 113
- = −$!. ln ℎ , (4)
114
where M is the water molar mass [0.018 kg/mol]. 115
The mass conservation equation writes: 116 $∅2 = −div # = −div −$567 & grad - ", (5) 117 In which 118
• S is the saturation index [without unit], it characterizes how pores are filled (by volume) with
119
liquid water. It ranges between 0 (dry state) and 1 (saturated state). 120
• ∅ is the concrete porosity [volume per volume, without unit]. 121
In isothermal conditions (as this is the case in this study, see after) and assuming that water is 122
incompressible and that water flow is the only phenomenon at work (absence of dissolution or 123
precipitation), ρ and ∅ can be considered as constants. The following equation is obtained: 124
7
∅ 8 = div 56&grad - " (6)
125
Assuming that a differentiable function exists between water saturation S and pressure P one can obtain: 126
∅ 98 9= div 56&grad - " (7)
127
This simple equation allows the water transport description within the cementitious materials knowing 128
only four their properties, namely: the porosity ∅, the derivative of the capillary pressure function, the 129
intrinsic and relative permeability K and kr. Following Savage and Janssen [31] the water retention curve
130
is almost described using the equation proposed by van Genuchten [32]: 131
2 = :1 + |9|9 >?@ A (8)
132
where P0 and m are two positive parameters: m (usually around 0.5) [without unit] whereas P0 is
133
equivalent to a pressure [several tenths of MPa]. The use of Mualem’s model [33] together with eq. (8) 134
allows deriving an analytical expression for the relative permeability kr (the value of the parameters m
135
and P0 are the same as above):
136 '(= √2 1 − 1 − 2? A" C = :1 + |9|9 >?@ ? D E1 − |9|9 >?:1 + |9|9 >?@ A F C (9) 137
The left-hand term 8
9 of equation (7) is given by:
138 8 9 = A G 9A |9|9 >?:1 + |9|9 >?@ G A (10) 139
8
3. Methods
140
3.1. Materials
141
We used hardened cement pastes prepared using four different binders that were selected for their 142
potential interest for radioactive waste management in France: 143
• The CEM I 52.5 R CE PM-ES-CP2 (according to the European standard EN-206) from Val 144
d’Azergues factory (France, Lafarge). This ordinary Portland cement (OPC) was selected by Andra 145
(the French Agency for radioactive waste management) as a reference cement for the study of 146
concrete structures and waste packages. 147
• The CEM II/B-LL 42.5 N CE CP2 from Le Teil factory (France, Lafarge). This cement (OPC + 25% 148
limestone filler) was selected because it was used for the realization of a scale-one subsurface 149
storage structure mockup (Galatée) [34-36]. 150
• The CEM V/A (S-V) 42.5 N CE PM-ES-CP1 from Airvault factory (Calcia, France). This cement was 151
selected by Andra as a reference binder for concrete packages. 152
• A low-alkanity ternary mix of CEM I/OPC (37.5%), silica fume (32.5%) and fly ash (35%). The 153
cement used in this mix was provided by Lafarge, Le Teil factory, France (CEM I 52.5 N CE PM-154
ES). The silica fume and fly ash were provided by Condensil (S 95 DM) and Calcia respectively. 155
This mix composition was designed in the field of geological disposal by [37, 38] to mitigate the 156
heat emitted during hydration and limit the chemical interaction between clay minerals and 157
concrete parts (alkaline plume) which could impair clay physical and chemical properties. 158
A unique water-to-binder ratio (w/b) was used to enable comparison between the four pastes. We chose 159
w/b = 0.40 because it allowed the CEM I paste to be representative of the concrete studied in [13]. The 160
resulting hardened cement paste is the same as the one embedding the concrete aggregates. For this 161
9 purpose, the paste water to binder ratio w/b was adjusted to account for the water brought by the 162
superplasticizer and absorbed by the aggregates. Moreover this value appeared to yield good properties 163
of each fresh paste (good workability, neither visible segregation nor bleeding). The composition of each 164
paste is given in Table 1. 165
Table 1. Composition of the pastes.
166
Compound CEM I CEM II CEM V Low-pH Unit
OPC 1396 1023 759 468 g/L of paste
Calcareous filler - 341 - - g/L of paste
Slag - - 298 - g/L of paste
Fly ash - - 298 377 g/L of paste
Silica fume - - - 405 g/L of paste
Water 558 545 542 500 g/L of paste
Superplasticizer - - - 12.5 g/L of paste
167
The four pastes were prepared in the laboratory in ten consecutive batches (two liters each) spanning 168
over three days. Each specimen was cast in a cylindrical mold (Ø35 × H60 mm for water adsorption 169
experiments and Ø51 × H80 mm for permeability assessment experiments) which was then hermetically 170
closed and kept at 20°C for seven days before unmolding. All the specimens of the same formulation 171
were immersed in a special curing solution inside an air-tight chamber (to prevent carbonation) for three 172
months. The composition of the curing solution was adjusted to prevent calcium and alkalis leaching. For 173
the CEM I, CEM II and CEM V pastes we determined the curing solution composition by expression of the 174
pore solution [39] and analysis using ionic chromatography (Table 2). The samples used for extraction 175
were kept three months in sealed bags (rather than under water to prevent dilution of the alkalis). 176
Analysis of the solutions at the beginning and end of the cure showed limited change (Table 2). 177
10
Table 2. Composition of the interstitial solutions (in mmol/L) and pH of the curing solutions before and
178
after cure of the CEM I CEM II and CEM V pastes.
179
CEM I CEM II/B CEM V/A
Na+ K+ Ca2+ pH Na+ K+ Ca2+ pH Na+ K+ Ca2+ pH
Interstitial solution 47 452 2 13.7 91 94 1 13.2 87 533 2 13.7
Begining of cure 49 439 2 13.6 90 93 3 13.3 90 518 4 13.7
End of cure 54 455 3 13.6 96 95 5 13.2 85 474 2 13.7
180
The sodium content of the three cements is quite low (and especially in comparison to the potassium 181
content). This is a direct consequence of the cements composition, low in sodium (Table 3). 182
Table 3. Chemical composition of the cements.
183
SiO2 Al2O3 Fe2O3 CaO MgO SO3 K2O Na2O MnO TiO2 LOI INS
CEM I 21.0 3.4 4.5 65.0 0.62 2.7 0.72 0.09 - - 1.3 0.2
CEM II/B 18.0 3.5 1.7 62.6 0.85 2.97 0.16 0.15 - - 9.4 1.2
CEM V/A 30.0 11.2 3.6 46.4 2.75 2.8 1.16 0.2 0.1 0.6 2.1 -
184
For the Low-pH which pore solution is known to exhibit great concentration variations in the first months 185
of hydration (portlandite is gradually consumed to precipitate new C-S-H: portlandite completely 186
disappears after two months) [38], a different approach was chosen. Several samples were reduced into 187
a rough powder and added to deionized water to generate the curing solution. 188
After the curing period, both ends (top and bottom) of each sample were sawn (using a diamond wire 189
saw with water) and discarded. This resulted in smaller cylinders (Ø35×H50 mm for water adsorption 190
experiments and Ø51×H60 mm for permeability assessment experiments) that were assumed to present 191
homogeneous properties versus height [40-42]. Because the specimens were kept under water for three 192
months after casting, full saturation at the cure end was assumed: no additional procedure was thus 193
11 used to ensure initial saturation (for instance saturation under vacuum). It was however verified on a few 194
samples that no water uptake was observed after 48 hours under water and vacuum. 195
3.2. Mineralogical composition
196
The portlandite content was measured using thermogravimetric analysis (TGA). Just after the cure, a 197
specimen was powdered in a CO2-free glove box and 120 mg (± 1 mg) were placed in an automated TG
198
analyzer (Netzsch STA 409 PC). The temperature was increased at constant rate (10 °C/min) under dry 199
nitrogen flowrate (60 mL/min). The portlandite content was computed using the mass loss obtained 200
between 400 and 600°C. 201
The C-S-H concentration was estimated following the approach of Olson and Jennings [43] that relates 202
the amount of water adsorbed at 20% RH to the C-S-H content. It was then implicitly assumed that the 203
calcium-to-silicon (C/S) ratio of the C-S-H was equal to 1.7. We took advantage of the experimental water 204
retention curves to assess the water content at equilibrium at 20%. The model proposed by Pickett [44] 205
was fitted to the experimental results and used to compute the water content at 20% (see part 3.4.). 206
3.3. Porosity and microstructure
207
The specific gravity of the saturated materials H was measured using the buoyancy method following 208
current recommendations (French standard P18-459:2010): the saturated specimens were weighed 209
under water and in air (using a 1 mg accurate device). In air, the water in excess on the specimen surface 210
was removed using a wet cloth. The measurements were done in an air-conditioned room (20 ± 2°C). 211
The porosity to water ∅ (by volume) was determined by oven-drying until constant weight; different 212
drying temperatures were used from 20°C to 105°C for comparison purposes. At 20°C and 50°C we used 213
silica gel as desiccant (RH ≈ 3%) whereas calcium chloride proved to be much more efficient at 80°C (RH 214
measured at 0.0% using capacitive hygrometer). No desiccant was used at 105°C (the RH decrease 215
12 induced by heating at 105°C is high enough). A different five-sample set was used for each configuration. 216
Due to the great number of sample-sets all the five specimens were weighed together; this explains why 217
there is no variability information in this case (no standard deviation). 218
The pore-size distribution was characterized using mercury intrusion porosimetry (MIP). Some specimens 219
were first kept a few months in sealed containers above silica gel (at 20°C and 50°C) or calcium chloride 220
(at 80°C) to remove most of the evaporable water. They were crushed into pieces (several millimeters 221
thick), freeze-dried using liquid nitrogen and eventually tested (up to 414 MPa). Three or four replicates 222
were tested for each experiment. 223
The specific surface area of each paste was assessed either directly by MIP or by post-processing the 224
experimental water desorption isotherms using the linear form of the BET model [45]: 225 I G I =JK ?KG +J K G JK ?Kℎ (11) 226 where CB and B m
w are the two BET parameters. CB is related to the energy of the first adsorbed layer and
227
AL is the water content needed to complete a monomolecular layer. The BET linear form was used to
228
check the validity domain (for which the experimental points follow a straight line). The specific surface 229
area SS was evaluated using the BET monolayer values AL using [46]:
230
28 = MNNPQ AO L (12)
231
where NA is Avogadro’s number (NA = 6.02×10²³ mol-1); V is water molar volume (V = 1.80×10⁻⁵ m3/mol at
232
20°C) and Aw is the surface area occupied by one water molecule on the sample surface. It was estimated
233 using [47, 48]: 234 R = 1.091 PV. W D X (13) 235
13
3.4. Water retention curves
236
They were characterized in a classical way using the desiccator method [49] following the protocol used 237
in [13]. Four cylinders (Ø35×H50 mm) of each formulation were put in a desiccator above a saturated salt 238
solution for RH control (sixteen specimens were then introduced into the same desiccator). The 239
specimen dimensions may seem big, but the low specific surface area of the specimens allowed us not to 240
take any precaution against carbonation and to limit the potential impact of sawing (superficial cracking). 241
The main disadvantage was the increase of the time needed to reach hygral equilibrium. We then 242
determined the whole desorption isotherm for each paste by submitting different sets of specimens to 243
different RHs (using different desiccators) simultaneously rather than submitting a unique set to 244
decreasing RH steps. This was expected to induce some variability but it allowed reducing drastically the 245
whole experiment duration. 246
This experiment was conducted at 20, 50 and 80°C. At 20°C, the desiccators were kept in an air-247
conditioned room (20°C ± 2°C) whereas ovens were used for the two other temperatures: three different 248
ovens were used for 50°C and two for 80°C. At 50°C the regulation did not appear to be fully satisfactory: 249
the temperature in the three ovens was found to be ranging from 50 to 60°C. This is believed to have 250
induced some variability in the isotherm characterization. At 80°C, the temperature variability was far 251
less than 1°C. The salt solutions used and the resulting RHs are reported in Table 4. 252
Table 4. Relative humidity as a function of temperature and saturated salt solution [50-54].
253
Saturated salt solutions Temperature
20°C 50°C 80°C
Calcium chloride CaCl2 5% 3% ≈0%
Silica gel SiO2 3% 3% ≈10%
Lithium chloride LiCl 11% 11% 11%
Magnesium chloride MgCl2 33% 31% 26%
Potassium carbonate K2CO3 43% - -
14
Sodium bromide NaBr 59% 51% 51%
Urea CO(NH2)2 - 62% -
Ammonium nitrate NH4NO3 63% - -
Potassium iodide KI 70% 64% 61%
Sodium nitrate NaNO3 - 69% 65%
Sodium chloride NaCl - 74% 76%
Ammonium sulfate (NH4)2SO4 - 79% -
Ammonium chloride NH4Cl 80% - -
Potassium chloride KCl - - 80%
Potassium nitrate KNO3 - 85% -
Sodium carbonate Na2CO3 - - 85%
Barium chloride BaCl2 90% - -
Sodium sulfate Na2SO4 - - 90%
Potassium sulfate K2SO4 98% 96% 95%
Deionized water H2O 100% 100% 100%
254
Periodically we opened each desiccator, weighed each specimen-set (weighing each sample would have 255
been too much time-consuming) and computed the corresponding relative mass variation to monitor 256 sample drying: 257 ∆A A Z =A AA (14) 258
where m(t) is the mass for the time t and the mass for the time t (t0 corresponds to the experiment
259
beginning). The difference from equilibrium was characterized using the following indicator ε which is an 260
estimator of the relative mass variation curve slope: 261 [ Z = ∆?? \G ∆?? ∆? ? (15) 262
where ]∆??^ Z and ]∆??^ Z + 1 are the relative mass variations at time t and one day after respectively. 263
From a practical point of view the ε values were estimated using the equation proposed by Baroghel-264
Bouny [55] to fit the sample mass loss evolution: 265
∆A
A Z =L\√N√ (16)
15 where A and B are two parameters to be fitted on the experimental results. The samples were let to 267
equilibrate in their containers as long as possible but they all met the following requirement: ε ≤ 0.05% 268
(note that many sets of specimens presented lower ε values at the end of the test). A graphical 269
illustration of this requirement significance is presented on Figure 1 for the CEM I specimens kept at 80°C 270
and 76% RH. The criterion was reached after 121 days. Leaving the samples for 121 more days (the 271
equilibration time was then increased by 100%) brought little improvement: the difference between the 272
relative mass variations at 121 and 242 days is about 3.5% (relative value). This value was found to be 273
lower than the variability induced by the use of a different sample-set for each RH. The resulting [ value 274
was then 0.02%. 275
276
Figure 1. Illustration of the criterion ε ≤ 0.05% for the CEM I paste kept at 80°C and 76% RH (in this
277
example A=-16.04% and B=1.522 d0.5). Note the log-scale for the indicator ε.
278
279
Once the equilibrium was reached for all the sets of specimens (that is to say when ε was lower than 280
0.05%), the desorption isotherm could be evaluated using the initial properties (specific gravity H and 281 0.01% 0.10% 1.00% 10.00% 0% 2% 4% 6% 8% 10% 12% 14% 16% 18% 0 50 100 150 200 250 E rr o r ε M a s s l o s s Time (days) Exp. Ecart e t = 121 d ε= 0.05% t = 242 d ε= 0.02% O Exp. - - - Indicatorε In d ic a to r ε 0.01% 0.1% 1% 10%
16 porosity ∅) and the relative mass variations at equilibrium. It was found convenient to describe the 282
pastes saturation state using the water content w which is defined as the ratio of water to dry solid by 283
mass. In our case it could be easily calculated using the following equation: 284
, ℎ =_ ∅_ _∅ + ∆AA , ℎ " (17)
285
where ∆A
A , ℎ is the relative mass variation at equilibrium with the relative h for the temperature T.
286
To ensure comparison between the desorption isotherm for the three temperatures a common 287
reference dry state is necessary because temperature affects the free water amount. For instance drying 288
at 20°C using silica gel (RH=3%) as proposed by Baroghel-Bouny [19, 56] is unsuitable here. It is known 289
that heating at 80°C is harmful for cementitious materials mineralogy and microstructure [57-60]. Yet as 290
far as only the first desorption is concerned (no preliminary drying and no further resaturation) drying at 291
80°C (using CaCl2) was chosen here for commodity. In so doing, it was implicitly assumed that the
292
80°C-induced degradation influence on total porosity could be neglected. The authors acknowledge that 293
drying at 80°C is not the common procedure. The reader should remind that porosity was also measured 294
using different protocols (Table 8) and it is possible to use eq. (18) to recalculate the desorption 295
isotherms (for instance 105°C). 296
Two different models were used to fit the desorption isotherms: Mualem-van Genuchten equation (eq. 297
8) was used for unsaturated water transport and Pickett’s model was used for adsorption physics. The 298
model proposed by Pickett is considered by the authors to be the only simple model describing the 299
physics of adsorption that can efficiently fit the results (type IV isotherms). Using a model based on 300
adsorption physics instead of that of van Genuchten also proved to ensure a better estimation of the 301
water content at 20% and isosteric energy qst. Pickett’s equation is an evolution of the well-known BET
302
model. It can be written under the following form: 303
17 = `9 A9 G I aI\bcIaG I G I d G I \JeI\bIaf (18) 304 where: 305
• `9 is a positive constant that is related to the energy of adsorption of the first layer;
306
• A9 the monolayer value corresponds to the water content that is needed to complete a
307
monomolecular layer; 308
• n represents the maximal number of adsorbed layers;
309
• b is related to the rate of evaporation/condensation of water molecules in the layers.
310
3.5. Permeability assessment
311
We did not measure directly the intrinsic permeability K (m2), for instance using water permeametry [61]
312
because such results are known to be unsuitable for the simulation of unsaturated water flow in 313
concretes [22]. The intrinsic permeability was rather evaluated through inverse analysis as already 314
proposed [20, 21]. For this purpose, the biggest cylinders (Ø51×H60 mm) were put in climatic chambers 315
using the constant environmental conditions reported in Table 5. Periodically the chambers were opened 316
and the samples weighed. The tests were conducted for 65 days for 20°C and 14 days for 50 and 80°C 317
respectively. 318
319
Table 5. Tests conditions for intrinsic permeability assessment tests.
320
Temperature 20°C 50°C 80°C Unit
RH 54% 85% 85% -
Liquid pressure (eq. 4) -83.29 -23.96 -25.78 MPa
Duration 65 14 14 days
18 The experimental mass variations were then described using the simplified approach detailed in part 2. 322
From a practical point of view, the finite-element code Cast3m1 was used to solve eq. (7) and compute
323
the resulting theoretical mass variation. Different intrinsic permeability values were used and the best 324
value was selected using a least-squares minimization process. For more detail about the fitting process 325
the reader is referred to [23]. A quarter of the specimen was described in axisymmetric conditions 326
(Figure 2). 7200 four-node quadrangles (80×90) were used. The time steps were adjusted to ensure 327
convergence (from a few seconds at the beginning of the simulations to one day at the end). 328
329
330
Figure 2. Schematic description of the numerical simulations for permeability assessment.
331
332
The heating stage was not described (the temperature was assumed to be constant). The initial 333
conditions were: uniform temperature (20, 50 or 80°C) and liquid pressure P=0.0 MPa (saturation). At 334
t=0, a constant pressure (Dirichlet condition) was prescribed all over the sample boundary (the
335
corresponding values are listed in Table 5). 336 1http://www.cast3m.org r z Boundary: prescribed pressure P Axis of symmetry: No water flux Hardened paste sample R =25.5 mm H = 3 0 m m Plane of symmetry: No water flux
19
4. Results
337
4.1. Feedback on the use of saturated salt solutions
338
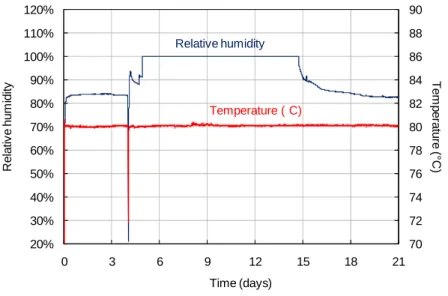
Two major drawbacks were encountered when using saturated salt solutions. First, we did not find this 339
method to be successful for RH regulation: a good illustration is given on Figure 3. We prepared a sodium 340
carbonate (Na2CO3) solution in a four-liter desiccator (the same kind as the ones used for the water
341
retention curve characterization) and left it four days in an oven at 80 ± 1°C. Temperature and RH were 342
constantly recorded using a commercial hygrometer: the RH target (85%, Table 4) was quickly reached. 343
After four days, we opened the desiccator and introduced four (saturated) paste specimens. The RH 344
within the desiccator then quickly increased to reach saturation (100%) due to the water release by the 345
four specimens. The RH only began to decrease 11 days after the samples introduction and returned to 346
the target value 14 days after. 347
348
349
Figure 3. RH and temperature evolution within a desiccator after the insertion of four paste samples (the
350
salt used is Na2CO3 resulting in RH=85% at 80°C).
351 70 72 74 76 78 80 82 84 86 88 90 20% 30% 40% 50% 60% 70% 80% 90% 100% 110% 120% 0 3 6 9 12 15 18 21 T e m p e ra tu re (° C ) R e la tiv e h u m id it y Time (days) Temperature ( C) Relative humidity
20 352
In this example, only four specimens were introduced whereas sixteen of them were used in the water 353
retention curve experiments. In so doing, we did not expect the salt solutions to successfully maintain 354
the RH in the short term for the three tested temperatures. We believe that it did result in increasing the 355
time needed to reach equilibrium: the resulting mass loss evolutions of the specimens could not be used 356
for water transport properties evaluation. This explains why supplementary isothermal drying tests were 357
conducted for permeability assessment. In a more general way, when using saturated salt solutions to 358
maintain constant conditions one should at least monitor the RH evolution or if possible adjust the 359
chamber volume to the specimens water release rate and salt used. 360
The second major problem we had to face was the crystallization of salt above the solution on the 361
desiccator walls which could eventually come in contact with the specimens and result in unacceptable 362
pollution. This was believed (but it was not verified) to be due to the handling operations needed to have 363
the samples weighed (periodical withdrawal from the oven which could project some solution on the 364
desiccator walls) and to the supersaturation induced by the solution cooling and drying (due to the 365
desiccator opening). This was hindered by periodical examination (twice a week) of all the desiccators to 366
check the salt crystallization. When present, the desiccator walls were thoroughly rinsed and dried using 367
pure water and a clean towel. When the time between two remediation operations was too small, both 368
desiccator and salt solution were eventually changed. The salts under discussion are sodium bromide 369
(NaBr) which was found to be difficult to use at 50 and 80°C whereas sodium chloride (NaCl), potassium 370
chloride (KCl) and to a lesser extent magnesium chloride (MgCl2) were only troublemaking at 80°C.
371
4.2. Mineralogical composition
372
The contents of portlandite and C-S-H of each paste are presented on Table 6. The CEM I and CEM II 373
pastes showed pretty similar results (despite the limestone filler substitution). As expected, the Low-pH 374
21 mix was free of portlandite as already observed by Codina et al. [38]. As a consequence of pozzolanic 375
reactions, the C-S-H content was high (7.4 mol/L). The CEM V paste laid between the CEM I and the Low-376
pH pastes (2.1 mol/L). 377
Table 6. Portlandite and C-S-H contents of the pastes after the cure.
378
Phase CEM I CEM II CEM V Low-pH Unit
Portlandite 5.6 5.4 2.1 0.0 mol/L of paste
C-S-H 5.1 5.0 7.0 7.4 mol/L of paste
379
A few TGA tests were also conducted using some of the specimens kept at 80°C (and CaCl2) for the
380
desorption isotherm characterization. The portlandite content of the CEM I paste was found to be almost 381
constant versus RH whereas that of the CEM V paste decreased when RH was increased. This was taken 382
as an indication of ongoing hydration (due to pozzolanic reactions) in the case of the blended cements 383
(CEM V and Low-pH). We believe that this might have had an impact on the resulting water retention 384
curves (especially at high RH and temperature) but we were unable to quantify it. 385
386
Figure 4. Portlandite content of the CEM I and CEM V pastes kept at 80°C (dashed lines are guides for the
387 eye only). 388 0 1 2 3 4 5 6 7 0% 25% 50% 75% 100% P o rt la n d it e c o n te n t (m o l/ L o f p a s te ) Relative humidity CEM I CEM V
22
4.3. Porosity and microstructure
389
The specific gravity of the saturated pastes H was measured using 134 specimens for each paste (Table 390
7). The mean values span from 1.73 (Low-pH) to 2.04 (CEM I): the value decreases when the amount of 391
supplementary cementing materials is increased. Table 8 summarizes the porosity results: the higher the 392
temperature, the higher the porosity. Yet whatever the drying temperature, the porosity value increases 393
with the amount of SCM. Table 9 presents the specific surface area values obtained for each paste using 394
MIP and the desorption isotherms (BET). Here again, the value of the specific surface area increases with 395
the amount of SCM in relation to the increased C-S-H content. The value obtained using the BET model is 396
always significantly higher than that of MIP. 397
Table 7. Specific gravity of the pastes (standard deviation in brackets).
398
Paste CEM I CEM II CEM V Low-pH
Saturated specific gravity dsat 2.04 (0.01) 1.99 (0.01) 1.93 (0.01) 1.73 (0.01)
399
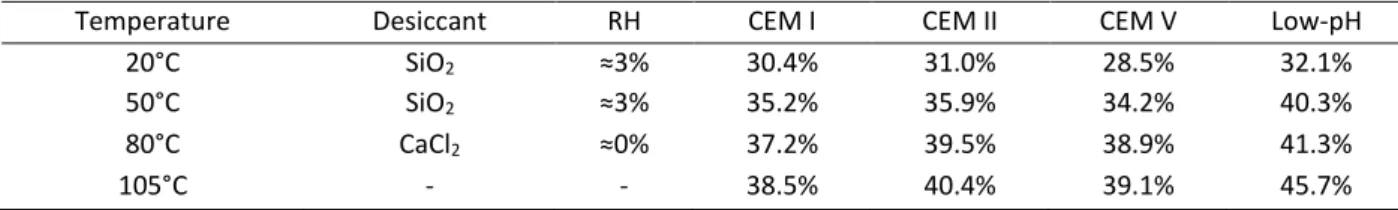
Table 8. Porosity as a function of drying temperature.
400
Temperature Desiccant RH CEM I CEM II CEM V Low-pH
20°C SiO2 ≈3% 30.4% 31.0% 28.5% 32.1%
50°C SiO2 ≈3% 35.2% 35.9% 34.2% 40.3%
80°C CaCl2 ≈0% 37.2% 39.5% 38.9% 41.3%
105°C - - 38.5% 40.4% 39.1% 45.7%
401
Table 9. Specific surface area of the four pastes.
402
Paste CEM I CEM II CEM V Low-pH Unit
Specific surface area (BET) 190 199 297 380 m2/g
Specific surface area (MIP) 30 31 59 113 m2/g
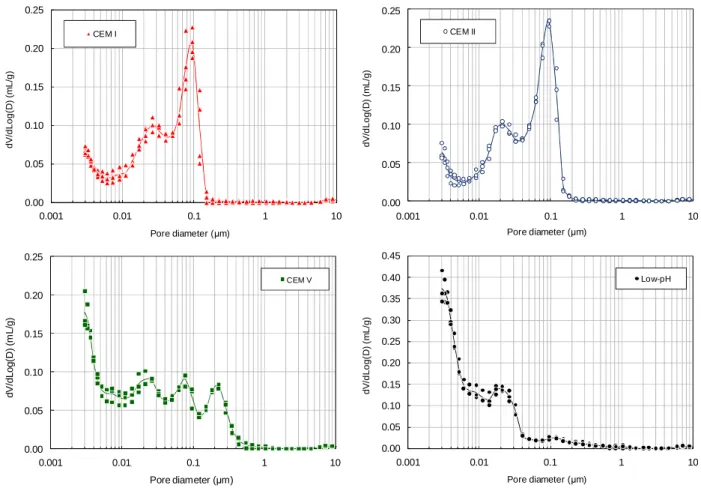
23 The MIP results are presented on Figure 5. The CEM I & CEM II pastes exhibited almost the same pore-404
size distribution. The CEM V and Low-pH pore-size distributions showed an important reduction of the 405
pores of diameter larger than 50 nm (despite the presence of an unexpected and unexplained pore 406
population around 200 nm for the CEM V) together with an important increase of pores of diameter 407
lower than 50 nm. This was attributed to the presence of SCMs in the CEM V and Low-pH mix leading to 408
supplementary C-S-H formation (see Table 6). 409
410
Figure 5. Pore-size distribution of the four hardened cement pastes as obtained using MIP and samples
411
dried at 20°C (using silica gel and then freeze-drying).
412 413 0,00 0,05 0,10 0,15 0,20 0,25 0,001 0,01 0,1 1 10 d V /d L o g (D ) (m L /g ) Pore diameter (µm) CEM I 0.00 0.05 0.10 0.15 0.20 0.25 0.001 0.01 0.1 1 10 0,00 0,05 0,10 0,15 0,20 0,25 0,001 0,01 0,1 1 10 d V /d L o g (D ) (m L /g ) Pore diameter (µm) CEM II 0.00 0.05 0.10 0.15 0.20 0.25 0.001 0.01 0.1 1 10 0,00 0,05 0,10 0,15 0,20 0,25 0,001 0,01 0,1 1 10 d V /d L o g (D ) (m L /g ) Pore diameter (µm) CEM V 0.00 0.05 0.10 0.15 0.20 0.25 0.001 0.01 0.1 1 10 0,00 0,05 0,10 0,15 0,20 0,25 0,30 0,35 0,40 0,45 0,001 0,01 0,1 1 10 d V /d L o g (D ) (m L /g ) Pore diameter (µm) Low-pH 0.00 0.05 0.10 0.15 0.20 0.25 0.30 0.35 0.40 0.45 0.001 0.01 0.1 1 10
24 The MIP results obtained using heated specimens are depicted on Figure 6. Whatever the considered 414
paste, heating led to the coarsening of the pore structure: that is to say the increase of both capillary 415
porosity and critical pore radius (corresponding to the sudden slope change in the MIP results). As 416
suggested by Brue et al. [14] ettringite dissolution [62, 63] as well as C-S-H alteration [64-66] can be 417
considered as the major causes of the pore structure modifications. 418
419
Figure 6. Pore size distribution versus temperature as obtained using MIP. Each curve corresponds to the
420
mean result of 3 or 4 tests. It was not possible to obtain reliable and repeatable results for the Low-pH
421
samples kept at 80°C: these results are not presented.
422 0.00 0.05 0.10 0.15 0.20 0.25 0.30 0.35 0.001 0.01 0.1 1 10 d V /d L o g (D ) (m L /g ) Pore diameter (µm) CEM I - 20°C CEM I - 50°C CEM I - 80°C 0.00 0.05 0.10 0.15 0.20 0.25 0.30 0.35 0.40 0.001 0.01 0.1 1 10 d V /d L o g (D ) (m L /g ) Pore diameter (µm) CEM II - 20°C CEM II - 50°C CEM II - 80°C 0.00 0.02 0.04 0.06 0.08 0.10 0.12 0.14 0.16 0.18 0.20 0.001 0.01 0.1 1 10 d V /d L o g (D ) (m L /g ) Pore diameter (µm) CEM V - 20°C CEM V - 50°C CEM V - 80°C 0.00 0.05 0.10 0.15 0.20 0.25 0.30 0.35 0.40 0.001 0.01 0.1 1 10 d V /d L o g (D ) (m L /g ) Pore diameter (µm) Low-pH - 20°C Low-pH - 50°C
25
4.4. Desorption isotherms
423
The first desorption isotherm at 20°C of the four pastes are presented on Figure 7. The depicted curves 424
are of type IV according to the classification originally proposed by Brunauer [46, 67]: one can note the 425
monomolecular layer edification at low RH as well as the presence of a plateau near saturation (at least 426
for CEMV and Low-pH) representative of capillary condensation within a meso-porous medium. 427
428
429
Figure 7. First desorption isotherm at 20°C for the four pastes. Each symbol corresponds to the mean
430
value of each sample set (at least three samples) whereas the solid lines (Pickett’s model) are just guides
431
for the eye.
432
Similarly to the MIP results, the CEM I and CEM II pastes exhibit almost the same desorption curve 433
despite the 25% clinker-substitution by carbonate filler. The two curves differ at high RH: the CEM II 434
paste retains more water at saturation than the CEM I due to higher porosity. This isotherm shape is very 435
similar to the ones obtained using ordinary cementitious materials (pastes and concretes, w/c from 0.35 436
to 0.45) by Baroghel-Bouny [56]. The CEM V and Low-pH pastes show a different general pattern. The 437 0% 6% 12% 18% 24% 30% 36% 0% 20% 40% 60% 80% 100% W a te r c o n te n t w ( b y m a s s ) Relative humidity Low-pH CEM V CEM II CEM I
26 presence of a plateau near saturation (RH=100%) is much more noticeable than for CEM I & II: the 438
desorption isotherm slope at high RH is lower than the ones of CEM I & II (due to a refined pore size 439
distribution). The water content at low RH (typically for monomolecular adsorption) is also higher than 440
for CEM I & II due to higher C-S-H content. 441
The impact of temperature on the water retention curve is depicted on Figure 8. Whatever the 442
considered paste a temperature increase induces the reduction of the water retained at equilibrium with 443
any arbitrary RH. This effect was observed over the whole RH-range and even at RH=100% for the CEM I 444
and CEM II pastes but was hardly observed for the CEM V and Low-pH pastes. This was attributed to the 445
effect of ongoing hydration as detected using TGA: the resulting mass gain helped reduce the fall in 446
water content at high RH. 447 0% 5% 10% 15% 20% 25% 0% 20% 40% 60% 80% 100% W a te r c o n te n t w (b y m a s s ) Relative humidity CEM I - 20°C CEM I - 50°C CEM I - 80°C 0% 4% 8% 12% 16% 20% 24% 28% 0% 20% 40% 60% 80% 100% W a te r c o n te n t w (b y m a s s ) Relative humidity CEM II - 20°C CEM II - 50°C CEM II - 80°C 0% 4% 8% 12% 16% 20% 24% 28% 0% 20% 40% 60% 80% 100% W a te r c o n te n t w (b y m a s s ) Relative humidity CEM V - 20°C CEM V - 50°C CEM V - 80°C 0% 5% 10% 15% 20% 25% 30% 35% 0% 20% 40% 60% 80% 100% W a te r c o n te n t w (b y m a s s ) Relative humidity Low-pH - 20°C Low-pH - 50°C Low-pH - 80°C
27
Figure 8. Desorption isotherm of the four hardened pastes as a function of temperature (water content).
448
Each symbol corresponds to the mean value of each sample set (at least three samples) whereas the solid
449
lines stand for the interpolation using Pickett’s model.
450
4.5. Isoteric energy
451
The isosteric energy of adsorption qst was assessed using eq. (1). The RH h at equilibrium with the water
452
content w was evaluated using Pickett’s model (eq. 18) and the vapor pressure pv was calculated using
453
Rankine’s equation: 454
gh , = ℎ , gh = ℎ , -ijkg l −m (19)
455
with Pa=101325 Pa; l = 13.7 and n = 5120 K. The function used to interpolate gh is of first
456
importance because it appeared to influence the results obtained (the evolution remains unchanged but 457
the values are modified). The resulting isosteric energy evolutions are plotted on Figure 9 as functions of 458
coverage O
O? (number of adsorbed layers). This presentation allows the results to be fully comparable 459
(and not to depend on density and porosity). Apart from the Low-pH mix all the curves exhibit the same 460
evolution: qst increases at low coverage (typically between 0.0 and 0.5) from 70 kJ/mol to reach a
461
maximal value (around 100 kJ/mol) and then continuously decreases to get close to the average water 462
enthalpy of condensation (43.7 kJ/mol between 20 and 80°C) at high coverage. Note that the uncertainty 463
related to the maximal isosteric evaluation process was estimated to ± 10 kJ/mol. 464
28 466
Figure 9. Isosteric energy of adsorption qst of the four considered hardened cement pastes.
467
468
Most of qst variations can be observed in the first layer (that is to say for w/wm less than 1.0) which is
469
representative of the strong interaction between the first water layer and the hardened cement paste. 470
The qst decrease (for w/wm greater than 0.5) is representative of the decrease of the cementitious
471
material influence with the increase of the distance between the newly adsorbed water molecules and 472
substrate. The asymptotic value for high coverage (43.7 kJ/mol) corresponds to the average water 473
condensation energy (between 20 and 80°C): it can be considered that there is no more influence of the 474
cementitious material substrate and all water molecules are bonded the ones to the others (liquid state 475
representative of capillary condensation). 476
An increase in qst in the first layer is not common: monotonic decrease is generally observed. In our case,
477
the maximum might just be due to the isosteric energy estimation process (use of Pickett’s model rather 478
than another arbitrary function for instance) and to the lack (and variability) of the experimental results 479
in the monolayer zone (between 0 and 30% RH). Yet a maximum has already been observed for different 480 0 20 40 60 80 100 120 0 1 2 3 4 Is o s te ri c e n e rg y o f a d s o rp ti o n qs t [k J /m o l] Coverage (w/wm) CEM V CEM II CEM I Low-pH Condensation heat
29 materials [68-76]. For hydrophobic materials such as activated carbons [70, 71] qst increases from low
481
values at low coverage (due to the lack of hydrophilic sites) up to the condensation enthalpy in relation 482
to the formation of water clusters. For hydrophilic materials the increase is usually explained by the 483
swelling of the dry matrix resulting in the exposure of new adsorption sites of high binding energy. When 484
all the high energy sites are occupied water adsorption occurs on less energetic sites leading to the qst
485
decrease. In the case of cementitious materials, the qst increase might be due to the desaturation and
486
the subsequent collapse of the C-S-H interlayer space [77, 78] preventing water access to high-binding 487
energy adsorption sites within the C-S-H interlayer. This simple assumption would deserve additional 488
experiments to be confirmed (or infirmed). 489
Figure 10 presents the comparison between the isosteric energy obtained in this study (open circles) for 490
the CEM I paste and the corresponding concrete (filled circles) [13, 17]. It is obvious that the two 491
evolutions do not match: the maximal value obtained for the concrete is about 66 kJ/mol whereas it 492
reaches 100 kJ/mol for the paste. One could then conclude that there is no consistency between these 493
two results. As a matter of fact, two different models were used to describe the desorption isotherm in 494
both cases: GAB and Pickett models for the concrete and the paste respectively. These models were used 495
to calculate the RH (and then the vapor pressure) at equilibrium with any arbitrary water content as 496
needed for Clausius-Clapeyron equation, see [17] for more details. When we used Pickett’s model to 497
evaluate the concrete isosteric energy from the CEM I paste results we obtained an almost perfect 498
match. The equation used for the description of the water retention curve (GAB or Pickett in our case) 499
appears to be very important since it greatly influences the resulting isosteric energy qst. As a
500
consequence when handling such data, one has to be very careful and be consistent in the choice of the 501
model used to describe the water retention curve in order to avoid erroneous results. 502
30 503
Figure 10. Comparison between the isosteric energy evolutions obtained in this study and in a previous
504
study [13, 17].
505
506
This good isosteric energy correspondence was also supported by the comparison between paste and 507
concrete desorption isotherm as shown in Figure 11. Figure 11 (a) presents the experimental desorption 508
isotherm at 80°C for the CEM I paste tested in this study and the corresponding concrete studied in [13]. 509
To make the two isotherms comparable (porosity and density are different) the water content w was 510
divided by its maximal value wmax. The two datasets describe almost the same curve (despite the
511
variability). Figure 11 (b) presents the comparison between the CEM I concrete desorption isotherm 512
acquired at 30°C and the CEM I paste curve estimated using Clausius-Clapeyron and Pickett’s model and 513
the corresponding isosteric energy qst (Figure 10). Once again, the comparison is very good. It is known
514
that for high-performance materials the presence of aggregates does not influence the water retention 515
curve [55, 56]: these results also show that it does not influence the isosteric energy (that is to say the 516
variation induced by temperature). 517 0 20 40 60 80 100 120 0 1 2 3 4 Is o st e ri c e n e rg y o f a d s o rp ti o n q s t [k J /m o l] Coverage w/wm
CEM I concrete (Pickett) CEM I paste (this study) CEM I concrete (GAB) Condensation heat
31 518
(a) Desorption isotherms at 80°C (CEM I paste and corresponding concrete)
(b) Desorption isotherm at 30°C
Figure 11. Comparison between the desorption isotherms of the CEM I paste tested in this study and the
519
corresponding concrete [13].
520
4.6. Water transport
521
Figure 12 presents the experimental mass loss evolution of the samples dried at 20°C and 54% RH (the 522
initial mass of the saturated specimens was taken as reference/standard to compute mass loss). The 523
CEM II paste exhibited the fastest mass loss (7% after 60 days) far above the CEM I (4.5% after 60 days). 524
Here the effect of the 25% clinker substitution by limestone filler appeared to have a significant impact 525
(unlike the pore-network distribution and desorption isotherm). The CEM V and Low-pH pastes showed 526
almost the same mass loss evolution (3.3% after 60 days). 527 0.0 0.2 0.4 0.6 0.8 1.0 0% 20% 40% 60% 80% 100% w / wm a x Relative humidity Exp. - CEM I concrete (80°C) Exp. - CEM I paste (80°C) Fit. Pickett - CEM I paste (80°C)
0,0 0,2 0,4 0,6 0,8 1,0 0% 20% 40% 60% 80% 100% Relative humidity Exp. - CEM I concrete (30°C) Sim. CEM I paste (30°C) 1.0 0.8 0.6 0.4 0.2 0.0
32 528
Figure 12. Experimental mass loss of the paste samples dried at 20°C and 54% RH.
529
The two van Genuchten’s parameters P0 and m needed in eq. (8) were fitted on the experimental
530
desorption isotherms (Figure 13): the corresponding values are reported in Table 10. At 20°C the values 531
obtained are consistent with the literature [19, 22, 28]. It is noteworthy that when temperature 532
increases the m values remain stable whereas those of P0 decrease. The relative permeability evolutions
533
at 20°C are depicted on Figure 14 (a). As expected the finer the pore size distribution, the lower the 534
relative permeability decrease with saturation. The relative permeability evolutions can be classified in 535
the following order: Low-pH > CEM V > CEM I > CEM II. 536 537 0% 1% 2% 3% 4% 5% 6% 7% 8% 0 10 20 30 40 50 60 70 M a ss lo s s Time (days) CEM II CEM I CEM V Low-pH
33
Figure 13. Desorption isotherm of the four hardened pastes as a function of temperature (saturation)
538
fitted using van Genuchten equation.
539
540
Table 10. Van Genuchten parameters and permeability values.
541
Paste CEM I CEM II CEM V Low-pH Unit
20°C P0 51.4 42.5 96.9 108.7 MPa m 0.465 0.437 0.529 0.578 - K 2.0×10⁻²² 8.0×10⁻²² 7.0×10⁻²³ 2.5×10⁻²³ m2 50°C P0 18.9 14.7 47.1 56.8 MPa m 0.457 0.425 0.506 0.605 - K 3.0×10⁻²² 22.0×10⁻²² 3.0×10⁻²³ 4.6×10⁻²³ m2 80°C P0 8.1 5.2 23.5 40.3 MPa m 0.458 0.436 0.517 0.595 - K 140.0×10⁻²² 600.0×10⁻²² 150.0×10⁻²³ 18.0×10⁻²³ m2 542 0% 5% 10% 15% 20% 25% 0% 20% 40% 60% 80% 100% W a te r c o n te n t w ( b y m a s s ) Relative humidity CEM I - 20°C CEM I - 50°C CEM I - 80°C 0% 4% 8% 12% 16% 20% 24% 28% 0% 20% 40% 60% 80% 100% W a te r c o n te n t w (b y m a s s ) Relative humidity CEM II - 20°C CEM II - 50°C CEM II - 80°C 0% 4% 8% 12% 16% 20% 24% 28% 0% 20% 40% 60% 80% 100% W a te r c o n te n t w (b y m a s s ) Relative humidity CEM V - 20°C CEM V - 50°C CEM V - 80°C 0% 5% 10% 15% 20% 25% 30% 35% 0% 20% 40% 60% 80% 100% W a te r c o n te n t w (b y m a s s ) Relative humidity Low-pH - 20°C Low-pH - 50°C Low-pH - 80°C
34 (a) Relative permeability kr (b) Effective permeability Kkr
Figure 14. Relative (a) and effective (b) permeability of the four hardened cement pastes at 20°C.
543
Table 10 recapitulates the intrinsic permeability values assessed using inverse analysis. At 20°C they can 544
be classified in the exact inverse order obtained for the relative permeability as shown in Figure 14 (b): 545
CEM II > CEM I > CEM V > Low-pH. This order is consistent with the pastes pore-network fineness as well 546
as the C-S-H content. Figure 15 presents the permeability variations induced by temperature. Unlike the 547
results of Powers [5], they could not be described the classical Arrhenius law (the points were not 548
aligned in the log-scale plot). For fitting purposes a double exponential law (eq. 20) was alternatively 549 proposed: 550 5 = 5 jkg jkg Cop.Gq r − 1" (20) 551 1.E-07 1.E-06 1.E-05 1.E-04 1.E-03 1.E-02 1.E-01 1.E+00 0.0 0.2 0.4 0.6 0.8 1.0 R e la ti v e p e rm e a b ili ty kr Saturation Low-pH CEM V CEM I CEM II 1.E-28 1.E-27 1.E-26 1.E-25 1.E-24 1.E-23 1.E-22 1.E-21 0.0 0.2 0.4 0.6 0.8 1.0 E ff e c ti v e p e rm e a b ili ty K kr (m ²) Saturation CEM II CEM I CEM V Low-pH
35 where 5 and s are two positive parameters, the values of which are reported in Table 11. It has to be 552
noted that the CEM V paste showed an unexpected and unexplained permeability decrease between 20 553
and 50 °C which cannot be described using eq. (18). 554
555
(a) Direct measurement from Powers (1979) (b) Inverse analysis from this study
Figure 15. Permeability versus temperature: (a) following Powers [5], using water permeametry between
556
0 and 30°C and (b) inverse analysis from this study.
557
Table 11. Parameters for the description of temperature influence on permeability (eq. 20).
558
Parameter CEM I CEM II CEM V Low-pH Unit
5 12.2×10⁻²³ 69.1×10⁻²³ N/A 2.4×10⁻²³ m² s 35.7 35.7 N/A 55.6 K 1 10 100 1000 -5 5 15 25 35 P e rm e a b ili ty ( × 1 0 -2 1m 2) Temperature (°C) w/c = 0.801 w/c = 0.701 w/c = 0.619 w/c = 0.502 (Powers, 1979) 1 10 100 1000 10000 0 20 40 60 80 100 P e rm e a b ili ty ( × 1 0 -2 3m 2) Temperature (°C) CEM II CEM I CEM V Low-pH
36
5. Discussion
559
The use of Clausius-Clapeyron to describe the water retention curve temperature induced modifications 560
implicitly assumes that the cementitious material pore structure remains unchanged. This assumption 561
was found to be acceptable for a high-performance concrete between 30 and 80°C [13]. The coarsening 562
of the pore structure observed using MIP in this study (from 20 to 80°C) is supported by the permeability 563
results and the unsuccessful comparison with the results of Powers [5] (Figure 15). He showed that 564
between 0 and 30°C (temperature range within which no temperature induced modification of the pore 565
structure was expected) the permeability variations can be fitted by a classical Arrhenius law. In our case 566
the permeability variations are too big to be fitted by such a function. This is consistent with an increase 567
of the transport properties associated to porosity opening. There is however other potential causes of 568
the important permeability increase. Heating up to 80°C might have caused microcracking or increased 569
the contribution of water transport in the gaseous phase which is not accounted for in our simplified 570
approach. This might have resulted in overestimating the pastes permeability values at high 571
temperature. 572
The coarsening of the pore structure observed calls into question the use of Clausius-Clapeyron and the 573
corresponding assumption of unaltered microstructure. Indeed it is true that the pore structure coarsens 574
when temperature increases: the error induced by our assumption also increases with temperature. 575
Nevertheless, we believe that thermal desorption is the major mechanism at work for moderate 576
temperatures (let us state up to 50°C). For temperatures up to 80°C, alteration of the pore structure 577
might have a non-negligible impact on the water retention curve. Unfortunately there is nowadays no 578
way to quantify the link the pore structure determined using MIP and the water retention curve and 579
Clausius-Clapeyron remains the only available tool to describe the influence of temperature. 580
Consequently it is difficult to estimate the error associated to our assumption. In a simple way one could 581
37 characterize the water retention curves at 20°C of samples preliminary treated at higher temperatures 582
(from 20 to 80°C) and analyze the results to evaluate the contribution of the microstructure variation. 583
6. Conclusion
584
Temperature has a great importance for water transport in cementitious materials. This issue is of first 585
importance for the durability assessment of reinforced concrete structures for radioactive waste 586
management. An experimental campaign was then designed to determine the influence of temperature 587
on cementitious materials water transport properties. Four hardened cement pastes of interest for 588
radioactive waste management were selected. Using a simplified approach, the transport of water was 589
described using liquid permeation only. This allowed reducing the number of properties to acquire 590
experimentally: porosity, water retention curve and (intrinsic and relative) permeability. 591
The water retention curve was characterized using the saturated salt solution method. The unsaturated 592
permeability was assessed using inverse analysis making use of the Mualem-van Genuchten model. 593
Three temperatures were tested: 20, 50 and 80°C. As expected, temperature was found to have a great 594
impact on the water retention curve: a temperature increase decreased the water content at equilibrium 595
for all the pastes. The intrinsic permeability value significantly increased with temperature, but the data 596
obtained do not follow Arrhenius activation law. These results constitute a valuable and consistent data 597
set for the description of water transport in the field of radioactive waste management. 598
The temperature induced alteration of the water retention curves were described using Clausius-599
Clapeyron equation and the corresponding isosteric energy of adsorption was evaluated. In so doing, the 600
microstructure was assumed not to be altered during the heating. The coarsening of the pore structure 601
subsequent to heating was however highlighted using MIP. The water retention curve modifications 602
38 were then assumed to result from a combination of thermal desorption (described by Clausius-Clapeyron 603
equation) and pore structure coarsening. The influence of the latter remains to be evaluated. 604
Acknowledgements 605
This work was financially supported by the French agency for radioactive waste management (Andra). 606
7. References
607
[1] K. Tuutti, Corrosion of steel in concrete, Swedish Cement and Concrete Research Institute, 1982, pp. 608
468. 609
[2] B.P. Hughes, I.R.G. Lowe, J. Walker, The diffusion of water in concrete at temperatures between 50 610
and 95°C, British Journal of Applied Physics, 17 (1966) 1545-1452. 611
[3] N.L. Hancox, The role of moisture diffusion in the drying of cement paste under the influence of 612
temperature gradients, Journal of Physics D: Applied Physics, 1 (1968) 1769-1777. 613
[4] G.M. Glover, E. Rassk, Water diffusion and microstructure of hardened cement pastes, Materials and 614
Structures, 5 (1972) 315-322. 615
[5] T.C. Powers, The specific surface area of hydrated cement obtained from permeability data, Materials 616
and Structures, 12 (1979) 159-168. 617
[6] J.-F. Daïan, Condensation and isothermal water transfer in cement mortar, part I - pore size 618
distribution, equilibrium, water condensation and imbibition, Transport in Porous Media, 3 (1988) 563-619
589. 620
[7] S.F. Wong, T.H. Wee, S. Swaddiwudhipong, S.L. Lee, Study of water movement in concrete, Magazine 621
of Concrete Research, 53 (2001) 205-220. 622
[8] R. Černy, J. Drchalová, P. Rovnaníková, The effects of thermal load and frost cycles on the water 623
transport in two high-performance concretes, Cement and Concrete Research, 31 (2001) 1129-1140. 624
39 [9] M. Jooss, H.W. Reinhardt, Permeability and diffusivity of concrete as function of temperature,
625
Cement and Concrete Research, 32 (2002) 1497-1504. 626
[10] J. Hundt, H. Kantelberg, Sorptionsuntersuchungen an zemestein, zementmörtel und beton (in 627
german), Deutscher Ausschuss für Stahlbeton, Heft 297 (1978) 25-39. 628
[11] F. Radjy, E.J. Sellevold, K.K. Hansen, Isosteric vapor pressure-temperature data for water sorption in 629
hardened cement paste: enthalpy, entropy and sorption isotherms at different temperatures, Report 630
BYG-DTU R057, Technical University of Denmark (DTU), Lyngby, Denmark, 2003, pp. 58. 631
[12] T. Ishida, K. Maekawa, T. Kishi, Enhanced modeling of moisture equilibrium and transport in 632
cementitious materials under arbitrary temperature and relative humidity history, Cement and Concrete 633
Research, 37 (2007) 565-578. 634
[13] S. Poyet, Experimental investigation of the effect of temperature on the first desorption isotherm of 635
concrete, Cement and Concrete Research, 39 (2009) 1052-1059. 636
[14] F. Brue, C.A. Davy, F. Skoczylas, N. Burlion, Effect of temperature on the water retntion properties of 637
two high-performance concretes, Cement and Concrete Research, 42 (2012) 384-396. 638
[15] J. Jiang, Y. Yuan, Relationship of moisture content with temperature and relative humidity in 639
concrete, Magazine of Concrete Research, 65 (2013) 685-692. 640
[16] M. Wu, B. Johannesson, M. Geiker, A study of the water vapor sorption isotherms of hardened 641
cement pastes: possible pore structure changes at low relative humidity and the impact of temperature 642
on isotherms, Cement and Concrete Research, 56 (2014) 97-105. 643
[17] S. Poyet, S. Charles, Temperature dependence of the sorption isotherms of cement-based materials: 644
heat of sorption and Clausius-Clapeyron formula, Cement and Concrete Research, 39 (2009) 1060-1067. 645
[18] H. Pan, J.A. Ritter, P. Balbuena, Examination of the approximations used in determining the isosteric 646
heat of adsorption from the Clausius-Clapeyron equation, Langmuir, 14 (1998) 6323-6327. 647


![Table 4. Relative humidity as a function of temperature and saturated salt solution [50-54]](https://thumb-eu.123doks.com/thumbv2/123doknet/13132768.388146/14.892.167.730.895.1068/table-relative-humidity-function-temperature-saturated-salt-solution.webp)