HAL Id: halshs-00645867
https://halshs.archives-ouvertes.fr/halshs-00645867
Preprint submitted on 28 Nov 2011
HAL is a multi-disciplinary open access archive for the deposit and dissemination of sci-entific research documents, whether they are pub-lished or not. The documents may come from teaching and research institutions in France or
L’archive ouverte pluridisciplinaire HAL, est destinée au dépôt et à la diffusion de documents scientifiques de niveau recherche, publiés ou non, émanant des établissements d’enseignement et de recherche français ou étrangers, des laboratoires
A Note on a Weighted Voting Experiment: Human
Mistakes in Cooperative Games
Eric Guerci, Nobuyuki Hanaki, Naoki Watanabe, Gabriele Esposito, Xiaoyan
Lu
To cite this version:
Eric Guerci, Nobuyuki Hanaki, Naoki Watanabe, Gabriele Esposito, Xiaoyan Lu. A Note on a Weighted Voting Experiment: Human Mistakes in Cooperative Games. 2011. �halshs-00645867�
1
GREQAM
Groupement de Recherche en Economie Quantitative d'Aix-Marseille - UMR-CNRS 6579 Ecole des Hautes études en Sciences Sociales
Universités d'Aix-Marseille II et III
Document de Travail
n°2011-53
A Note on a Weighted Voting Experiment:
Human Mistakes in Cooperative Games
Eric Guerci
Nobuyuki Hanaki
Naoki Watanabe
Gabriele Esposito
Xiaoyan Lu
November 2011
A Note on a Weighted Voting Experiment:
Human Mistakes in Cooperative Games
∗Eric Guerci† Nobuyuki Hanaki‡ Naoki Watanabe§ Gabriele Esposito¶ Xiaoyan Lu∥
November 10, 2011
Abstract
We conducted a sensitivity analysis of results in weighted voting experiments by varying the following two features of the protocol by Montero et al. (2008): (a) the way subjects’ roles are reassigned in each round (random versus semi-fixed roles) and (b) the number of proposals that subjects can approve simultaneously (multiple versus single approval). We found that the possibility of simultaneously approving many proposals (multiple approvals) may result in more confusion and mistakes by subjects than the case without such a possibility (single approval). We also found that frequencies of minimal winning coalitions (MWCs) observed under the protocol with semi-fixed roles and single approval are consistent with our hypothesis: each subject prefers a MWC in which his or her relative weight is larger, and the probability of each MWC occurring depends on a score in the social ordering determined by the Borda count, when there is no veto player.
JEL Classification Numbers: C71, C92, D72
Keywords: weighted voting, experiment, cooperative game, mistakes, winning coalition
∗We have greatly benefited from comments and suggestions from Maria Montero. Experimental Economics lab
at Montpellier (LAMETA), in particular, Dimitri Dubois, has kindly hosted us for running this experiment. Finan-cial supports from IEF Marie Curie research fellowship n.237633-MMI (Guerci), Japan Economic Research Foundation (Hanaki), the MEXT Grant-in-Aid 20330037 (Watanabe), and JSPS-CNRS bilateral research project are gratefully ac-knowledged.
†Aix-Marseille Univ. and GREQAM. E-mail: [email protected]
‡Aix-Marseille Univ., I.U.F. and GREQAM. E-mail: [email protected]
§Corresponding author. Faculty of Engineering, Information, and Systems. University of Tsukuba, 1-1-1 Tennodai,
Tsukuba 335-8573, Japan.Phone & Fax: +81-29-853-5166, E-mail: [email protected].
¶EHESS and GREQAM. E-mail: [email protected]
1
Introduction
Weighted voting, which gives different numbers of votes (voting weights) to different voters, is one of the most popular collective decision-making systems for many contexts, including stockholder voting in corporations and multi-party legislatures. In such a system, however, the distribution of voters’ actual voting powers is often remarkably different from the distribution of their nominal voting weights.1 The relationships between the distribution of voting weights and voting powers are too complex to be foreseen, although several power indices have been proposed to measure “a priori” powers of voters, by Shapley and Shubik (1954), Banzhaf (1965), Deegan and Packel (1978), and many other researchers.
Experiments of weighed voting are recently attracting much interest among researchers. This new strand of research emerged to complement the empirical analyses of voting powers because experiments can control many features that are unobservable in real practices. Among such re-searchers, Montero et al. (2008) and Aleskerov et al. (2009) conducted experiments on weighted voting in a cooperative game environment, in the sense that no explicit structure as to how nego-tiations take place is defined.2 In their experiments, it was observed that subjects eventually learn to form minimal winning coalitions (MWCs), i.e., winning coalitions such that a deviation of any member of the coalition turns the coalition from winning to losing. The formation of MWCs is consistent with the “size principle” proposed by Riker (1962).
The experimental confirmations of the size principle naturally lead to the following question: when there are several possible MWCs, is there any regularity regarding the observed frequencies with which these MWCs are formed? In the theory of power indices, Deegan and Packel (1978) proposed a power index (DP index) that is computed with a focus on the MWCs, but they assumed that all the possible MWCs are equally likely and that, within each MWC, resources are allocated equally among its members. Packel and Deegan (1980) generalized the DP index by giving a system of axioms for the weighted DP index, but they did not provide any insights on the probability of each MWC occurring. Thus, the above question on the observed frequencies of MWCs has remained open.3
In our earlier experiment (Esposito et al., 2011), the observed frequencies of various MWCs when there is no veto player can be explained nicely by hypothesizing that each voter prefers a
1
Felsenthal and Machover (1998), for example, noted this in their study of the Council of Ministers in the European Economic Community.
2
Fr´echette et al. (2005b), Drouvelis et al. (2010), and Kagel et al. (2010), on the other hand, conducted their ex-periments in non-cooperative game environments based on the variants of legislative bargaining by Baron and Ferejohn (1989). The analysis by Fr´echette et al. (2005a) was based on the demand bargaining model by Morelli (1999).
3
Shapley and Shubik (1954) and Banzhaf (1965) proposed power indices (SSI and Banzhaf index, respectively) in their seminal works on this topic, in which they assumed that all the winning coalitions are equally likely.
MWC to another MWC when his or her relative weight in the MWC is larger than the one in the other MWC, and that the probability of each MWC occurring depends on a score in the social ordering determined by the Borda count, given such individual preferences of voters over MWCs.4 In contrast, the results by Montero et al. (2008) and Aleskerov et al. (2009) show MWCs involving two players are disproportionately more likely to be observed, to an extent that the above hypothesis cannot explain, than those with three players.5 We need, therefore, to accumulate more experimental results in order to shed light on the above open question regarding the observed frequencies of MWCs and to contribute to future developments in the theory of power indices.
This methodological note is a step toward this goal, and it aims to illustrate the sensitivity of experimental results to small changes in the experimental design. It is often noted by researchers that results of laboratory experiments are sensitive to the exact design of the experiments, such as the degree of abstraction in the description of the strategic situation under study.6 It is, therefore, of considerable value to first conduct a sensitivity analysis and to search for a better experimen-tal design before starting to consider various apportionments of votes in order to experimenexperimen-tally investigate possible regularities in the frequencies with which possible MWCs are formed.
We conducted a set of experiments that vary the following two features of the protocol in the weighted voting experiment by Montero et al. (2008): (a) random reassignment of subjects’ roles in each round and (b) multiple simultaneous approval of proposals by subjects, in order to test the robustness of the experimental results. Namely, we consider two role reassignments, random roles (RR) and semi-fixed roles (SFR), as well as two approval schemes, multiple approvals (MA) and single approval (SA). It was observed that the possibility of simultaneously approving many proposals (MA) may result in more confusion and mistakes by subjects than the case without such a possibility (SA). This observation suggests that, in a complex experiment such as the one we consider here, a particular design features can lead to more confusion and mistakes by subjects, and thus might result in unreliable observations. It was also observed that the above hypothesis shown
4
Esposito et al. (2011) intended to investigate the possibility of subjects learning about the relationship between the distribution of voting weights and voting powers from their limited experiences. For this purpose, some of the subjects were chosen to be “learners” at the beginning of the experiment. The learner, for example, as player 1, needs to choose a vote apportionment between [14; 3,5,7,7] and [14; 4,4,5,9] or between [14; 5,3,7,7] and [14; 4,4,6,8] where the quota (the minimum number of votes required to implement a proposal) is 14 and the list of voting weights of four voters is represented by the four remaining comma-delimitated numbers (first stage). Given the resulting vote apportionment, the four members of a group negotiate and allocate 100 points among themselves (second stage).
5
For example, Montero et al. (2008) examined a weighted voting game [5; 3, 2, 2, 1]. They found that, in the later rounds, almost all the winning coalitions were those of player 1 (with 3 votes) and player 2 or 3 (with 2 votes each). The coalition involving players 2, 3, and 4 (with 2 votes, 2 votes, and 1 vote, respectively) were rarely formed. The purpose of their study, however, was not to examine the observed frequencies of MWCs per se.
6Chou et al. (2009) illustrated how experimenters have to be careful about describing the strategic situation to the
subjects. It is possible that subjects do not understand even a remarkably simple strategic situation unless it is described in terms that the subjects are familiar with from their day-to-day lives.
in Esposito et al. (2011) is valid only under one of the four protocols we have tested, i.e., semi-fixed roles and single approval (SFR-SA).
The rest of the paper is organized as follows. Section 2 describes the experimental procedure. We introduce the four protocols in the weighted voting experiments. The results of our experiments are summarized in Section 3. Section 4 concludes this paper with remarks on the literature and suggestions for further research.
2
Experimental design
In our experiments, four players propose how to allocate 100 points or approve others’ proposals. A weighted voting game with four players is represented by [q; v1, v2, v3, v4], where q is the quota (the
least number of votes required to implement a proposal) and viis the voting weight (the number of
votes) player i has. This is referred to as a game for short in this paper. We deal with two games examined in Esposito et al. (2011) in which there is no veto player (a voter who belongs to every winning coalition): (a) [14; 4, 4, 6, 8] and (b) [14; 7, 7, 3, 5], which we will refer to hereafter as game (a) and game (b). Our experimental design basically follows the protocol by Montero et al. (2008), varying its two features; thus, we have four treatments (protocols).
Each experiment involves 16 subjects. Upon arrival, they are provided with written instructions, and then the experimenter reads these aloud. Subjects can ask questions regarding the instructions by raising their hand, but communication among subjects is strictly prohibited; thus, their interac-tions are only through the information they exchange via their computer screens. Each experiment consists of 20 rounds. In each round, subjects propose how to allocate 100 points among four members or approve others’ proposals. If a proposal obtains the required number of votes, then the proposal is implemented and the round is terminated. Before proceeding to the experiment, subjects play one practice round with the game [3; 1, 1, 1, 1] to familiarize themselves with the soft-ware. Subjects play game (a) in the first 10 rounds and game (b) in the second 10 rounds. Subjects are informed of the fact that they will face two different situations in these 10 rounds, but are not informed of the apportionment of the votes nor the quota prior to Rounds 1 and 11.
At the beginning of each round, all subjects are re-grouped into groups of four players. Subjects are not informed of who are in the same group. In re-grouping, we consider two role assignments:
RR and SFR. Under RR, the numbers of votes subjects have are randomly re-assigned in every
round. Thus, the subjects who are playing the role of player 1 (with 4 votes in case of game (a)) can become player 2, 3, or 4 in the next round. Under SFR, on the other hand, 16 subjects are randomly divided into two groups, groups A and B, at the beginning of the experiment. Subjects in group A (B) will be either player 1 or 2 (3 or 4) throughout the experiment and will never become player 3
Figure 1: Screen of player 2. His or her proposal-input table is on the left-hand side.
or 4 (1 or 2). Thus, in the first 10 rounds, subjects in group A will always have 4 votes, while those in group B will have either 6 or 8 votes. In the subsequent 10 rounds, those in group A will always have 7 votes, while those in group B will have either 3 or 5 votes.
Both Montero et al. (2008) and Aleskerov et al. (2009) adopted RR, and noted its potential (positive or negative) effect on how subjects learn to play the game, compared to fixed roles (in which subjects have the same numbers of votes throughout the experiment). They do not, however, investigate experimentally how varying RR affects their observations. We chose SFR, instead of fixed roles, based on the set-up in Esposito et al. (2011), in order to confirm observations in our earlier experiment.
Once a round begins, each subject observes the quota and his or her role in the upper left-hand corner of the screen, both highlighted in red.7 (See Figure 1). Below the information, there is a table in which the number of votes each player has is shown. In this proposal-input table, by entering four non-negative numbers that add up to exactly 100 and then by pressing a “propose” button (red), each subject can make a proposal at any time during the round. Subjects can make proposals as many times as they wish during the round, but they are allowed to make only one proposal at a time. We randomize the order of players’ appearance in the proposal-input table, following Aleskerov et al. (2009), to eliminate the effect of a fixed order on our observations.8
7
The screens were translated into Japanese for experiments in Tsukuba and into French for those in Montpellier.
8
Aleskerov et al. (2009) noted that a fixed order of players in the proposal-input table might induce a non-trivial impact on the observations. In the game [4; 3,2,2], for example, when the players are ordered from the left to the right
When a proposal is made, it is immediately shown to the other members of the relevant group in their proposal-approval tables, which is on the right-hand side of their screens. Each of them can approve the proposal by pressing an “approval” button in the table. The proposal-input table of the proposer is replaced with his or her proposal-confirmation table. The proposal is automatically approved by the proposer. If a proposal is approved by a subject, then a “withdraw” button appears in his or her proposal-approval or proposal-confirmation table. At any time during the round, subjects can withdraw their current proposals and approvals by pressing this button.
We consider two approval schemes: MA and SA. Under MA, each subject can approve more than one proposal, including his or her own, simultaneously, and all votes the subject has are cast for each proposal he or she approves. Under SA, on the other hand, each subject can be in favor of only one proposal, including his or her own, at a time. Thus, under SA, if a subject who has made a proposal wishes to approve a proposal made by another, that subject must first withdraw his or her own proposal. In the same manner, if a subject who has approved a proposal made by another wishes to approve a different proposal or to propose his or her own, the subject must first withdraw his or her current approval. As noted above, neither MA nor SA allows subjects to simultaneously make multiple proposals, so that when a subject under either scheme wishes to make a new proposal, he or she must withdraw his or her previous proposal before proposing a new one.
Figure 2 shows the screen of player 2 at a time that the player has four possible actions: (1) do nothing (remain “silent”), (2) approve the proposal made by player 1, (3) approve the proposal made by player 4, and (4) make his or her own proposal to the others. When player 2 chooses (4) before any other player has taken an action, this screen (Figure 2) will change to one of those shown in Figure 3. The differences in the appearance of the screens between MA and SA can be seen in Figure 3, in which the top (bottom) figure shows the screen shot for MA (SA). Under MA, the two “approve” buttons in red on the right-hand side of the screen are still shown in addition to the “withdrawal” button on the left-hand side of the screen, whereas they do not appear any more under SA.
The absence of explicit structures (extensive forms) in cooperative game environments favors MA over SA, although SA still retains remarkably little structure compared to the negotiation proto-cols pre-determined in detail in non-cooperative game environments such as the legislative bargain-ing model (Baron and Ferejohn, 1989) and its variants studied by Fr´echette et al. (2005b), Drouvelis et al. (2010), and Kagel et al. (2010). MA, however, allows subjects to approve many proposals si-multaneously, unlike SA. This feature may result in subjects not thinking and acting very carefully
as players 1, 2, and 3 in the proposal-input table, it was observed that most of the winning coalitions were either (1,2) or (2,3), although (1,2) and (1,3) are essentially the same. They showed that randomizing the order of players’ appearance in the proposal-input table excludes such a puzzling observation.
Figure 2: Screen of player 2, who is not currently proposing; players 1 and 4 in the same group have made proposals. His or her proposal-approval tables are on the right-hand side. At this point, there is no difference between the screens under MA and under SA.
when they make their decisions. We thus conduct experiments in order to investigate how this dif-ference between MA and SA influences the experimental results. In experiments, RR may also affect subjects’ thinking and actions; thus, in this paper, we examine four experimental protocols, which are summarized in Table 1. Both Montero et al. (2008) and Aleskerov et al. (2009) adopted RR-MA. Esposito et al. (2011), on the other hand, adopted SFR-SA.
In all these experimental protocols we examine, there is a common time limit for subjects to reach an agreement for each round. The limit is set randomly between 300 and 420 seconds.9 If none of the proposals made in a group receives at least as many votes as the quota within the time limit, every member of the group receives zero points. Subjects are informed that they will be paid according to the total points they gain in 6 rounds (3 from the first 10 rounds and 3 from the subsequent 10 rounds) randomly selected by a computer at the end of each experiment, with the pre-determined exchange rate in addition to the show-up fee. The exchange rate was 1 point = 0.13 EUR in Montpellier and it was 1 point = 14 JPY in Tsukuba. The show-up fee was 5 EUR in Montpellier and it was 1500 JPY in Tsukuba. The instructions for each protocol is attached in
9
Montero et al. (2008) set the random time limit to be between 300 and 600 seconds, and reported that there was no group that could not reach an agreement before 300 seconds. Aleskerov et al. (2009) set a fixed time limit of 300 seconds, and reported that there were several groups that failed to reach an agreement before the time limit, but that they observed almost the same observations except on this point as those in Montero et al. (2008).
Under MA
Under SA
Figure 3: Screen shots for MA (top) and SA (bottom), following Figure 2 after player 2 has proposed and no one else has taken an action yet.
Table 1: The four examined protocols.
Random Role Semi-Fixed Role
Multiple Approval RR-MA SFR-MA
Single Approval RR-SA SFR-SA
Note: Montero et al. (2008) and Aleskerov et al. (2009) adopted RR-MA, and Esposito et al. (2011) adopted SFR-SA.
Appendix C.10
Finally, note again that there is no veto player in either of the games we are using. In games with veto players, such players can extract all points by using their veto power in the “core” allocations. In Montero et al. (2008), Aleskerov et al. (2009), and Esposito et al. (2011), it has been actually observed that, as rounds proceeded, the allocations converged to the ones where veto players obtain almost all points.
3
Results
We conducted computerized experiments in the laboratories at the University of Montpellier (France) in January 2011 and at the University of Tsukuba (Japan) in February 2011. In both laboratories, for each of the four protocols, 16 subjects participated in each of our experiments (128 subjects in total). Of the subjects, 41% were female students, and 78% were economics or business students. Each experiment lasted about 90 minutes including the time for instructions. We used “z-tree” (Fis-chbacher, 2007) as the software. We first present the results concerning the observed frequencies of winning coalitions, which are followed by the discussions on mistakes subjects made and possible causes of their confusion in order to understand the differences in observations across protocols.
3.1 Winning coalitions
In both games (a) and (b), a total of 22 votes are distributed among four players, the quota is 14, and there are three possible MWCs. Instead of using player IDs, we hereafter describe MWCs in terms of the number of votes the players have. The MWCs are then (4, 4, 6), (4, 4, 8), and (6, 8) in game (a), while (7, 7) and two (7, 3, 5)s in game (b). Note that the two players with 4 votes each in game (a) and those with 3 or 5 votes in game (b) need to act together in order to be a part of a MWC. We thus assume that they do so. In our earlier experiment (Esposito et al., 2011), the
10
The instructions, as well as the screens, were translated into Japanese for experiments in Tsukuba and into French for those in Montpellier.
observed frequencies of various MWCs can be explained nicely by the following hypothesis. Hypothesis: Each player prefers a MWC to another MWC when his or her relative weight in the
MWC is larger than that in the other MWC. In the case of a tie, he or she gives priority to the MWC with fewer players. When there exists no veto player in a game, the probability of each MWC occurring in the game depends on the score in a social ordering determined by the Borda count, given the individual preferences of players over MWCs.
Suppose that there are n voters and m alternatives. For each voter, give m− j points to the alternative in the j-th best position in his or her preference ranking. The Borda count generates a social ordering in scores in such a way that alternative x ranks above alternative y if and only if x’s total score added over all n voters is greater than y’s score. Under the above hypothesis, in game (a), for example, the player with 6 votes prefers (6, 8) to (4, 4, 6), and (4, 4, 6) to (4, 4, 8). The two players with 4 votes each prefer (4, 4, 6) to (4, 4, 8), and (4, 4, 8) to (6, 8). The player with 8 votes prefers (6, 8) to (4, 4, 8), and (4, 4, 8) to (4, 4, 6). Treating the two players with 4 votes as one, the Borda scores for (6, 8), (4, 4, 6), and (4, 4, 8) are 4, 3, and 2, respectively. We should then expect to observe (6, 8) more frequently than (4, 4, 6), and (4, 4, 6) more frequently than (4, 4, 8). Similarly, in game (b), we should expect (7, 7) to be observed more frequently than each of the two (7, 3, 5)s. Table 2 shows the aggregate frequencies of winning coalitions observed in the four protocols. The outcomes observed in game (a) are shown in the top four panels, while those in game (b) are shown in the bottom four panels. For each game, 10 rounds are divided into two blocks of 5 rounds. From the table, we can observe that subjects tend to form MWCs, especially in later rounds.11 In addition, observed frequencies of the MWCs of three players are less than those of the MWCs of two players for all protocols. These results can be summarized as the following two observations. Observation 1. Subjects form MWCs with increasing frequency as they repeatedly play a weighted
voting game.
Observation 2. MWCs of two players are formed more frequently than MWCs of three players. In Table 2, we can also observe that (6, 8) occurred more frequently than (4, 4, 6) and (4, 4, 6) more frequently than (4, 4, 8) in game (a), and that (7, 7) occurred more frequently than either of the two (7, 3, 5)s in game (b), which are consistent with what we expect from our hypothesis. For the last five rounds of each game, however, Table 2 also shows that in game (a), the difference in number of observations between (6, 8) and (4, 4, 6) is remarkably large except under SFR-SA, and
11
This is not the case for SFR-MA and SFR-SA in game (b), where the increase of non-MWCs in periods 16–20 are driven by the results in Montpellier. See Figure 5 for more details.
Table 2: Aggregate frequencies of winning coalitions observed for the four protocols. Game (a): [14; 4, 4, 6, 8] RR-MA SFR-MA Round 1-5 Round 6-10 (6,8) 14 22 (4,4,6) 1 2 (4,4,8) 1 0 Others 24 16 Round 1-5 Round 6-10 (6,8) 22 25 (4,4,6) 3 5 (4,4,8) 1 2 Others 14 8 RR-SA SFR-SA Round 1-5 Round 6-10 (6,8) 17 20 (4,4,6) 3 6 (4,4,8) 0 2 Others 20 12 Round 1-5 Round 6-10 (6,8) 24 17 (4,4,6) 2 11 (4,4,8) 2 4 Others 12 8 Game (b): [14; 7, 7, 3, 5] RR-MA SFR-MA Round 11-15 Round 16-20 (71,72) 25 33 (71,3,5) 1 0 (72,3,5) 2 3 Others 12 4 Round 11-15 Round 16-20 (71,72) 20 20 (71,3,5) 3 4 (72,3,5) 6 4 Others 11 12 RR-SA SFR-SA Round 11-15 Round 16-20 (71,72) 26 21 (71,3,5) 4 7 (72,3,5) 2 8 Others 8 4 Round 11-15 Round 16-20 (71,72) 26 16 (71,3,5) 6 9 (72,3,5) 8 10 Others 0 5
Note: In game (a), (6, 8) forms more frequently than (4, 4, 6), and (4, 4, 6) forms more frequently than (4, 4, 8). In game (b), (7, 7) occurred more frequently than either of the two (7, 3, 5)s. Under RR-MA in each game, however, the formation of MWCs is extremely biased toward the one includ-ing the player with the highest number of votes, which was observed also in Montero et al. (2008) and Aleskerov et al. (2009). The scores for these MWCs based on the Borda count do not suggest as large a difference as the observed frequencies of MWCs
that in game (b), the difference in number of observations between (7, 7) and (7, 3, 5)s is extremely large under RR-MA. For any game, however, the difference should not be so large according to our hypothesis, because the scores of MWCs based on the Borda count are not different to that extent. There might be a period during which subjects are learning how to play the game, but such a period is likely to consist of early rounds of the game. We thus look into the distribution of allocations realized in the last five rounds of each game to further investigate the differences of outcomes observed under the four protocols.
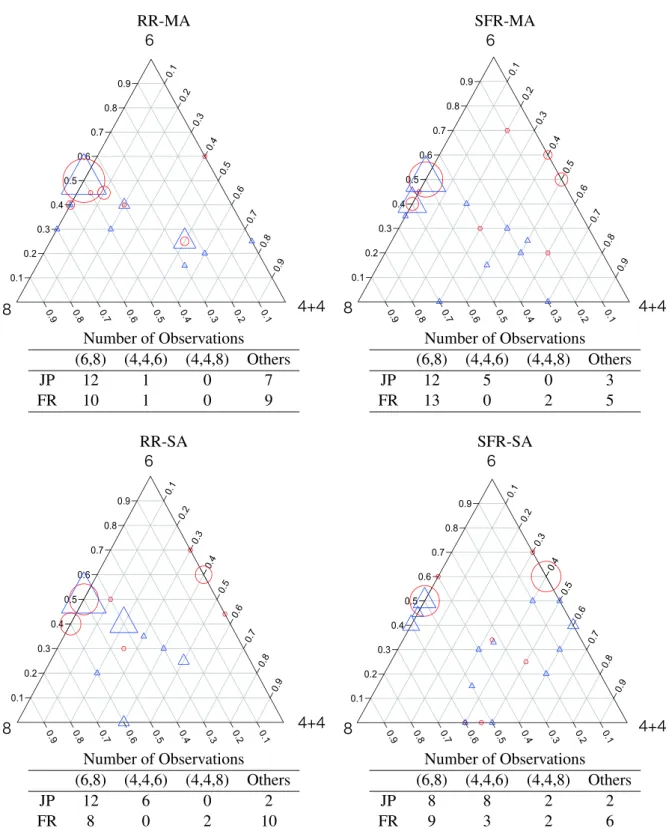
Figures 4 and 5 illustrate, in simplices, the allocations realized in the last five rounds of games (a) and (b) for the four protocols.12First, consider the case shown in Figure 4. In game (a), (4, 4, 6) is not observed at all under SFR-MA and RR-SA in Montpellier, and there is only one observation of (4, 4, 6) under RR-MA, both in Tsukuba and in Montpellier. These results are far from what we expect from the scores of MWCs based on the Borda count. Under SFR-SA, on the other hand, not only are the observed frequencies of MWCs consistent with our hypothesis, but also the realized allocations indicate a plausible tension between (6, 8) and (4, 4, 6). Consider the realized allocations shown as red circles under SFR-SA. On the 6-8 edge, the realized allocations are concentrated at the middle, which indicates that the two players in (6, 8) equally shared the 100 points. On the 6-(4+4) edge, the realized allocations are located more toward Apex 6 than toward Apex 4+4. This implies that, in (4, 4, 6), the player with 6 votes gained more than 50 points. These results together suggest that two players with 4 votes each are trying to form (4, 4, 6) by offering to the player with 6 votes more than what he or she can expect to gain by forming (6, 8), i.e., more than 50 points. Similar inferences can be made under RR-SA and SFR-MA from the outcomes observed in Tsukuba.
Next, consider game (b) shown in Figure 5. As in the case of game (a), some tension among MWCs is observed, in particular, (7, 7) versus (7, 3, 5)s under SFR-SA, both for outcomes observed in Tsukuba and those in Montpellier. A similar tension among MWCs is also observed under RR-SA in Tsukuba. Under RR-MA or SFR-MA, however, we do not observe such a tension because the majority of observations are either (7, 7) or “Others” (non-MWCs). Therefore, we can conclude as follows.
Observation 3. Our hypothesis was valid only under SFR-SA.
As noted above, our hypothesis was intended to explain the frequencies of MWCs observed un-der SFR-SA in our earlier experiment (Esposito et al., 2011). Observations 1 and 2 can be confirmed also in Montero et al. (2008), Aleskerov et al. (2009), and Esposito et al. (2011). Under RR-MA
12
In these figures, a point in a simplex shows how the 100 points are allocated among subjects. As an example, consider the simplex in Figure 4. The height of a point from the edge that is opposite from the apex labeled 4+4 represents the total points allocated for the two players with 4 votes each. Thus, a point on the 6-8 edge represents a realized allocation that gave 0 points to both of these players, i.e., (6, 8) being formed.
RR-MA SFR-MA 8 6 4+4 8 6 4+4 Number of Observations (6,8) (4,4,6) (4,4,8) Others JP 12 1 0 7 FR 10 1 0 9 Number of Observations (6,8) (4,4,6) (4,4,8) Others JP 12 5 0 3 FR 13 0 2 5 RR-SA SFR-SA 8 6 4+4 8 6 4+4 Number of Observations (6,8) (4,4,6) (4,4,8) Others JP 12 6 0 2 FR 8 0 2 10 Number of Observations (6,8) (4,4,6) (4,4,8) Others JP 8 8 2 2 FR 9 3 2 6
Figure 4: Distribution of allocations realized in Rounds 6–10 for game (a) under the four protocols. Red circles (blue triangles) in simplices indicate the outcomes in Tsukuba, Japan (Montpellier, France). The size of a circle or triangle is proportional to the number of observations falling at its center. The tables below the simplices list the frequencies of winning coalitions, separately, for Tsukuba (JP) and Montpellier (FR).
RR-MA SFR-MA 72 71 3+5 72 71 3+5 Number of Observations (71,72) (71,3,5) (72,3,5) Others JP 16 0 2 2 FR 17 0 1 2 Number of Observations (71,72) (71,3,5) (72,3,5) Others JP 15 1 1 3 FR 5 3 3 9 RR-SA SFR-SA 72 71 3+5 72 71 3+5 Number of Observations (71,72) (71,3,5) (72,3,5) Others JP 8 5 6 1 FR 13 2 2 3 Number of Observations (71,72) (71,3,5) (72,3,5) Others JP 8 6 6 0 FR 8 3 4 5
Figure 5: Distribution of allocations realized in Rounds 16–20 for game (b) under the four protocols. Red circles (blue triangles) in simplices indicate the outcomes in Tsukuba, Japan (Montpellier, France). The size of a circle or triangle is proportional to the number of observations falling at the center. The tables below the simplices list the frequencies of winning coalitions, separately, for Tsukuba (JP) and Montpellier (FR).
in game (a), moreover, the formation of MWCs is remarkably biased toward the one including the player with the highest number of votes, whereas it is rare to observe a MWC that does not include such a player (see Figure 4). A similar observation can be made for the game [5; 3, 2, 2, 1] in Mon-tero et al. (2008) and Aleskerov et al. (2009).13 All these facts jointly imply the robustness of our results under RR-MA.
Why, then, does SFR-SA favor our hypothesis while others do not? One of the possible reasons is simply due to the number of “clicks” required for a proposal to be implemented. MA favors MWCs involving fewer members because the first proposal that obtains at least as many votes as the quota is implemented, although subjects can click many “approve” buttons under MA. This effect is a real problem if subjects fail to think carefully and merely click whatever proposals are shown in their proposal-approval tables. The lack of “tensions” among MWCs in the outcomes observed under RR-MA and SFR-MA suggests that this is indeed a cause. In fact, several subjects in Tsukuba noted informally after the experiments under MA, “The negotiation process was too fast to carefully compare several proposals shown on the screen.”
If the number of “clicks” matters under MA, another question arises: why do the outcomes observed under RR-SA not support our hypothesis as clearly as those under SFR-SA? A possible reason is that when subjects’ roles are changed randomly, the subjects without many votes do not think hard enough about how to obtain a higher payoff. Another possible reason is that subjects make more mistakes in entering their proposals in the proposal-input tables under RR than under SFR, partly because the order in which players are shown the screen changes in every period. (See, footnote 8.) We now turn to addressing these possibilities by analyzing the data across the four protocols.
3.2 Mistakes and possible points of confusion
In Subsection 3.1, we pointed out that there is a problem in using MA when analyzing what kinds of coalitions are likely to be formed due to the potential for subject mistakes or carelessness in choos-ing. Table 3 shows an example of mistakes leading to a MWC of two players, with a negotiation dynamic realized under RR-MA in game (b). The implemented allocation was (50, 50, 0, 0); thus the winning coalition in this group consisted of players 1 and 2 (with 7 votes each) who shared the 100 points equally. What is rather strange in this realization, however, is the behavior of player 1. At 20.2 seconds, player 2 proposed an allocation (50, 50, 0, 0). At 21.6 seconds, player 4 proposed another allocation (60, 0, 20, 20), which was more favorable for player 1 than the proposal that
13For example, Montero et al. (2008) found that, in the later rounds, in 58 out of 64 observations, the winning coalitions
were those consisting of player 1 (with 3 votes) and player 2 or 3 (both with 2 votes). The coalition involving players 2, 3, and 4 (with 2 votes, 2 votes, and 1 vote, respectively) were observed only once out of 64 observations.
Table 3: Negotiation dynamic realized within a round (Round 18) under RR-MA taken from game (b) in Tsukuba.
players’ IDs elapsed points for points for points for points for
of proposer time player 1 player 2 player 3 player 4
+approver(s) in second (7 votes) (7 votes) (3 votes) (5 votes)
2 20.2 50 50 0 0
4 21.6 60 0 20 20
3 29.7 60 0 20 20
2+1 29.8 50 50 0 0
Note: Some “strange” behaviors (mistakes) of subjects are observed.
had been made by player 2. Of these two proposals, however, player 1 approved the former at 29.8 seconds, which gave him 10 points less than the latter.14
We found many kinds of “strange” behaviors as well as the one described above.15 To quantify how often we observe strange behaviors, we define an action (i.e., proposal or approval) to be an error if one of the following four criteria is satisfied: (1) proposing or approving an allocation that gives zero points to the proposer or approver, (2) proposing or approving an allocation consisting of a coalition that cannot win unless others make errors that satisfy criterion (1), (3) proposing or approving an allocation that gives lower points to the proposer or approver than some existing proposal (i.e., a proposal that has not been withdrawn), and (4) proposing an allocation that gives lower points to a player belonging to the proposed coalition than some existing proposal. Criteria (3) and (4) are applied only to such actions that are not classified as errors according to criteria (1) or (2).
The idea behind criterion (1) is obvious. If, in game (b), player 4 proposes the allocation (0,0,50,50), such a proposal is then naturally regarded as an error because this proposal will never be implemented unless player 1 or 2 commits an error that satisfies criterion (1). Thus, we have criterion (2). The approval made by player 1 shown in Table 3 is an example of an error that satisfies criterion (3), where player 1 approved the proposal of the allocation (50,50,0,0) although (60,0,20,20) existed. Also for the example shown in Table 3, if player 3 proposed the allocation (40,0,30,30) instead of proposing (60,0,20,20), then such a proposal would be considered an error
14
At 29.7 seconds, player 3 proposed the same allocation as the one proposed by player 4 at 21.6 seconds, somehow not pressing the “approve” button. Player 3 might have been busy entering his or her own proposal and so did not take a careful look at player 4’s proposal. (The time difference between the two proposals, however, is rather long for this interpretation.)
15
For example, look at the simplex for SFR-MA in Figure 5. We can see a blue triangle on the top of Apex 3+5. This point corresponds to the allocation that gives zero points to players with 7 votes while the two players with 3 or 5 points are dividing the 100 points between themselves. This strange outcome is possible either because players with 7 votes made a mistake or because they considered something other than their own payoffs while playing the game.
0 0.2 0.4 0.6 0.8 1 0 0.1 0.2 0.3 0.4 0.5 0.6 0.7 0.8 0.9 1 NE empirical CDF MA vs SA comparison rr_ma + sfr_ma rr_sa + sfr_sa 0 0.2 0.4 0.6 0.8 1 0 0.1 0.2 0.3 0.4 0.5 0.6 0.7 0.8 0.9 1 NE empirical CDF RR vs SFR comparison rr_ma + rr_sa sfr_ma + sfr_sa
Figure 6: Empirical cumulative distribution functions (CDFs) of the normalized number of errors (NE) that satisfy criteria (1) or (2) only. MA vs SA (left) and RR vs SFR (right). The data are taken from Rounds 6―10 (game (a)) and Rounds 16–20 (game (b)). In both cases of comparison, there in no statistically significant difference between the CDFs.
because it gives a lower payoff to player 1 than existing proposals. Thus, we have criterion (4). Criteria (1) and (2) capture errors that come from subjects failing to recognize their roles as shown on their screens (i.e., the potential problem of RR relative to SFR) and making or approving proposals that do not make sense. Criteria (3) and (4), on the other hand, capture the failures of subjects to pay careful attention to existing proposals. The total number of actions varies across rounds and groups. We thus divide the number of errors in each negotiation by the total number of actions observed in the negotiation, and call such a percentile the normalized number of errors (NE).
We first consider the potential problem of RR relative to SFR. Figure 6 shows the empirical cumulative distribution functions (CDFs) of NE that satisfy criterion (1) or (2) only. In the left panel of the figure, CDFs under MA (solid) and SA (dashed) are depicted, while in the right panel, CDFs under RR (solid) and SFR (dashed) are plotted. In generating CDFs under MA, for example, we pooled the data observed under SFR-MA and RR-MA. A similar pooling of data is performed for all the other cases. We present in Figure 6 the results taken from Rounds 6–10 and Rounds 16–20 because subjects may make more errors in the earlier rounds of a given game.
In the right panel of Figure 6 (RR vs SFR), the CDF of NE made under SFR lies to the left of the CDF of NE made under RR, which might imply that RR can indeed result in subjects making more mistakes in entering their proposals than SFR. The difference, however, is not statistically
0 0.2 0.4 0.6 0.8 1 0 0.1 0.2 0.3 0.4 0.5 0.6 0.7 0.8 0.9 1 NE empirical CDF MA vs SA comparison rr_ma + sfr_ma rr_sa + sfr_sa 0 0.2 0.4 0.6 0.8 1 0 0.1 0.2 0.3 0.4 0.5 0.6 0.7 0.8 0.9 1 NE empirical CDF RR vs SFR comparison rr_ma + rr_sa sfr_ma + sfr_sa
Figure 7: Empirical cumulative distribution functions (CDFs) of the normalized number of errors (NE) that satisfy any of criteria (1)–(4). MA vs SA (left) and RR vs SFR (right). Criteria (3) and (4) are applied only to errors made within T = 3 seconds after the relevant proposals have been made public. The data are taken from Rounds 6–10 (game (a)) and Rounds 16–20 (game (b)). In the comparison of MA to SA, there is a statistically significant difference between the CDFs.
significant (p-value = 0.196 in Wilcoxon rank sum test). The left panel of the figure (MA vs SA) shows that there is no clear difference between MA and SA (the difference is not statistically significant: p-value = 0.276 in Wilcoxon rank sum test).
We next consider the errors that satisfy any of criteria (1)–(4). It is possible that subjects do not see the relevant proposals that exist prior to taking their own actions, especially when the actions in question take place immediately after the relevant proposals are made public. To allow for such a time lag, we apply criteria (3) and (4) only to these types of errors, made within T seconds after the relevant proposals have been made public. Figure 7 presents the empirical CDFs of NE that satisfy any criteria within T = 3. These CDFs are generated in the same manner as those in Figure 6.
In the left panel of Figure 7 (MA vs SA), the CDF of NE made under SA lies to the left of the CDF of NE made under MA. One can thus easily see that subjects tend to commit less errors under SA than under MA. The difference is statistically significant (p-value = 0.01 in Wilcoxon rank sum test). On the other hand, such differences cannot be observed between RR and SFR, shown in the right panel of the figure (p-value = 0.66 in Wilcoxon rank sum test). These results are robust for all values of T tested, T ∈ {1, 2, 3, 4, 5}. (See Appendix A.) These differences are primarily due to subjects failing to carefully examine existing proposals, in light of the results reported above that concern criteria (1) and (2) only. Criterion (4) can be seen as too strong, as it
0 0.5 1 1.5 2 2.5 0 0.1 0.2 0.3 0.4 0.5 0.6 0.7 0.8 0.9 1 IA empirical CDF MA vs SA comparison rr_ma + sfr_ma rr_sa + sfr_sa 0 0.5 1 1.5 2 2.5 0 0.1 0.2 0.3 0.4 0.5 0.6 0.7 0.8 0.9 1 IA empirical CDF RR vs SFR comparison rr_ma + rr_sa sfr_ma + sfr_sa
Figure 8: Empirical cumulative distribution functions of the intensity of activities (IA). MA vs SA (left) and RR vs SFR (right). The data are taken from Rounds 6―10 (game (a)) and Rounds 16–20 (game (b)). There are significantly more actions per second under MA than under SA. No clear difference between RR and SFR can be found.
requires subjects always to propose an allocation that is Pareto improving for all members of the proposed coalition. Dropping criterion (4) and considering only errors satisfying one of criteria (1), (2), and (3), however, does not change our results. (See Appendix B.) Thus, we state the following observation.
Observation 4. MA results in subjects making more mistakes than SA. RR does not result in subjects
making more mistakes than SFR.
3.3 Intensity of activities
Why, then, do subjects tend to make more mistakes under MA than under SA? As quoted above, some subjects, those who participated in the experiment under MA, expressed their feelings that the negotiation process was too fast to carefully compare several proposals, i.e., there was simply too much going on. To quantify the speed of the negotiations, we define the intensity of activities (IA) in a negotiation as the average number of actions per second. Here, as above, an action is either a proposal or an approval. We consider the duration of a negotiation to be between the time at which the first proposal in a group is made public and the end of the round for the group (either by a proposal obtaining at least as many as the quota or by the random termination).
the left panel of the figure, there are significantly more actions per second under MA than under SA. The difference is statistically significant (p-value < 0.01 in Wilcoxon rank sum test). This fact confirms the remark made by subjects we quoted above.
Observation 5. Subjects take significantly more actions per second under MA than under SA. We obtain the quantitative result stated as Observation 5 even if we consider the duration of a negotiation to be between the start of the round and the end of the round.16Observation 5 provides a plausible reason for the statement in Observation 4. In the right panel of Figure 8 (RR vs SFR), there is no clear difference between RR and SFR (the difference is not statistically significant: p-value = 0.18 in Wilcoxon rank sum test).17
4
Conclusion
The recent experimental analyses on weighted voting games in a cooperative game environment made by Montero et al. (2008) and Aleskerov et al. (2009) show that subjects eventually learn to form MWCs. Such an observation leads to the following question: is there any regularity regarding the observed frequencies of various MWCs? This question is of interest in the theory of power in-dices. A power index called the DP index (Deegan and Packel, 1978; Packel and Deegan, 1980), for example, is based on the probability of each MWC occurring as well as allocations within MWCs. The DP index, however, is silent as to what are the plausible frequency distributions for various MWCs. Our ultimate aim is, therefore, to provide enough experimental results, while remaining within the cooperative game environment as much as possible, in order to shed a light on this open question and to contribute to future theoretical developments.
As a step toward such a goal, we conducted a sensitivity analysis of the observed frequencies of MWCs by varying the two features of the experimental protocol adopted in Montero et al. (2008): the random reassignment of subjects’ roles and multiple approval. Namely, we considered the role assignments, RR versus SFR, as well as the approval schemes, MA versus SA. Our main finding is that only under SFR-SA, observed frequencies of MWCs are consistent with our hypothesis: each subject prefers a MWC to another MWC when his or her relative weight in the MWC is larger than the one in the other MWC, and the probability of each MWC occurring depends on a score in the social ordering determined by the Borda count, when there is no veto player. Under RR-MA, however, the formation of MWCs is extremely biased toward the one including the player with the highest number of votes, which was observed also in Montero et al. (2008) and Aleskerov et al.
16
MA versus SA: p-value < 0.01 in Wilcoxon rank sum test.
17
If we consider the duration of a negotiation to be between the start of the round and the end of the round, p-value = 0.08 in Wilcoxon rank sum test.
(2009). The scores of these MWCs based on the Borda count do not suggest as large a difference as the observed frequencies of MWCs.
Further data analyses reveal that the difference observed in these experimental results is due to mistakes by subjects under MA, which was also verified by our observation that subjects take significantly more actions per second under MA than under SA. Indeed, some subjects, those who participated in the experiment under MA, noted that the negotiation process was too fast to care-fully compare several proposals, i.e., there was simply too much going on. In future research, we need to accumulate sufficient data regarding the observed frequencies of various MWCs for vari-ous weighted voting games. The results of our analyses thus far suggest that the SA protocol is preferable to the MA protocol for this purpose in that it results in subjects making fewer mistakes.
Finally, we briefly refer to the main finding in Montero et al. (2008) and Aleskerov et al. (2009). The main purpose of their research was to examine whether the paradox of new members is con-firmed also in the laboratory. The enlargement of a voting body (the number of voters) may affect the balance of power between originally existing members, and some voters may actually gain, even if the numbers of votes they have and the decision rule remains unchanged. This phenomenon is called the paradox of new members and is well known in political science. Montero et al. (2008) and Aleskerov et al. (2009) defined the power of a voter as the average earnings of subjects who play the games with the same player ID in their experiments. Thus, the observed frequencies of various MWCs did not affect their main finding that the paradox was confirmed, although the actual formation of MWCs is extremely biased toward the one including the player with the highest num-ber of votes. In light of the additional confirmation of the paradox of new memnum-bers by Drouvelis et al. (2010) in a non-cooperative game environment in which subjects consider one proposal at a time, we think the paradox will also be confirmed under SFR-SA. It will be of interest, however, to re-examine the game [5; 3,2,2,1] under SFR-SA to put our hypothesis regarding the likelihood of MWCs to further test.
References
ALESKEROV, F., A. BELIANI,ANDK. POGORELSKIY(2009): ”Power and preferences: an
exper-imental approach,” mimeo. Higher School of Economics, Russia.
BANZHAF, J. F. (1965): ”Weighted voting doesn’t work: a mathematical analysis,” Rutgers Law
Review, 19, 317–343.
BARON, D. P., AND J. A. FEREJOHN (1989): ”Bargaining in legislatures,” American Political Science Review, 83, 1181–1206.
CHOU, E., M. MCCONNELL, R. NAGEL, AND C. R. PLOTT(2009): ”The control of game form recognition in experiments: understanding dominant strategy failures in a simple two person ”guessing” game,” Experimental Economics, 12, 1386–4157.
DEEGAN, J., AND E. PACKEL(1978): ”A new index of power for simple n-person games,”
Inter-national Journal of Game Theory, 7, 113–123.
DROUVELIS, M., M. MONTERO,ANDM. SEFTON(2010): ”The paradox of new members:
strate-gic foundations and experimental evidence,” Games and Economic Behavior, 69, 274–292.
ESPOSITO, G., E. GUERCI, X. LU, N. HANAKI, AND N. WATANABE(2011): ”An experimental
study on learning and generalization in weighted majority voting games,” mimeo, GREQAM, France, (University of Tsukuba, Japan).
FELSENTHAL, D.S., MACHOVER, M., (1998): The Measurement of Voting Power: Theory and
Practice, Problems and Paradoxes. Edward Elgar, London
FISCHBACHER, U. (2007): ”z-Tree: Zurich toolbox for ready-made economic experiments,”
Ex-perimental Economics, 10(2), 171–178.
FRECHETTE´ , G. R., J. H. KAGEL, AND M. MORELLI (2005a): ”Gamson’s law versus
non-cooperative bargaining theory,” Games and Economic Behavior, 51, 365–390.
(2005b): ”Nominal bargaining power, selection protocol, and discounting in legislative bargaining,” Journal of Public Economics, 89, 1497–1517.
KAGEL, J. H., H. SUNG, AND E. WINTER (2010): ”Veto power in committees: an experimental study,” Experimental Economics, 13, 167–188.
MONTERO, M., M. SEFTON,AND P. ZHANG(2008): ”Enlargement and the balance of power: an
experimental study,” Social Choice and Welfare, 30(1), 69–87.
MORELLI, M. (1999): “Demand competition and policy compromise in legislative bargaining,”
American Political Science Review, 93, 809–820.
PACKEL, E. W., AND J. DEEGAN (1980): ”An axiomated family of power indices for simple
n-person games,” Public Choice, 35, 229–239.
RIKER, W. H. (1962): The Theory of Political Coalitions. Yale University Press, New Haven.
SHAPLEY, L. S.,ANDM. SHUBIK(1954): ”A method for evaluating the distribution of power in a
Appendix A: Robustness with respect to T
In the main body of this paper, we showed the analysis of errors by defining the time lag between two actions to be 3 seconds (T = 3). Here, we present the result of a Wilcoxon rank sum test for other values of T . As one can see from Table 4, the results stated in the body are robust with respect to the values of T that we have considered.
Table 4: P-values of Wilcoxon rank sum tests comparing the distributions of normalized number of errors for five values of T used in defining errors.
T=1 T=2 T=3 T=4 T=5
SFR vs RR 0.360 0.366 0.660 0.807 0.815
SA vs MA 0.000 0.001 0.012 0.019 0.056
0 0.2 0.4 0.6 0.8 1 0 0.1 0.2 0.3 0.4 0.5 0.6 0.7 0.8 0.9 1 NE empirical CDF MA vs SA comparison rr_ma + sfr_ma rr_sa + sfr_sa 0 0.2 0.4 0.6 0.8 1 0 0.1 0.2 0.3 0.4 0.5 0.6 0.7 0.8 0.9 1 NE empirical CDF RR vs SFR comparison rr_ma + rr_sa sfr_ma + sfr_sa
Figure 9: Empirical cumulative distribution functions of the number of errors defined based on criteria (1), (2), and (3) only. MA vs SA (left) and RR vs SFR (right). The data are taken from Rounds 6–10 (game (a)) and Rounds 16―20 (game (b)). Subjects make significantly more errors under MA than under SA. No clear difference between RR and SFR can be found.
Appendix B: Alternative definition of error
In the main body of this paper, we showed an analysis of errors that satisfy only criterion (1) or (2) as well as that considering all four criteria. In this appendix, we present an analysis based on errors defined by criteria (1), (2), and (3), excluding (4). As noted, the results are basically the same as the one presented in the main body.
Figure 9 presents the empirical CDFs of NE. In the left panel of the figure, CDFs of MA (solid) and SA (dashed) are compared, while in the right panel, we compare those of RR (dashed) and SFR (dashed). These results are robust for all the values of T we have considered, as shown in Table 5. Table 5: P-values of Wilcoxon rank sum tests comparing the distributions of normalized number of errors for five values of T used in defining errors.
T=1 T=2 T=3 T=4 T=5
SFR vs RR 0.739 0.964 0.887 0.813 0.993
SA vs MA 0.000 0.000 0.000 0.001 0.004
Appendix C: Instructions
The instructions for the four protocols are the same for the most part. Thus, in this appendix, we show generic instructions while noting the parts that differ between the protocols. Of course, the subjects in one protocol are only instructed about the relevant protocol. These instructions were then translated into Japanese and French for our experiments in Tsukuba and Montpellier. Instructions in Japanese as well as those in French are available upon request.
INSTRUCTIONS OF THE EXPERIMENT
Welcome! Thank you very much for taking part in our laboratory experiment.
You are a participant in an experiment on group decision making. During the experiment, you, as well as other participants in this room, will be making decisions. The experiment will take about two hours.
RECOMMENDATION
We ask you to comply with these rules and respect the instructions of the experimenter. Any communication with other participants is strictly prohibited. During the experiment, you must not talk, exchange notes, watch other participants’ actions, or use mobile phones. It is important that during the experiment you remain SILENT. If you have any questions, or need assistance of any kind, RAISE YOUR HAND but DO NOT SPEAK. We expect and appreciate your cooperation. PROTOCOL
There are 20 rounds in this experiment. In each round, you and three other randomly chosen participants will form a group of four people and the four players decide how to divide 100 points in the manner described later.
Matching
===== ONLY FOR THE SFR ==========
At the beginning of the experiment, the computer will randomly divide you into two types, A and B. If you are type A, your player ID will ALWAYS be either 1 or 2. If you are type B, your player ID will ALWAYS be either 3 or 4. Each round your player ID will be randomized BETWEEN THE TWO, WHILE YOUR TYPE REMAINS THE SAME THROUGHOUT THE EXPERIMENT. At the beginning of each round, the computer will randomly group four participants, two from A and two from B, into one group. You will not be able to know which participants are in the same group.
You will repeat the same procedure for 20 rounds, but your ID number may change from round to round, the other people in your group also change. In each round, you will be clearly informed of your player ID for that round.
===== ONLY FOR THE RR ============
At the beginning of each round, the computer will randomly group four participants into one group. You will not be able to know which participants are in the same group. You will repeat the same procedure for 20 rounds, but your ID number, either 1, 2, 3 or 4, may change from round to round, and the other people in your group also change. In each round, you will be clearly informed of your player ID for that round.
========================================= The negotiation
You will be making a decision in a group with three other people, on how to divide 100 points among the four of you.
You will not know who the people in your groups are, and the people in your group will change randomly every round.
Each player has a certain number of votes and the information will be shown in the table on the left side of the screen. In the first 10 rounds, the same votes allocation will be used, and another votes allocation will be used from Round 11 to the end.
Any member of the group at any moment during the negotiation may make a public proposal about how to divide 100 points. To make a proposal, you need to enter 4 numbers in the respective boxes on the left hand side of the screen and press the “propose” button shown in red.
Any member of a group can also vote for already submitted proposals. Proposals made by others are shown on the right side of screens. You can vote for a proposal by pressing an “approve” button shown in red.
============ ONLY FOR MA =============
You can use your votes to support more than one proposal. Each proposal you support will receive all your votes. For each proposal, who are supporting it will be shown clearly.
To submit a new proposal, you need to withdraw your current proposal. You can withdraw your proposal by pressing the “withdraw” button on the left side of your screen anytime during the negotiation. All the members in your group will be informed about the withdrawal of your proposal.
You can also withdraw your vote for another’s proposal by pressing the “withdraw” button shown on the right side of the screen anytime during the negotiation.
============ ONLY FOR SA =============
Please remember, you can only be in favor of at most one proposal, including your submitted proposal, at any given time. You cannot divide your votes up and support multiple proposals. All your votes will be cast in the proposal that you decide to support. For each proposal, who are supporting it will be shown clearly. You can change your approval whenever you want during the negotiation.
You can withdraw your proposal in order to propose a new one or to vote for another’s proposal by pressing the “withdraw” button on the left side of your screen. All the members in your group will be informed about the withdrawal of your proposal.
You can also withdraw your vote for another’s proposal to propose or to vote for a different proposal by pressing the “withdraw” button shown on the right side of the screen.
=============================================
The first proposal that receives the necessary number of votes will be implemented and the negotiation ends. Each of your group members will receive the number of points specified in that proposal.
There is a time limit to the negotiation. The time limit will be between 300 and 420 seconds. In each round, before the start of negotiation, the computer will randomly set the time limit, and you will not be informed of the exact time limit. This means that the round could end suddenly at any time between 300 seconds and 420 seconds after its start. If none of the proposals has received the necessary number of votes within this time limit, then all the members of your group will receive 0 points in this round.
If you have any questions please raise your hand. PAYMENT
At the end of the experiment, the computer will randomly select 3 rounds out of the first 10 rounds and 3 rounds out of the second 10 rounds. You will be paid only according to the points you have obtained in these selected rounds, and not according to the points of the whole protocol. The total points you have earned in the selected 6 rounds will be converted to cash at the exchange rate of 1 point = 14 JPY (13 cents in Euro).
In addition to this, you will be paid 1500 JPY (5 EUR) as a show up fee. The maximum earning you can make is, therefore, 1500 + 0.14× 6 × 100 JPY = 9900 JPY (5 + 0.13 × 6 × 100 = 78 EUR). The minimum earning you can make is the show up fee of 1500 JPY (5 EUR).
PRACTICE ROUND
In order to make you familiar with the interface and mechanism of the experiment, we now do 1 practice round. What you will do in the practice will not affect your final payment. The number of votes given to the four members of your group is not related to what you will see in the real experiments to follow.


![Table 2: Aggregate frequencies of winning coalitions observed for the four protocols. Game (a): [14; 4, 4, 6, 8] RR-MA SFR-MA Round 1-5 Round 6-10 (6,8) 14 22 (4,4,6) 1 2 (4,4,8) 1 0 Others 24 16 Round 1-5 Round 6-10(6,8)2225(4,4,6)35(4,4,8)12Others148 RR-](https://thumb-eu.123doks.com/thumbv2/123doknet/13049130.382948/13.892.175.741.261.886/table-aggregate-frequencies-winning-coalitions-observed-protocols-others.webp)