HAL Id: halshs-02522874
https://halshs.archives-ouvertes.fr/halshs-02522874
Submitted on 27 Mar 2020
HAL is a multi-disciplinary open access
archive for the deposit and dissemination of
sci-entific research documents, whether they are
pub-lished or not. The documents may come from
teaching and research institutions in France or
abroad, or from public or private research centers.
L’archive ouverte pluridisciplinaire HAL, est
destinée au dépôt et à la diffusion de documents
scientifiques de niveau recherche, publiés ou non,
émanant des établissements d’enseignement et de
recherche français ou étrangers, des laboratoires
publics ou privés.
The 2016 budget 2016 : the struggle to control public
spending
Mahdi Ben Jelloul, Antoine Bozio, Sophie Cottet, Malka Guillot, Marion
Monnet, Lucile Romanello
To cite this version:
Mahdi Ben Jelloul, Antoine Bozio, Sophie Cottet, Malka Guillot, Marion Monnet, et al.. The 2016
budget 2016 : the struggle to control public spending. 2015. �halshs-02522874�
THE 2016 BUDGET : THE STRUGGLE
TO CONTROL PUBLIC SPENDING
IPP Note
n°21
November 2015
Mahdi Ben Jelloul
Antoine Bozio
Sophie Cottet
Malka Guillot
Marion Monnet
Lucile Romanello
www.ipp.eu
Summary
While the trend in public finances in France has remained
basically coherent with what was predicted over the past few
years, the focus is more and more on reducing expenditure in all
areas of public administration. Until now, reductions have mainly
targeted the expenditures of the central state while also requiring
efforts from local authorities and social security. However, in the
absence of a significant recovery, the government’s strategy of
containing expenditure will be difficult to sustain. Taxes went up
significantly in the early years of this government’s term, in
particular for the richest ten per cent. On the other hand,
simplifications of the tax and benefits system have been very
modest, and successive reforms of income tax for the first tax
bracket seem to have been motivated above all by a desire to
decrease the number of households this no longer makes sense.
Finally, in view of the challenge of controlling public spending,
better information on expenditure changes in each area of public
spending would be beneficial to democratic debate.
•
Public finances have followed the trend announced at the
beginning of this government’s term, consisting of an increase in
taxes and social security contributions followed by a decrease in
public spending.
•
The increase in taxes and social security contributions has been
effective, and has mainly affected the wealthiest households.
•
The decrease in public spending as a proportion of GDP has been
less than anticipated, delaying the balancing of public finances.
•
Governance of public finances and budget information lacks the
transparency required for democratic debate.
The Institut des politiques publiques (IPP) is developed through a scientific partnership between the Paris School of Economics and the Centre for Research in Economics and Statistics. The aim of the IPP is to promote quantitative analysis and evaluation of public policy using cutting edge research methods in
IPP Note n° 21
THE 2016 BUDGET : THE STRUGGLE TO CONTROL PUBLIC SPENDING
Compared with earlier budget plans, the 2016 French budget does not seem to have aroused much interest. This is the result of a more strongly pluri-annual approach to public finances, which reduces the role of the budget bill voted up every year and of the influence of the government’s communication strategy, as it announces most measures before the budget is officially presented. We can also question how the proposed measures barely seem to have an effect on households. However, beyond the state of our public finances, analysis of the 2016 Budget plan (PLF 2016) also reveals the range of choices yet to be made, and the crucial debate that should accompany the vote on the budget in a democracy.
In order to cover all the challenges of the 2016 Budget plan, we first review the trend in public finances since 2012, then consider the tax measures that were adopted. This Note concludes with a more general discussion about the choices that have been made to reduce public spending.
The trend in public finances
An unchanged pattern in public finances
The financial crisis, which has affected most developed countries since 2008, has been a great shock to French public finances, reducing tax revenues while expenditures continue to grow at a steady pace. More specifically, the very weak growth that followed the end of the recession has remained largely insufficient in comparison with the spontaneous change in expenses, leading to a drift in public expenditure. In this context, the choice to consolidate public finances rests on the analysis that the crisis has led to a lasting change in the growth regime.
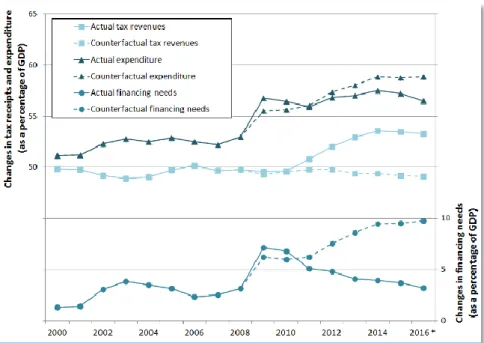
Figure 1 shows the changes in expenditure, tax revenue and
public funding needs since 2000, as well as their counterfactual
trend: the latter is what would had been observed, had the
measures adopted since the crisis not been introduced (see Box
1).
The graph throws into clear relief two distinct phases: between 2010 and 2014, the essential improvement in public finances was obtained by means of a large increase in taxes and social security contributions, with revenues rising from 49.6 per cent of GDP in 2010 to 53.6 per cent in 2014; since then, consolidation of public finances has come principally from a decrease in public expenditure as a percentage of GDP, dropping from 57.5 per cent in 2014 to 56.5 per cent in 2016. The contribution of taxation to the decrease in the public deficit was particularly strong at the beginning of the term, representing 80 per cent of the effort to reduce public deficit, compared to only 20 per cent for expenditures. The government has implemented several significant tax measures since 2012 in order to increase the public revenue. For households, these reforms principally affected income tax and social contributions. The control of public spending only became a priority at the end of the term. The contribution of budget cuts to the deficit reduction has thus significantly increased since 2015, reaching more than 36 per cent of the effort for the whole period.
These efforts, whether they consisted in tax reforms at the beginning of the presidential term or, later, in limiting expenditures, logically lead to a reduction in the public deficit over the period considered. While the public deficit should not fall below the 3 per cent level in 2016, according to the criteria defined in the Maastricht Treaty, they it should nevertheless get close to it, reaching 3.2 per cent in 2016 according to
government estimates.
The trend in public finances during Francois Hollande’s term shows a certain coherence with the strategy that he proposed to the French people during his presidential campaign: an increase in taxation, followed by a decrease in public expenditures
Figure 1: Change in expenditure, revenue and financing needs compared with their trend growth.
²
Note: Since 2009, tax revenues as a proportion of GDP clearly increased following the tax measures that were introduced, reaching up to approximately 54 per cent according to the 2016 expectations (blue curve). On the other hand, in the absence of the changes, they would have stagnated at around 50 per cent (dotted blue curve).
NB: This graph shows the change in expenditure, revenues (left vertical axis) and financing requirements (right vertical axis) as a percentage of GDP, in comparison with their trend growth, that is, in comparison with what would have happened without the policy changes.
Sources : Insee, National Accounts, Base 2010 ; Rapport Économique Social et Financier 2015 ; Rapport sur les prélèvements obligatoires 200-2013 ; Situation et perspectives des dépenses publiques (Cour des comptes, 2016).
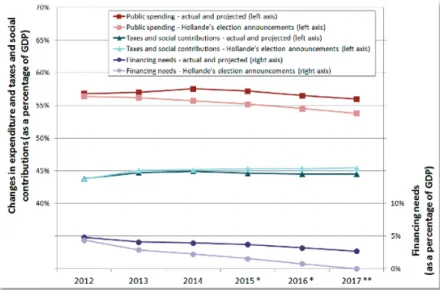
Figure 2 compares the commitments Hollande made in 2012 with public finances data, both actual and estimated, in the latest budget documents. While the increase in obligatory deductions corresponds quite closely with what was proposed, in contrast, the decrease in public spending seems to be far below what was promised. As a consequence, the public deficit is reducing much more slowly than promised.
If the actual trend in public finances is significantly off the track that was initially announced, that is because the initial
projection rested on growth predictions that have been largely contradicted by the facts. In his “60 commitments for France”, Hollande was relying on “growth hypotheses that are both conservative and realistic”: 1.7 per cent in 2013, 2 per cent in 2014 and between 2 and 2.5 per cent starting from 2015. According to this macroeconomic scenario, the decrease in public spending as a percentage of GDP could be achieved by curbing the volume of expenditure in real terms, without it being necessary to reduce their absolute value. The reality of a very weak recovery has rendered this scenario obsolete.
Figure 2 : Trend in public finances compared with François Hollande’s presidential campaign promises
Note: In 2012, France’s financing needs represented 4.8 per cent of GDP.
Note: NB: Hollande’s commitments were expressed in the terms of the national accounts operating on base 2005; the figures presented here have been converted into base 2010 on the basis of indicators provided by Insee.
Sources: “60 engagements pour la France”; Insee, Comptes Nationaux, Base 2010 ; Rapport Economique Social et Financier 2015 ; Loi de programmation des finances publiques 2014-2019. * PLF 2016 Budget (PLF) estimates (for the factual) ** Loi de programmation des finances publiques (LPFP) 2014-2019 PFP estimates (for the factual)
Are forecasts reliable?
One of the criticisms often levelled at budgetary forecasts is how easily they can be manipulated, the administration being often suspected of presenting in budget documents a projected trend that conforms more closely to government aspirations than to reality. In the past, the main complaint about budgetary predictions has been that they were based on overly-optimistic assumptions about growth, so that a “balanced” budget could be presented without announcing any measures that might be considered harsh.
To counter these practices, which are widespread in Europe, the Stability and Growth Pact requires governments in the euro zone to submit macroeconomic assumptions underlying the budget predictions to external and independent monitoring. In France, this injunction has led to the creation of the High Council for Public Finances (HCFP).
In fact, government growth projections have since then been characterised by a certain prudence. The government’s growth predictions, which moved from one per cent in 2015 to 1.5 per cent in 2016, now conform to those of the different economic institutes and international organisations.
An aspect of budget projections that has been less supervised is the estimation of the counterfactual evolution of public
spending (see Box 1). Figure 1 clearly shows that the significant
effort announced on the public spending front is in fact a stabilisation, as compared to the very strong counterfactual increase that proceeded. We might ask whether this trend, or counterfactual growth, in public spending is over-estimated in order to present greater expenditure reductions or whether, rather, French public spending structurally grows at a faster rate than national revenue.
Box 1: Spending and revenues’ counterfactual growth
Spending efforts are measured relative to their counterfactual or “trend” growth. Hence, we can say that spending efforts have been made if total expenditure grows less quickly than its natural evolution. This natural evolution, or counterfactual growth, can be defined as the spontaneous change which would have occurred had legal regulations and the legislative context remained unchanged, considering the macroeconomic assumptions made, and especially that of potential growth.
The trend growth of revenue can be deduced quite simply from the hypotheses of potential growth. Indeed, revenues depend greatly on the economic conjuncture: an economic recovery translates automatically, all things being equal, into an increase in revenue. Thus, optimistic assumptions about growth imply higher trend growth.
On the other hand, the trend growth of expenditures is more difficult to determine. Most expenses are of a structural nature. Only expenditure related to unemployment benefits is cyclical and linked to the economic conjuncture. That is why expenditures’ elasticities to the economic situation are more complicated to measure than those of income tax revenues. The main effort to document trend growth is that made in Appendix 7 of the draft social security budget bill (PLFSS) on the ONDAM trend. No information is presented in the budget documents about other public expenditure.
As the Cour des comptes has stressed on several occasions, this notion of trend growth of expenditure is generally conventional : the more the estimation of this growth is biased upwards, the greater the efforts made in expenses will seem significant. Conversely, the more the underlying growth is high, the more that indicates a structural problem for the evolution of public spending.
1. L’ONDAM is the Objectif national des dépenses d’Assurance maladie (National health insurance spending aimobjective). It sets an expenditure target not to be exceeded fir healthcare and hospitalisation.The goal is to not to pass certain spending limits set for health care and hospitalisation.
IPP Note n°21
THE 2016 BUDGET: THE STRUGGLE TO CONTROL PUBLIC SPENDING
Taxation : an increase in taxation, followed by a
decrease of the tax base
A sharp increase in taxation between 2012 and 2014
The sharp increases in taxes and social contributions that took place between 2012 and 2014 did not affect all households in
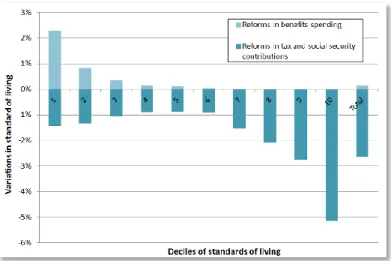
the same way. Figure 3 shows the redistributive effects, by
decile of standard of living, of the main policies adopted between 2012 and 2014 in terms of household taxation. The measures that have affected businesses, whose indirect effects.
on households are the most difficult to assess, are not taken into account here.
The effects presented here are calculated using a counterfactual situation as a reference: what would have prevailed had the policies not been adopted. Finally, for more clarity, the measures have been grouped into two main categories: spending measures (social security benefits) on one side and tax reforms (the income tax, the wealth tax, the different social deductions and indirect taxation, chiefly) on the other.
Figure 3: Redistributive effects of the policies adopted between 2012 and 2014.
Note: The standard of living of households in the first decile increased by a little more than two per cent following the measures relating to social expenditure adopted between 2012 and 2014.
NB: The proportion of taxed households is defined as the number of fiscal households that received notification of having to pay a positive amount of tax (after having taken into account tax credits and the recovery threshold), divided by the total number of fiscal households.
Sources:DGI-DGFIP reports for 2000 to 2014; estimations from the 2015
and 2016 Budgets.
The first information in this graph is that, over the course of the period studied, only households in the first decile saw their net standard of living increasing in comparison with the counterfactual situation, due to social measures directed to the poorest households: benefits, and especially the RSA, a minimum welfare benefit, have been significantly revalued since 2012. On the other hand, the increase in social contributions has led to a decrease in the standard of living for the whole population. The bottom ten per cent of households, although net winners, are also losers as far as tax reforms are concerned. These households are principally affected by the increases in VAT.
Even though they are winners, their disposable income increased by only one per cent as a result of the policies adopted. On the other hand, we note that while the policies adopted have led to a net decrease in disposal income for all the other households, these losses increased progressively with the households’ standards of living.
Households of the tenth decile thus saw their disposable income drop by more than five points over the period, because of tax reforms introduced by the government during this period. However, households situated in the middle of the distribution (deciles 4 to 6) were relatively spared by the various measures adopted since 2012: for those households, losses in standard of living remained below one per cent.
Reducing the number of tax-paying households?
The successive increases in income tax between 2011 and 2013 – in particular through the freeze of the income tax rates and brackets – led to a slight rise in the proportion of taxed
households3 , which went from 46.6 per cent in 2011 to 52.3
per cent in 2013, nearing its initial level of 2000 (see Figure 4).
3. Taxed households are the households paying a positive amount of income tax, after taking into account reductions and tax credits (including the employment bonus, a tax credit) and the minimum threshold, below which taxes are not collected. Tax-paying households are the households that must pay an income tax, before taking into account any possible tax credits and the minimum threshold.
Figure 4: Proportion of fiscal households paying an income tax
Note:In 2011, 46.6 % of fiscal households paid income tax.
NB: This figure presents variations in disposable income (expressed as a percentage of the latter) entailed by government policies adopted between 2012 and 2014, for each decile of standard of living and for the population as a whole. Consequently, the 2015 Budget measures are not taken into account. A distinction is made between the effects of policies related to social expenditures and those regarding tax policies, on the standard of living.
A number of households whose income used to be non-taxable fell into the first bracket of the schedule and had to pay an income tax which, while certainly modest, led those households
to lose some specific reductions in CSG4, a compulsory social
contribution.
The government has adopted several measures in an attempt to juggle the increase in the number of tax-paying households, by applying specific income tax reductions: an exceptional reduction (the “Valls reduction”) in 2014, followed by the suppression of the first tax bracket and a restructuring of the
décote, a mechanism which reduces the amount of income tax due and thus exempts fiscal households from paying an income tax when the amount is under a certain threshold, in 2015. The
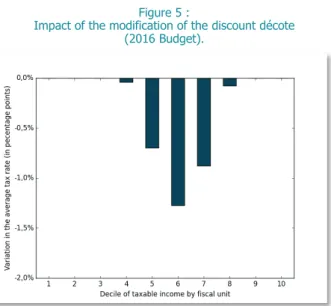
2016 Budget reformed again the décote in order to reduce the
number of fiscal households liable to pay income tax, while also limiting to the maximum the cost of this measure for public finances. This measure should concern “three million households whose income would mean that they would not have benefited from the suppression of the first tax bracket in 2015”. The government estimates the average gain per fiscal household affected by the reform at 252 euros, for a total cost of 2.1 billion euros.
The new reform of the décote will mostly affect households
belonging to the middle of the income distribution, where the first bracket of the tax schedule is situated. It will thus lead to a lowering of the average tax rate by up to 1.3 percentage points per fiscal household in the sixth decile of taxable income as
defined by the income tax laws (see Figure 5).
A simplification of the income tax?
The desire to reduce the number of tax-paying households at the least cost to public finances has led to the introduction of
ad hoc mechanisms, leaving the tax rates and brackets roughly
unchanged, to reduce the taxation of households in the first bracket of the tax schedule.
These measures have all resulted in a significant increase in the marginal tax rate for households whose income falls immediately above the taxable threshold: indeed, instead of seeing the average tax bill rise progressively as one rises on the
tax ladder, these ad hoc measures lead to a situation in which
households are not liable to pay income tax up to the point where their average tax rate jumps, and marginal rates are very high.
Figure 6 makes this phenomenon clear by showing how
effective marginal rates of income tax have changed between 2014 and 2016: the “Valls reduction” has caused marginal rates to surge above 100 per cent for a small range of taxable income, situated around 15,500 euros. The extension of the
décote in 2015 aimed to correct this perverse effect without having to backtrack on the reduction of the number of taxable
households. This new décote has a drawback, however: by
increasing marginal rates at the entry to the taxable income scale, it incidentally creates a new tax bracket within the official tax bracket affected by the marginal rate of 14 per cent.
Because of the décote mechanism, taxable income between
15,500 and 20,000 Euros are in reality taxed at a marginal rate of 25 per cent. The 2016 Budget carries on this “simplification” while reducing the real marginal rate applying to incomes at the
entry to the tax scale: the décote now decreases less quickly
with gross tax amounts, which means a reduction in the effective marginal tax rate affecting fiscal households at the beginning of the tax scale, now equal to 22.05 per cent. The corollary will be the exposure of more fiscal households to a slightly higher marginal rate, as the marginal rate of 22.05 per cent will now apply to incomes ranging between 16,300 and 23,000 euros. The simplification is, therefore, quite relative.
4. The CSG on replacement incomes (retirement pensions, invalid pensions and unemployment benefits) is levied at a lower rate if the individuals perceiving those incomes are not subject to the income tax.
Figure 5 :
Impact of the modification of the discount décote (2016 Budget).
Figure 6: Marginal income tax rates affecting income around the first tax bracket
Note: The average decrease in the income tax rate for fiscal households belonging to the sixth decile of taxable income as defined by the income tax laws (RFR)per unit is around 1.3 percentage points
NB: The average tax rate is the total income tax due divided by the net taxable income (after deductions but before reductions and credits). It appears on the tax notification.
Sources : TAXIPP 1.0.
Note: For a fiscal household whose taxable income is 20,000 euros, the real marginal tax rate is 22.05 per cent.
NB: The marginal tax rate is the supplementary tax entailed by an increase in taxable income of one euro.
IPP Note n°21
2016 BUDGET: THE STRUGGLE TO CONTROL PUBLIC SPENDING
Finding the public expenditure cuts
While the increase in tax liability was the main instrument used to reduce the public deficit at the beginning of the presidential term, since 2014 measures focus on the reduction of public spending. However, assessing the evolution of public spending for each area or item of expenditure is not easy, because of the complexity of public finances in France and the multiple budget documents it entails.
The multiple budgets of public administrations
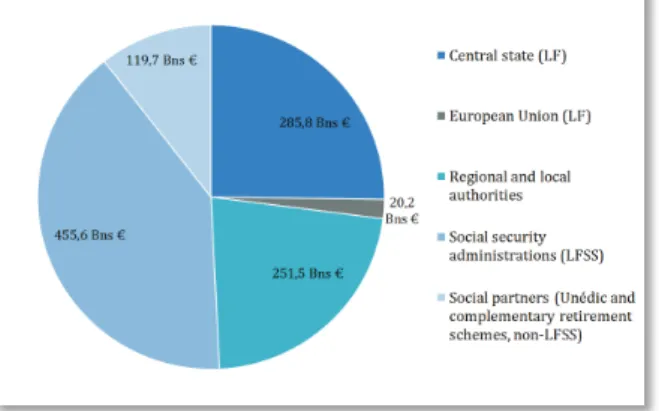
Figure 7 breaks down total public expenditures according to
their governance, distinguishing between the central state, local authorities, the European Union, the parts of the social security system that are covered by the social security budget bill (LFSS) and those managed by social partners outside the LFSS context (that is, Unédic and complementary systems).
Indeed, while the budget bill (LF) is a key element of parliamentary democracy in France, public spending is far from being entirely decided in the budget document itself, which mostly focuses on the central state budget. As in most other countries, regional and local authorities exercise a certain degree of sovereignty, a “financial autonomy” (art. 72-2 of the Constitution). A quite uncommon feature of the French Budget is that the budget bill is not the only budgetary text that determines public income and expenditure. The LFSS – created by the 1996 constitutional reform (art. 34 of the Constitution) – gives the Parliament a vote on the broad directions of Social security expenditures and their financing.
However, the Parliament does not determine effective expenses through the LFSS like the Budget (LF) determines budgetary credits in specific ways: in reality, it only sets spending targets. Finally, there is a non-negligible part of public expenditure that is neither included in the budgets of local and regional bodies, nor in that of the central state and the LFSS: it is the public spending of the unemployment insurance scheme (Unédic) and of the complementary retirement schemes (Agirc, Arrco, Ircantec, etc.), which totalised 119.7 billion euros in 2014, representing 10.5 per cent of total public expenditure. These expenses are left in the hands of social partners, beyond the scrutiny of parliament. What defines their character as “public spending” in the national accounting sense is their obligatory nature, which comes from the extension of collective agreements by the central state to all businesses. Their budgets are separated from the central state and from the budget voted through the LFSS, and are included in budget documents containing information on “toutes APU” spending, that is to say, expenses of all public administration authorities.
Where are the reductions in public spending?
Figure 8 shows the actual change in total public expenses
(corrected for inflation) for the period 2012-2016, taking into account past changes and the 2016 Budget decisions. Total public expenses should have increased by 2.6 per cent in that period. This increase is explained mainly by an increase in expenditure by the social security administration units (ASSO) (+3.3 %) and a smaller increase in central state expenses (+2 %) and local authorities expenditures (+1.1%). A significant part of the expected reduction in expenditures of the local authorities comes from the cuts in transfers coming from the central state.
Figure 7 : Public expenditures by governance units in 2014 Figure 8 : Changes in total public spending between 2012 and
2016, net of inflation
Note: Social security expenditures decided in the LFSS in 2014 were 455.6 billion euros, while social security public spending controlled by the social partners amounted to 119.7 billion euros.
NB:Central state expenses are net of transfers to local and regional authorities (levies on revenues and transfers part of the “Relation avec les collectivités territoriales” (Relations with regional authorities) budget item) and to the EU. Sources: National accounts; 2014 Budget; LFSS 2014; Unédic.
Note: Between 2012 and 2016, expenses of all public administration authorities grew by 2.6 per cent, net of inflation. In the same period, central state expenses grew by 2.0 per cent.
NB: Central state expenditures are net of transfers to local and regional authorities (levies on revenues and transfers part of the Relations with territorial authorities budget item) and to the EU.
Sources: 2012 Budget; 2016 Budget; Rapport économique, social et financier 2016; National accounts.
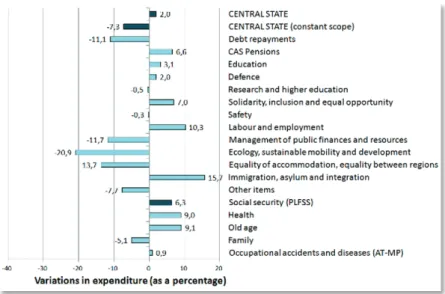
FIGURE 9 shows the same changes in the period 2012-2016, but using more detailed data provided by the Budget and the LFSS (with a more limited scope than total public expenditures). Over this period, central state expenses should have increased actually by two per cent. In order to understand which budget areas contributed to an increase or decrease of expenses, we must calculate changes in expenditure at constant scope for each budget item, that is to say, by neutralising the changes in distribution between the central state and the regional and local authorities. For instance, during this period, previous expenses included in the Family branch of social security (housing benefits, employment bonus) were incorporated in the central state budget, leading mechanically to its increase (and to the decrease of the Family branch’s budget).
Thus considering budgets net of transfers between public administration authorities, central state expenses should have decreased by 7.3 per cent between 2012 and 2016 in real terms. Regarding the central state budget, the main cuts are the reduction of ministries expenses (such as the Ministries of Finance, Environment, Transport and Housing) and the public servant payroll (index point freeze), while sparing some fields
such as education, defence and the police.
Central state expenditures rising significantly over the period
are those linked to public servant pensions (CAS pension), and
employment and immigration policies.
As to social security expenses, they should continue to increase at a rate higher than inflation (+5.3 %), mainly because of the Old age and Health sections. The Family branch registered a decrease of 5.1 per cent, for the main part explained by transfers in expenditures to the central state budget (as discussed above), but also by the capping of family allowances. While the available data in budget documents does not allow the breakdown of total public spending by public policy (housing, health, retirement, etc.) – as done in most other countries – they do nevertheless provide a general overview: most of the reductions in expenses stems from cuts in expenditures associated with the functioning of the central state and from a decrease in transfers from the central state to local authorities. Health expenses are growing significantly, but at a lower rate than in previous years. Finally, expenditures on retirement continue to grow faster than national income, thus their share in total public expenses increases.
FIGURE 9 : Changes in central state and social security expenditures, net of inflation
Note: Between 2012 and 2016, central state expenses keeping a constant scope should have reduced by 7.3 per cent in real terms.
NB: Central state expenses are net of transfers to local and regional authorities (levies on revenues and transfers part of the Relations with regional authorities budget item) and to the EU. Sources: 2012 Budget ; LFSS 2012; 2016 Budget; PLFSS 2016; Rapport économique, social et financier 2016
What are the long term prospects of public
finances?
While the time has not yet come to draw final conclusions about public finances during Hollande’s term, we nonetheless have sufficient evidence to understand the general trends. Budgetary decisions have been fairly close to the promises made during the 2012 presidential election campaign to reduce the public deficit: an increase in taxation, followed by a decrease in public expenditure. The main gap between the initial scenario and the actual trend comes from the fact that public spending has decreased less quickly than anticipated, because growth has been slower than expected, thus postponing to 2019 the perspective of a balanced budget.
This is, in a way, the main weakness of the initial plan: by betting on a strong recovery in 2014, the government hoped to avoid making difficult choices by merely containing the volume of public expenditure and thereby decreasing it as a proportion of GDP. With its hands tied by the promise not to increase compulsory social contributions, the government is now obliged to significantly reduce public spending in a context of weak growth.
………