HAL Id: halshs-00586850
https://halshs.archives-ouvertes.fr/halshs-00586850
Preprint submitted on 18 Apr 2011
HAL is a multi-disciplinary open access
archive for the deposit and dissemination of sci-entific research documents, whether they are pub-lished or not. The documents may come from
L’archive ouverte pluridisciplinaire HAL, est destinée au dépôt et à la diffusion de documents scientifiques de niveau recherche, publiés ou non, émanant des établissements d’enseignement et de
Macroeconomic effects of ownership structure in OECD
countries
Donatella Gatti
To cite this version:
Donatella Gatti. Macroeconomic effects of ownership structure in OECD countries. 2008. �halshs-00586850�
WORKING PAPER N° 2008 - 09
Macroeconomic effects of ownership structure
in OECD countries
Donatella Gatti
JEL Codes: O43, O57, G32, K31
Keywords: ownership concentration, labour market
regulation, growth, developed countries
P
ARIS-
JOURDANS
CIENCESE
CONOMIQUESL
ABORATOIRE D’E
CONOMIEA
PPLIQUÉE-
INRA48,BD JOURDAN –E.N.S.–75014PARIS TÉL. :33(0)143136300 – FAX :33(0)143136310
www.pse.ens.fr
CENTRE NATIONAL DE LA RECHERCHE SCIENTIFIQUE –ÉCOLE DES HAUTES ÉTUDES EN SCIENCES SOCIALES
Macroeconomic e¤ects of ownership structure in
OECD countries
Donatella Gatti1 March 7, 2008
1CEPN-Paris 13, Paris School of Economics, CEPREMAP and IZA. The author
is indebted to Dominique Plihon, Antoine Rebérioux, Jean-Philippe Tou¤ut, Anne-Gaël Vaubourg and Christophe Clerc for extremely helpful discussions on the topic.
Abstract
Macroeconomic e¤ects of ownership structure in OECD countries The paper investigates the impact of ownership concentration on GDP growth, for a sample of 18 OECD countries over the period 1980 to 2004. The econometric analysis shows that more concentrated ownership can speed up growth, for countries approaching the technological frontier, provided that labour market regulation is su¢ ciently tight. In the absence of employment regulation, the logic of …nancial markets discipline applies and dispersed ownership appears as more favorable for growth. Based on econometric results, impact coe¢ cients are calculated allowing to evaluate the growth points gained/lost following a given change in ownership concentration. This exercise reveals that a reform in the domain of ownership structure can yield sizeable e¤ects in terms of growth. Importantly, these e¤ects are unequally distributed across countries: Anglo-Saxon countries would take more ad-vantage of deregulation (i.e. increased dispersion of ownership in a context of deregulated labour markets) while continental European countries would bene…t more from increased concentration of ownership in a context of re-inforced labour regulation.
JEL Classi…cation: O43, O57, G32, K31
Key words: ownership concentration, labour market regulation, growth, developed countries
1
Introduction
This paper shades light on the macroeconomic consequences of …rms’own-ership structures. The importance of own…rms’own-ership structure with respect to macroeconomic performance has been acknowledged since the in‡uential contributions by La Porta et al. [1998] and [1999] as well as, more recently, Djankov et al. [2006]. These authors investigate the e¤ects of ownership in large sample of developing/developed countries and underline the possible emergence of perverse political economy mechanisms leading powerful own-ers to ensure their interest by countering (at the political level) the …nancial development of a country. Hence, concentrated ownership would lead to underdevelopment traps with immature …nancial markets and weak growth (see also Morck, Wolfenzon and Yeung , 2005).
This result relies on a standard distinction made within the corporate
governance literature1 between two alternative models of governance: the
"insider" model (based on stable concentrated ownership) and the "outsider" model - based on dispersed ownership. Part of the literature identi…es the Anglo-Saxon (outsider) corporate governance model as the most performing one, in particular during the last decade. However, some authors insist on the fact that each model of corporate governance has its own strengths and weaknesses (Shleifer and Vishny 1997).
In fact, recent contributions in law and economics suggest that the im-pact of ownership structure indeed depends on "contexts". In particular, markets’ regulation provides a crucial environment to assess the e¤ects of di¤erent structures of ownership. More speci…cally, a link would exist be-tween ownership structure and employment relations because stable, con-centrated ownership contributes, together with labour market regulation, to foster long-term partnerships with crucial categories of stake-holders (Blair, 2003; Deakin et al., 2002; Rebérioux, 2002). A similar argument is devel-oped within the approach in terms of "varieties of capitalism". This liter-ature suggests that corporate governance models are embedded into larger institutional frameworks (Aguilera and Jackson, 2003). Stable institutional arrangements contribute to foster cooperation among actors within corpo-rations (shareholders as well as stakeholders): cooperation allows to achieve
1
Becht and Mayer, 2001; Faccio and Lang, 2002; Gugler et al., 2004; Shleifer and Vishny, 1997.
better economic performance, by favouring speci…c investments by/on stake-holders as well as long-term projects by corporate managers (Deakin et al., 2002; Hall and Soskice, 2001).
In a similar vein, contributions in political economy and political eco-nomics indicate that ownership and markets regulations should be seen as joint results of a political process. Pagano and Volpin (2005) highlight two possible political equilibriums emerging out of a political compromise be-tween employees and managers: a "corporatist" equilibrium achieved by exchanging larger independence for managers against stronger employment protection, and an Anglo-Saxon equilibrium characterized by strong share-holders protection and weak job security. Baker and Rueda [2007] describe "the situation prevailing in the golden age of social democracy" as the re-sult of a de facto coalition between "insider capital" and "insider labor": this coalition allows insider actors to extract rents from outsider actors, and redistribute the bene…t of these rents among insiders. Hence, the insider model of corporate governance would require not only concentrated owner-ship, but also stable labour relations. On the contrary, the outsider model would be based on more dispersed ownership and ‡exible labour relations.
Turning to the empirical evidence, a growing stream of literature in-vestigates the macroeconomic impact of markets’regulation within OECD countries. This literature points to the need for deregulation on product, labour and …nancial markets in order to speed up growth, particularly when a country is approaching the "technological frontier" (Aghion, 2006; Conway et al., 2006; Nicoletti and Scarpetta, 2003; Acemoglu et al., 2007). Acemoglu et al. [2007] suggest that increased regulation more "e¤ectively" reduces in-centives to innovate in countries/sectors close to the technological frontier. However, a few recent contributions cast some doubt on the robustness of these results (Amable, Demmou and Ladezma, 2007). Unfortunately, all studies above overlook the role of ownership structure.
This paper aims to …ll the gap and empirically assess the joint e¤ects of ownership structure and labour markets’ regulation on GDP per employee growth, for a sample of 18 OECD countries, over the period 1980-2004. In the next section, I explore the main theoretical channels through which own-ership concentration can in‡uence growth, and also present some descrip-tive evidence about the linkages between ownership concentration, labour market regulation and GDP per employee growth. In section 3, the
econo-metric framework is proposed and evidence is presented by testing a growth equation on macroeconomic data for 18 OECD countries. In section 4, the estimated model is used to calculate impact coe¢ cients for ownership con-centration on growth; results from simulations are discussed providing some hints on the e¤ects of di¤erent scenarios of structural reforms. Section 5 brie‡y concludes.
2
Ownership structure: a macroeconomic approach
In this section, I present the main theoretical channels through which owner-ship structure may in‡uence GDP per employee growth. I subsequently turn to the descriptive evidence concerning the e¤ects of ownership structure, by exploiting a dataset of 18 OECD countries over the period 1980-2004.
2.1 theoretical channels
In their in‡uential contributions, La Porta et al. [1998] and [1999] as well as Djankov et al. [2006] develop a framework to assess the impact of ownership structure on growth, based on the logic of …nancial markets development and discipline. The authors adhere, in particular, to the idea that a single "best solution" exists to the agency problem between managers and own-ers: a system of dispersed ownership (linked to highly developed …nancial markets) coupled with strong legal protection of shareholders. The reasons why this system would favor growth are two-fold. First, while owners are prevented to exert strong direct control because they own small shares of public companies, managers are exposed to exit and/or takeover threats; this market discipline ensures that managers will "do the right thing" to maximize the company value. Second, dispersed ownership prevent owners to become too powerful and divert wealth according to their own private interest; this allows to avoid perverse political economy scenarios, such as powerful elites countering the …nancial development of a country, at the political level. To sum up, this situation is expected to yield an e¢ cient allocation of investments, and positive e¤ects on growth.
A few critics can be raised against these conclusions. First of all, the e¤ects of concentrated ownership are probably very di¤erent according to a country level of development. If one focuses on developed countries, it appears that the structure of ownership primarily has to "…t" production
needs: in speci…c sectors, concentrated ownership may well be bene…cial to production, by favoring cooperation, economic stability and speci…c invest-ments (Carlin and Mayer, 2003; Hall and Soskice, 2001). Moreover, tight …nancial markets discipline also yields a bias in strategic investments, by leading to excessive short-term maximization of …rms’market value (Blair, 2003).
The literature has explored possible alternatives to …nancial markets discipline and "shareholders models". In particular, scholars have recently turned to the so called "stakeholders model" within which stakeholders, and in particular employees, are seen as actors making speci…c investments and thus improving their company’s capital stock and value. However, for speci…c investment to emerge, e¤ective incentives must be in place: stable partnerships appear as a possible device to protect investors. Stable part-nerships can be enforced through law and regulation, as well as through a greater concentration of ownership (Blair, 2003; Deakin et al., 2002). Hence, ownership concentration and markets regulation both appear to be ingredi-ents of a stakeholder model of governance, thus favouring growth through investments in …rm speci…c assets such as human and physical capital.
A related argument is explored by Kharroubi [2006] who studies the ef-fects of markets regulation on technology and growth. The model shows that markets regulation pushes …rms to invest in more productive technologies through a two-fold incentive mechanism: …rst, upgrading capital allows …rms to make their "almost-…xed" labour stock more e¢ cient; second, whenever technological investments are successful, they generate higher cash-‡ows al-lowing to ease liquidity constraints. Hence, markets regulation may generate positive macroeconomic e¤ects in terms of growth.
Finally, ownership concentration and markets regulation are frequently
associated with the emergence of economic and/or political "elites". It
should be noted that, in the presence of externalities and market failures, elites can e¤ectively improve coordination across economic actors and fa-vor industrial modernization (Amable and Hancké, 2001). This mechanism bears important consequences for innovation and growth: business coordi-nation (through elites, connected ownership and networks) allows …rms to better account for externalities stemming from education and innovation activities (Gatti, 2000). Hence, corporations embedded in coordinated envi-ronments are likely to engage in education and research investments bearing
important externalities, that would otherwise be overlooked by private ac-tors.
The theoretical arguments brie‡y reviewed above suggest that di¤erent structures of ownership may yield contrasted e¤ects on growth. In partic-ular, the "context" (i.e. markets regulation) plays a crucial role: in the presence of tightly regulated markets, ownership concentration creates centives for corporate stakeholders to bear substantive e¤orts in speci…c in-vestments; on the other hand, deregulated markets and dispersed ownership enforce market discipline as a device preventing costly ine¢ ciencies.
The issue is therefore primarily empirical. I now turn to present the descriptive empirical evidence drawn on a sample of OECD countries over the period 1980 to 2004.
2.2 what do data suggest?
The empirical analysis relies on a sample of 18 OECD countries2 over the
period 1980 to 2004. The sample includes a number of variables captur-ing the institutional, regulatory, political and macroeconomic features of all countries. These variables are presented and commented in the Appendix. In this Section, I will focus on three main variables in my analysis: macro-economic performance, ownership structure and labour market regulation.
In order to capture macroeconomic performance, I rely on data about GDP per employee (both in level and in growth rate); these data are drawn from OECD as well as Penn World Table.
Concerning the structure of ownership, no OECD or World Bank stan-dards exist in the area. One can alternatively exploit measures of e¤ective ownership concentration or rely on indirect measures of legal environment (shareholders protection, for instance). Because my main focus is about capturing the overall stability of ownership, I rely on data measuring e¤ec-tive ownership concentration (OC indicator). Very few data are available for large scale cross-country analyses. A suitable indicator is provided by La Porta et al. [1998], [1999] and Djankov et al. [2006]. However, only one
single observation in time is available:3 concentration is measured as the
2
Those countries are: Australia, Austria, Belgium, Canada, Denmark, Finland, France, Germany, Ireland, Italy, Japan, Netherlands, Norway, Portugal, Spain, Sweden, United Kingdom, United States
3
Kho et al. [2006] propose an indicator of ownership concentration based on Worldscope data, available for two points in time (1994 and 2004). However, the authors themselves
"average percentage of common shares owned by the top three shareholders in the ten largest non-…nancial, privately-owned domestic …rms in a given country. A …rm is considered privately-owned if the State is not a known shareholder in it".
Finally, turning to regulation on labour markets (EPL indicator), this is captured through the time-series indicator provided by Amable, Demmou and Gatti [2007]. This measure is obtained by interpolating the standard OECD indicator, on the basis of information collected through the FRDB
Social Reforms Database4. FRDB database provides detailed records about
social reforms in European countries in the areas of employment protec-tion legislaprotec-tion, over the period 1985-2005. The speci…c procedure used to construct the EPL series is fully described by Amable, Demmou and Gatti [2007].
Let us now have a …rst look at the data and, in particular, to the de-scriptive evidence about levels of regulation and concentration, as well as their e¤ects on growth.
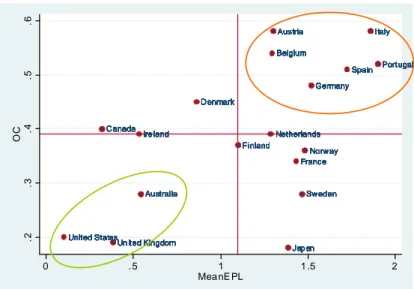
Figure 1 below presents EPL and OC indicators for all countries included in the sample (vertical and horizontal red lines represent sample mean of each variable). The average country values of EPL is depicted against the single available country values of ownership concentration. As the …gure shows, countries in the sample are distributed across di¤erent levels of labour mar-kets regulation and ownership concentration. However, a positive correlation appears between the two indicators of labour markets regulation and own-ership concentration. The picture also highlights countries for which both OC and EPL are above (below) the sample mean value (sample means are indicated by brown lines). An important number of countries appear to be characterized by either high or low levels of both OC and EPL: as expected, Anglo-Saxon countries share low concentration and low regulation; while South European countries as well as Germany, Belgium and Austria feature high concentration and high regulation. However, several countries lie be-tween these two groups, in particular North European countries as well as France, Ireland and Canada.
point to several weaknesses of these data, in particular the fact that Worldscope …rms’ population is very heterogenous (in size and composition) across countries and unstable over time (it has actually been increasing over time).
4The FRDB Social Reforms Database has been developed by the Fondazione Rodolfo
Australia Australia Australia Australia Australia Australia Australia Australia Australia Australia Australia Australia Australia Australia Australia Australia Australia Australia Australia Australia Australia Australia Australia Australia Austria Austria Austria Austria Austria Austria Austria Austria Austria Austria Austria Austria Austria Austria Austria Austria Austria Austria Austria Austria Austria Austria Austria Austria Belgium Belgium Belgium Belgium Belgium Belgium Belgium Belgium Belgium Belgium Belgium Belgium Belgium Belgium Belgium Belgium Belgium Belgium Belgium Belgium Belgium Belgium Belgium Belgium Canada Canada Canada Canada Canada Canada Canada Canada Canada Canada Canada Canada Canada Canada Canada Canada Canada Canada Canada Canada Canada Canada Canada Canada Denmark Denmark Denmark Denmark Denmark Denmark Denmark Denmark Denmark Denmark Denmark Denmark Denmark Denmark Denmark Denmark Denmark Denmark Denmark Denmark Denmark Denmark Denmark Denmark Finland Finland Finland Finland Finland Finland Finland Finland Finland Finland Finland Finland Finland Finland Finland Finland Finland Finland Finland Finland Finland Finland Finland Finland Franc e Franc e Franc e Franc e Franc e Franc e Franc e Franc e Franc e Franc e Franc e Franc e Franc e Franc e Franc e Franc e Franc e Franc e Franc e Franc e Franc e Franc e Franc e Franc e Germany Germany Germany Germany Germany Germany Germany Germany Germany Germany Germany Germany Germany Germany Germany Germany Germany Germany Germany Germany Germany Germany Germany Germany Ire land Ire land Ire land Ire land Ire land Ire land Ire land Ire land Ire land Ire land Ire land Ire land Ire land Ire land Ire land Ire land Ire land Ire land Ire land Ire land Ire land Ire land Ire land Ire land Italy Italy Italy Italy Italy Italy Italy Italy Italy Italy Italy Italy Italy Italy Italy Italy Italy Italy Italy Italy Italy Italy Italy Italy Jap an Jap an Jap an Jap an Jap an Jap an Jap an Jap an Jap an Jap an Jap an Jap an Jap an Jap an Jap an Jap an Jap an Jap an Jap an Jap an Jap an Jap an Jap an Jap an Netherlands Netherlands Netherlands Netherlands Netherlands Netherlands Netherlands Netherlands Netherlands Netherlands Netherlands Netherlands Netherlands Netherlands Netherlands Netherlands Netherlands Netherlands Netherlands Netherlands Netherlands Netherlands Netherlands Netherlands Norway Norway Norway Norway Norway Norway Norway Norway Norway Norway Norway Norway Norway Norway Norway Norway Norway Norway Norway Norway Norway Norway Norway Norway Portugal Portugal Portugal Portugal Portugal Portugal Portugal Portugal Portugal Portugal Portugal Portugal Portugal Portugal Portugal Portugal Portugal Portugal Portugal Portugal Portugal Portugal Portugal Portugal Spain Spain Spain Spain Spain Spain Spain Spain Spain Spain Spain Spain Spain Spain Spain Spain Spain Spain Spain Spain Spain Spain Spain Spain Sweden Sweden Sweden Sweden Sweden Sweden Sweden Sweden Sweden Sweden Sweden Sweden Sweden Sweden Sweden Sweden Sweden Sweden Sweden Sweden Sweden Sweden Sweden Sweden Un ited Kingdom Un ited Kingdom Un ited Kingdom Un ited Kingdom Un ited Kingdom Un ited Kingdom Un ited Kingdom Un ited Kingdom Un ited Kingdom Un ited Kingdom Un ited Kingdom Un ited Kingdom Un ited Kingdom Un ited Kingdom Un ited Kingdom Un ited Kingdom Un ited Kingdom Un ited Kingdom Un ited Kingdom Un ited Kingdom Un ited Kingdom Un ited Kingdom Un ited Kingdom Un ited Kingdom United States United States United States United States United States United States United States United States United States United States United States United States United States United States United States United States United States United States United States United States United States United States United States United States .2 .3 .4 .5 .6 OC 0 . 5 1 1 .5 2 Mea nE PL
Figure 1. OC and EPL in sample countries
I now turn to the question of the relation between OC and GDP per employee growth. Figures 2 below allows to get a …rst impression about the e¤ects of ownership concentration on growth. In this …gure, average country growth rates of GDP per employee are drawn against OC. In the …gure, I have highlighted countries experiencing average growth rates (over the whole period)) that are higher than the sample mean. As one can see, those countries are fairly distributed across di¤erent levels of concentration and regulation. In particular, there does not seem to be any clear negative relationship between concentration, regulation and growth. An important subset of countries (among which Germany and North European countries) have experienced fast growth rates in spite of high levels of concentration and/or regulation.
The descriptive evidence suggests that, within the sample and period considered, there is a positive relationship between levels of regulation and concentration. Moreover, fast growth does not appear to be the matter of low regulation/low concentration countries, but rather distributed across countries also showing high values of EPL and/or OC. To investigate more deeply the correlations between ownership, regulation and growth, let us now turn to the econometric analysis.
Does high OC prevent growth? Aul Aul Aul Aul Aul Aul Aul Aul Aul Aul Aul Aul Aul Aul Aul Aul Aul Aul Aul Aul Aul Aul Aul Aul Aus Aus Aus Aus Aus Aus Aus Aus Aus Aus Aus Aus Aus Aus Aus Aus Aus Aus Aus Aus Aus Aus Aus Aus Bel Bel Bel Bel Bel Bel Bel Bel Bel Bel Bel Bel Bel Bel Bel Bel Bel Bel Bel Bel Bel Bel Bel Bel Can Can Can Can Can Can Can Can Can Can Can Can Can Can Can Can Can Can Can Can Can Can Can Can Den Den Den Den Den Den Den Den Den Den Den Den Den Den Den Den Den Den Den Den Den Den Den Den Fin Fin Fin Fin Fin Fin Fin Fin Fin Fin Fin Fin Fin Fin Fin Fin Fin Fin Fin Fin Fin Fin Fin Fin Fr Fr Fr Fr Fr Fr Fr Fr Fr Fr Fr Fr Fr Fr Fr Fr Fr Fr Fr Fr Fr Fr Fr Fr Ger Ger Ger Ger Ger Ger Ger Ger Ger Ger Ger Ger Ger Ger Ger Ger Ger Ger Ger Ger Ger Ger Ger Ger Ir Ir Ir Ir Ir Ir Ir Ir Ir Ir Ir Ir Ir Ir Ir Ir Ir Ir Ir Ir Ir Ir Ir Ir It It It It It It It It It It It It It It It It It It It It It It It It Jap Jap Jap Jap Jap Jap Jap Jap Jap Jap Jap Jap Jap Jap Jap Jap Jap Jap Jap Jap Jap Jap Jap Jap NL NL NL NL NL NL NL NL NL NL NL NL NL NL NL NL NL NL NL NL NL NL NL NL Nor Nor Nor Nor Nor Nor Nor Nor Nor Nor Nor Nor Nor Nor Nor Nor Nor Nor Nor Nor Nor Nor Nor Nor PT PT PT PT PT PT PT PT PT PT PT PT PT PT PT PT PT PT PT PT PT PT PT PT Sp Sp Sp Sp Sp Sp Sp Sp Sp Sp Sp Sp Sp Sp Sp Sp Sp Sp Sp Sp Sp Sp Sp Sp Sw Sw Sw Sw Sw Sw Sw Sw Sw Sw Sw Sw Sw Sw Sw Sw Sw Sw Sw Sw Sw Sw Sw Sw UK UK UK UK UK UK UK UK UK UK UK UK UK UK UK UK UK UK UK UK UK UK UK UK US US US US US US US US US US US US US US US US US US US US US US US US 0 .01 .02 .03 M ea nG row th .2 .3 .4 .5 .6 OC Growth and OC higher than average Growth higher and OC lower than average Figure 2
3
Econometric analysis
In this section, I develop an econometric analysis based on a standard growth equation. After presenting the empirical model to be tested, I brie‡y discuss the methodological issues related to estimations. Econometric results are then presented and their robustness checked in particular with respect to endogeneity issues.
3.1 empirical model
We have seen that recent contributions on the determinants of growth focus on the consequences of markets regulations on innovation: according to
sev-eral authors,5 regulation a¤ects innovation and growth di¤erently according
to a country’s distance with respect to the technological (or production) frontier. This assumption implies that the macroeconomic consequences of regulation depend on contexts, i.e. on the level of development and wealth. This assumption is certainly fair. However, a crucial question rises con-cerning the direction of the e¤ects of regulation on growth, when countries
5
Aghion [2006], Conway et al. [2006], Nicoletti and Scarpetta [2003], Acemoglu, Aghion and Zilibotti [2007].
get closer to the frontier. The standard argument is that countries get more and more harmed by markets regulation as they get closer to the frontier. However, the theoretical issues and empirical evidence presented in the pre-vious section suggest that countries may indeed pro…t more from stricter regulation and ownership concentration when they approach the technolog-ical frontier: stronger incentives to invest in up-to-date technologies, higher productive e¤ort and implication by workers, a better perception of exter-nalities linked to innovation could be crucial advantages to gain/consolidate a leadership position.
To tackle this issue, I estimate the joint e¤ects of labour markets reg-ulation and ownership concentration on growth, by using OECD data on 18 developed countries over the period 1980-2004. The estimated model includes regulation and ownership indicators, macroeconomic controls, the e¤ects of externalities from leader countries as well as a measure of indi-vidual countries’distance with respect to the technological frontier (see, in particular, Nicoletti and Scarpetta, 2003):
ln yi;t = i+ 1 ln yF t+ 1 Xi;t+ 2 Yi;t+ 3 Educi;t+
+ 1 oci;t+ 2 epli;t+ 3 oci;t epli;t+ (1)
+ 4 dfi;t oci;t+ 5 dfi;t epli;t+ i;t
i= individual country …xed e¤ect, yi;t= GDP per employee, ln yi;t =
growth rate (di¤erence between logGDP at the end and at the beginning
of period t), yF t = GDP per employee of frontier country at time t (the
frontier country is the country which has the highest GDP per employee
level at period t), dfi;t = lnyF tyi;t = country i distance with respect to the
frontier at time t (the closer the country is to frontier the smaller the value
of di;t with 05 dfi;t5 1). Moreover, Educi;t= a proxy for human capital in
country i at time t, Yi;t = vector of macroeconomic controls, Xi;t = vector
of markets regulation variables, epli;t = employment protection legislation,
oci;t= ownership concentration.
In order to properly estimate (1) one has to solve two methodological problems: …rst, how to treat slowly changing variables (such as indicators for regulation and ownership concentration) within a …xed e¤ects model; second, how to appreciate the overall e¤ects of variables included in interactions
terms.
Concerning the …rst problem, a few variables included in the model (such as ownership concentration and product market regulation) are invariant or change very slowly. These variables capture features that characterize a single country - or a small subset of countries: they are thus very close to individual country e¤ects. Plümper and Tröger [2007] propose a speci…c technique for analyzing the e¤ect of time-invariant variables in …xed-e¤ect models: the FEVD estimator. This procedure takes three steps: (i) estimate a …xed-e¤ects model (ii) regress the unit e¤ects on the time-invariant vari-ables (iii) re-estimate the …rst stage including the error term of the second stage. The procedure amounts to extracting from the …xed e¤ect the part of it that is explained by slowly changing variables. This allows to give more sense to …xed e¤ects by explicitly modelling their institutional components. The FEVD estimator appears to be crucial in the present study because of the speci…city of certain indicators, in particular OC wich has no time pro…le.
Turning to the second issue, the empirical model (1) includes three in-teraction terms allowing to capture the idea that the macroeconomic con-sequences of ownership structure depend on contexts. First, we have seen that the impact of ownership may vary in response to the degree of regu-lation on labour markets: this e¤ect is apprehended through an interaction term between EPL and OC. Second, the consequences of regulation and ownership may also depend on the country’s distance to the technological frontier; for this reason, I have included two interaction terms between EPL (respectively, OC) and countries’distance to frontier (DF). In the presence of interaction terms, the overall impact of OC and EPL on growth is ob-tained by computing the marginal e¤ect conditional on speci…c values of the interacted variables (Braumeoller, 2004). From model (1) one has:
@ ln y
@oc = 1+ 3 epl + 4 df (2)
@ ln y
@epl = 2+ 3 oc + 5 df
Hence, the consequences of ownership concentration depend …rst, on the regulatory context (the level of EPL) and second, on the country distance to frontier (the value of DF). The same reasoning applies to employment
protection legislation. A speci…c procedure presented by Amable, Demmou and Gatti [2007] allows to evaluate the e¤ects of each relevant variable for di¤erent levels of the interacted variables. This amounts to calculating the marginal e¤ects of each relevant variable, as well as all statistics about the signi…cance of those marginal e¤ects.
3.2 results
I now turn to the analysis of GDP per employee’s growth. My baseline model is (1) which includes regulation and ownership indicators, macro-economic controls and a proxy for human capital (education). My main focus is on the e¤ects of ownership concentration and employment protec-tion legislaprotec-tion. However, I also include instituprotec-tional variables controlling for other characteristics of product market structure, such as state intervention (PMR-SI) and the extent of regulation in key-service sectors (REGREFF). I run regressions using two alternative estimators: the FEVD estimator, which yields e¢ cient estimations of slowly-changing variables, and two-stage instrumental variable estimator (XTIVREG2 procedure) which allows to control for a possible endogeneity of regressors. Invariant variables in FEVD regressions are: product market regulation-state intervention (PMR-SI) and ownership concentration (OC).
A growing literature suggests that institutional devices (such as own-ership concentration and markets regulation) may be endogenous and de-pend on several concurring processes: feedback from economic performance, political pressures, legal constraints, path dependence (Amable and Gatti, 2004; Cusack, Iversen and Soskice, 2007; Gatti and Glyn, 2006; Pagano and Volpin, 2005; Persson, Roland and Tabellini, 2007). From an empirical point of view, the question is how to satisfactorily account for endogeneity. A few recent papers tackle the issue of endogeneity with longitudinal data for developed and/or developing countries (Amable, Gatti and Schumacher [2006]; La Porta et al. 1998, 1999; Djankov, La Porta, López-de-Silane and Shleifer 2006) by making use of an instrumental variables (IV) approach. I adopt the same procedure in this paper and consider the following variables as endogenous: Distance to frontier, EPL*Distance to frontier, OC*Distance to frontier, EPL, OC, EPL*OC. The selected instruments for IV estimations are: lagged endogenous variables, age structure of the population (propor-tion of elderly people), unions’bargaining power (union density rate), Rae’s
index of fractionalization of party system, incidence of protest votes. Results presented in table below show similar coe¢ cients for the two alternative estimation procedures. However, it appears to be impossible to properly account for time-invariant variables (such as OC and PMR-SI) with the instrumental variable procedure. The OC variable automatically drops out of regressions (and does not show up in results below), because it confounds with unit …xed e¤ects in …rst-stage regressions. On the contrary, the FEVD procedure allows to cope with this problem by extracting, from …xed e¤ects, the component that is explained by slowly-changing indicators. Hence, this procedure appears as more appropriate to estimate (1).
As one can see from Table 1, human capital contributes to speed up GDP per employees’ growth, while distance to frontier appears to play mostly through interaction terms. Concerning EPL, OC and PMR-SI all prove signi…cant in FEVD regressions, while REGREFF is never signi…cant. State intervention yields a positive e¤ect, which can be explained by the role of state-owned companies in fostering innovation in crucial sectors of the economy. As suggested in existing economic literature (quoted in Sections above), the direct e¤ect of EPL and OC on growth is negative.
However, additional information about the overall e¤ects of EPL and OC needs to be gathered from the analysis of the interaction terms. In fact, all interaction terms are signi…cant under FEVD and XTIVREG2 regressions. As one can see, the interaction between EPL and OC has a positive and signi…cant impact on growth: stronger employment protection (respectively, ownership concentration) favors growth in contexts where OC (respectively, EPL) levels are higher. This counters the direct negative e¤ects of increased regulation and concentration. Moreover, results about the two interaction terms between "distance to frontier", on the one hand, and EPL or OC, on the other hand, prove that the overall impact of EPL and OC on growth depends on the country position with respect to the frontier. Given the signs of the estimated coe¢ cients, the negative impact of OC on growth becomes smaller when approaching the frontier. Concerning the e¤ect of EPL, the positive sign of the interaction term shows that the direct negative impact of EPL is considerably reduced for countries that are far away from the frontier.
Table 1
DlogGDP per employee [1] [2]
DlogFrontier 0.302*** 0.297***
(0.108) ( 0.092)
Distance to frontier 0.119 0.206*
(0.086) ( 0.128) Effective real exchange rate -0.024* -0.031** (0.014) (0 .012) Education 0.061*** 0.078*** (0.015) (0 .023) EPL*distance to frontier 0.114*** 0.188*** (0.032) (0.042) OC*distance to frontier -0.409* -0.737** (0.218) (0.349) EPL -0.075*** -0.132* (0.026) (0.069) EPL*OC 0.154*** 0.272* (0.053) (0.148) REGREFF 0.000 0.00 (0.001) (0.00) OC -0.039*** (0.007) PMR SI 0.011*** 0.0054 (0.001) (0.004) eta 1.000*** (0.045)
Estimator XTFEVD XTIVREG2
pcse option gmm option
Time/country dummies Yes Yes
Number of Obs 410 380
Note: Standard errors in parentheses * p<0.10, ** p<0.05, *** p<0.01
Summary test statistics for IV regression
Anderson Rubin test F(9,343)= 6.28 P-value<1%
Stoch Wright test Chi-sq(9)=41.12 P-value<1%
Hansen J statistic 5.442 P-value>10%
Endogeneity test 17.962 P-value<5%
A more detailed evaluation of the direct/indirect e¤ects of OC and EPL is reported in the Appendix (Table 2) where I present estimations for all marginal coe¢ cients. The main implications of these estimation results are presented in the following section.
4
Evaluating the impact of ownership
concentra-tion
As shown in Table 1 (…rst column), the FEVD procedure provides robust estimations for time-invariant indicators (OC in particular). Based on such estimations, it appears that the impact of variable OC on growth depends on contexts, i.e. on existing regulation and on country "distance to frontier".
More precisely, Table 2 (Appendix) gives all marginal coe¢ cients for OC (and EPL). This shows that the overall OC coe¢ cients are negative for low levels of EPL, and become positive for higher levels of EPL (if country "distance to frontier" ranges from average to very small). Hence, ownership concentration favors growth when countries get closer to frontier provided that those countries feature (at least) average levels of employment protec-tion legislaprotec-tion. The e¤ect becomes stronger the closer a country gets to frontier.
These results provide an answer to the crucial questions raised in this paper. First, stronger ownership concentration is not necessarily bad for growth. Second, leader countries bene…t more from ownership concentra-tion in the presence of a strong regulaconcentra-tion on the labour market. Hence, econometric results provide some support to the theoretical arguments sug-gesting a positive impact of concentration on growth, provided that concen-trated ownership is embedded into a suitable context (i.e. a highly regulated environment). I will explore more deeply the issue in Section below.
4.1 overall e¤ects of changes in concentration
I rely hereafter on estimated marginal coe¢ cients reported in Table 2
(Ap-pendix). These coe¢ cients can be used to build impact coe¢ cients for
variable OC. Impact coe¢ cients measure the growth points gained/lost fol-lowing a certain increase in ownership concentration. I calculate impact coe¢ cients for di¤erent reference values of context variables: levels of regu-lation and country distance to frontier (DF). In particular, I consider three groups of countries: ’leaders’ for which variable DF goes from min DF up to meanDF minus one sdDF ; ’average countries’for which variable DF is comprised between meanDF minus one sdDF and meanDF plus one sdDF ; and …nally, ’laggards’ for which variable DF ranges between max DF and meanDF plus one sdDF .
Let me now turn to the analysis of the overall impact of ownership con-centration on growth. By using coe¢ cients presented in Table 2, I calculate the growth points gained/lost following a 5 points increase in ownership con-centration (ex. from 20% to 25% of concon-centration), provided that estimated coe¢ cients are statistically signi…cant. These gains/losses are evaluated for minimum to maximum country distance to frontier. Results are presented in Figure 3 below. -1,5% -1,0% -0,5% 0,0% 0,5% 1,0% 1,5%
Leaders Average Laggards
Max EPL High EPL Av EPL Min EPL
Figure 3. Growth points gained/lost following a 5 points increase in OC
The picture shows that, for laggards and average countries, the overall impact of a 5 point increase in ownership concentration is signi…cant and negative with low EPL levels, while not signi…cant when EPL takes aver-age to maximum levels. For leader countries, it appears that the impact of increased ownership concentration becomes signi…cant and positive when employment regulation ranges from average to maximum levels; in this case, the overall impact of a 5 points increase in ownership concentration is rel-atively important for growth as it delivers additional 1-1,3 points of GDP per employee growth.
One might want to know how would sample countries be a¤ected by such an increase in ownership concentration. Figure 4 below shows that coun-tries would respond di¤erently as a consequence of a change in ownership
structure. If one focuses on countries that are relatively close to the fron-tier, it appears that Anglo-Saxon countries (and in particular the US and Canada) lie in an area where one can expect negative e¤ects from increased OC because of the very low levels of EPL; on the other hand, many Eu-ropean countries actually lie in an area where they would actually bene…t from such increase thanks to the high levels of regulation. This result calls for futher checks; I will therefore explore more deeply the consequences of reforms in ownership and regulation, in the following Section.
Increasing OC : which impact in sample countries?
Aul Aul Aul Aul Aul Aul Aul Aul Aul Aul Aul Aul Aul Aul Aul Aul Aul Aul Aul Aul Aul Aul Aul Aul Aul Aus Aus Aus Aus Aus Aus Aus Aus Aus Aus Aus Aus Aus Aus Aus Aus Aus Aus Aus Aus Aus Aus Aus Aus Aus Bel Bel Bel Bel Bel Bel Bel Bel Bel Bel Bel Bel Bel Bel Bel Bel Bel Bel Bel Bel Bel Bel Bel Bel Bel Can Can Can Can Can Can Can Can Can Can Can Can Can Can Can Can Can Can Can Can Can Can Can Can Can Den Den Den Den Den Den Den Den Den Den Den Den Den Den Den Den Den Den Den Den Den Den Den Den Den Fin Fin Fin Fin Fin Fin Fin Fin Fin Fin Fin Fin Fin Fin Fin Fin Fin Fin Fin Fin Fin Fin Fin Fin Fin Fr Fr Fr Fr Fr Fr Fr Fr Fr Fr Fr Fr Fr Fr Fr Fr Fr Fr Fr Fr Fr Fr Fr Fr Fr Ger Ger Ger Ger Ger Ger Ger Ger Ger Ger Ger Ger Ger Ger Ger Ger Ger Ger Ger Ger Ger Ger Ger Ger Ger Ir Ir Ir Ir Ir Ir Ir Ir Ir Ir Ir Ir Ir Ir Ir Ir Ir Ir Ir Ir Ir Ir Ir Ir Ir It It It It It It It It It It It It It It It It It It It It It It It It It Jap Jap Jap Jap Jap Jap Jap Jap Jap Jap Jap Jap Jap Jap Jap Jap Jap Jap Jap Jap Jap Jap Jap Jap Jap NL NL NL NL NL NL NL NL NL NL NL NL NL NL NL NL NL NL NL NL NL NL NL NL NL Nor Nor Nor Nor Nor Nor Nor Nor Nor Nor Nor Nor Nor Nor Nor Nor Nor Nor Nor Nor Nor Nor Nor Nor Nor PT PT PT PT PT PT PT PT PT PT PT PT PT PT PT PT PT PT PT PT PT PT PT PT PT Sp Sp Sp Sp Sp Sp Sp Sp Sp Sp Sp Sp Sp Sp Sp Sp Sp Sp Sp Sp Sp Sp Sp Sp Sp Sw Sw Sw Sw Sw Sw Sw Sw Sw Sw Sw Sw Sw Sw Sw Sw Sw Sw Sw Sw Sw Sw Sw Sw Sw UK UK UK UK UK UK UK UK UK UK UK UK UK UK UK UK UK UK UK UK UK UK UK UK UK US US US US US US US US US US US US US US US US US US US US US US US US US 0 .2 .4 .6 .8 M e an DF 0 .5 1 1.5 2 MeanEPL Low distance to frontier + high EPL OC ð positive impact on growth Low distance to frontier + low EPL OC ð negative impact on growth Figure 4 4.2 policy scenarios
In this Section I present simulations of GDP per employee’s growth, based on estimated regression coe¢ cients presented in Table 1 (column [1], FEVD procedure). Econometric results have provided some support to the idea that changes in ownership structure are likely to produce di¤erent results according to contexts, i.e. according to the prevailing level of labour market
regulation and to country distance with respect to the frontier. Hence,
simulations presented below aim to shade some light on the consequences, for all sample countries, of changes in selected variables, namely ownership concentration and employment regulation.
In particular, four policy scenarios are simulated. First, I run a simula-tion exploring a situasimula-tion where all countries would have selected levels of OC and EPL that are lower than actual ones by one standard deviation. The consequences of this change are shown in Figure 5. As one can see, this kind of reform would have bene…ted a few countries in the sample: the UK, the US, Ireland, Canada and Australia (plus Japan), i.e. primarily Anglo-Saxon low regulation countries. All other countries, and in particular European countries, take no advantage, and even experience lower growth, following such reform.
Second, I simulate the alternative situation where countries’policy choice would have been to implement levels of both OC and EPL that are higher than actual ones by one standard deviation. This change is shown to be potentially bene…cial for all countries except the US and the UK (see Figure 6 below). Hence, a progressive increase in regulation and ownership concen-tration appears as a more suitable policy choice for continental European countries, as compared to the alternative deregulation policy.
Finally, two more simulations are run to test the alternative scenarios where EPL and OC would be put equal to their maximum or minimum sample values. This exercise allows to tentatively evaluate the long-run implications of reforms aiming at radically changing labour regulation and ownership structure. The simulations show the "provocative" result that selecting the highest sample values for OC and EPL would have indeed always been the best growth-oriented policy for all sample countries (see Figure 7 below).
5
Conclusion
This paper has investigated the impact of ownership structure on GDP per employee growth from a macroeconomic point of view. Contrary to common wisdom, the theoretical arguments presented in the paper suggest that con-centrated ownership can in some cases favor growth. In fact, concon-centrated ownership tends to increase ownership stability thus fostering long term re-lationships with crucial stakeholders. In developed countries where (labour) markets are highly regulated, ownership stability can yield increased in-centives to undertake …rm-speci…c investments. These investments favor productivity growth in di¤erent sectors of the economy, and can be crucial
to achieve and/or maintain technological leadership.
The main contribution of the paper is empirical. I investigated the im-pact of ownership concentration on growth for a sample of 18 OECD coun-tries over the period 1980 to 2004. The econometric analysis shows that the e¤ects of ownership concentration indeed depend on contexts, i.e. on the regulatory environment and on the country distance to the frontier. In fact, more concentrated ownership can yield positive e¤ects on growth (in particular for leader countries) provided that labour market regulation is su¢ ciently tight. In the absence of employment regulation, the logic of …-nancial markets discipline applies and dispersed ownership appears as more favorable for growth.
Finally, the paper has provided some hints about the possible e¤ects of changes in ownership concentration and regulation. Based on economet-ric results, impact coe¢ cients have been presented allowing to evaluate the growth points gained/lost following a given change in ownership concen-tration. This exercise reveals that a reform in the domain of ownership structure can yield sizeable e¤ects in terms of growth. More important, these e¤ects are unequally distributed across countries: Anglo-Saxon coun-tries would take more advantage of deregulation (i.e. increased dispersion of ownership in a context of deregulated labour markets) while European countries would bene…t more from increased concentration of ownership in a context of reinforced regulation.
Simulation with OC and EPL equal to real values less 1sd (GDPgrowth_LOW_OC_EPL) -. 05 0 .05 -. 05 0 .05 -. 05 0 .05 -. 05 0 .05 1980 1985 1990 1995 2000 1980 1985 1990 1995 2000 1980 1985 1990 1995 2000 1980 1985 1990 1995 2000 1980 1985 1990 1995 2000
Australia Austria Belgium Canada Denmark
Finland France Germany Ireland Italy
Japan Netherlands Norway Portugal Spain
Sweden United Kingdom United States
GDPgrowth_LOW_OC_EPL
Linear prediction
time
Graphs by country
Simulation with OC and EPL equal to real values plus 1sd (GDPgrowth_HIGH_OC_EPL) 0 .05 .1 0 .05 .1 0 .05 .1 0 .05 .1 1980 1985 1990 1995 2000 1980 1985 1990 1995 2000 1980 1985 1990 1995 2000 1980 1985 1990 1995 2000 1980 1985 1990 1995 2000
Australia Austria Belgium Canada Denmark
Finland France Germany Ireland Italy
Japan Netherlands Norway Portugal Spain
Sweden United Kingdom United States
GDPgrowth_HIGH_OC_EPL
Linear prediction
time
Graphs by country
Simulations with OC and EPL equal to max and min sample values (GDP-growth_Max_OC_EPL and GDPgrowth_Min_OC_EPL)
-. 05 0 .05 .1 -. 05 0 .05 .1 -. 05 0 .05 .1 -. 05 0 .05 .1 1980 1985 1990 1995 2000 1980 1985 1990 1995 2000 1980 1985 1990 1995 2000 1980 1985 1990 1995 2000 1980 1985 1990 1995 2000
Australia Austria Belgium Canada Denmark
Finland France Germany Ireland Italy
Japan Netherlands Norway Portugal Spain
Sweden United Kingdom United States
GDPgrowth_Max_OC_EPL
GDPgrowth_Min_OC_EPL
Linear prediction
time
Graphs by country
6
Appendix
6.1 data and sources
Product markets regulation is measured through standard OECD indicators such as PMR and REGREFF: PMR is a global regulation indicators (only two observations are available), while REGREFF is a time-series indicator assessing the extent of regulation in key service sectors (such as gas, electric-ity, transports, etc.). OECD also provide a decomposition of PMR according to …elds of regulation: state intervention, barriers to …rms’ creation, trade barriers. The extent of state intervention is a potentially crucial variable in my analysis because it also captures an important aspect of companies’ ownership structure.
Macroeconomic control (such as real e¤ective exchange rate) are drawn from the OECD annual dataset. Education is measured as the proportion of enrolled students out of corresponding age-class population (OECD data). Population data, such as the share of the population aged 65 years and older (elderly population), are obtained from OECD.
In order to run instrumental variable technique, I rely on several political indicators from the Comparative Political Data Set (Armingeon et al. 2005): the Rae’s index of fractionalization of the political party system, the share of ’protest’votes (de…ned as the sum of votes for radical parties and absten-tion), a dummy for corporatist countries. Moreover, few data are obtained from M. Pagano’s online database (www.csef.it/people/pagano_data.htm), in particular dummy variables for proportional voting systems as well as for countries’legal origins (German, common and Scandinavian). Finally, I con-sider a annual indicator of left/right ideological positioning of governments elaborated and proposed by Amable, Gatti and Schumacher [2006].
6.2 marginal coe¢ cients
To assess the overall impact of EPL and OC, I calculate marginal e¤ects and their signi…cance conditional to …ve alternative values of the relevant vari-ables: minimum and maximum levels, mean value and mean plus/minus one standard deviation. Results are reported below separately for the marginal e¤ect of EPL and OC.
Table 2
Min distance Low distance Average distance High distance Max distance to frontier to frontier to frontier to frontier to frontier
Marginal effect of EPL
Min OC -0.045*** -0.042** -0.024* -0.006 0.040*** (0.017) (0.016) (0.013) (0.011) (0.015) Mean OC less 1sd -0.031** -0.028** -0.010 0.007 0.054*** (0.013) (0.012) (0.009) (0.008) (0.016) Mean OC -0.012 -0.009 0.009 0.026*** 0.073*** (0.008) (0.008) (0.006) (0.008) (0.020) Mean OC plus 1sd 0.007 0.011 0.028*** 0.046*** 0.092*** (0.008) (0.008) (0.009) (0.013) (0.025) Max OC 0.017* 0.020** 0.038*** 0.055*** 0.102*** (0.009) (0.010) (0.012) (0.016) (0.027) Note: Standard errors in parentheses
* p<0.10, ** p<0.05, *** p<0.01
Marginal effect of OC
Min EPL -0.031*** -0.044*** -0.107** -0.170** -0.338** (0.010) (0.014) (0.045) (0.078) (0.167) Mean EPL less 1sd 0.042 0.030 -0.033 -0.097 -0.264
(0.032) (0.033) (0.052) (0.081) (0.166) Mean EPL 0.128** 0.115* 0.052 -0.011 -0.179
(0.061) (0.061) (0.071) (0.093) (0.171) Mean EPL plus 1sd 0.213** 0.200** 0.137 0.074 -0.093
(0.090) (0.090) (0.096) (0.112) (0.180) Max EPL 0.267** 0.255** 0.191* 0.128 -0.039
(0.109) (0.109) (0.113) (0.126) (0.188) Note: Standard errors in parentheses
References
[1] Acemoglu, Daron, Philippe Aghion and Fabrizio Zilibotti (2007) “Dis-tance to Frontier, Selection and Economic Growth”, Journal of the European Economic Association.
[2] Aghion P. (2003) Empirical estimates of the relationship between prod-uct market competition and innovation. In J.P. Tou¤ut (ed.) Institu-tions, Innovation and Growth, Selected Economic Papers, pp. 142-169. Cheltenham: Edward Elgar.
[3] Aghion, P. (2006) A Primer on Innovation and Growth. BRUEGEL Policy Brief Issue 2006/06.
[4] Aghion P., N. Bloom, R. Blundell, R. Gri¢ th and P. Howitt (2005) "Competition and Innovation: An Inverted U Relationship" Quarterly Journal of Economics, May 2005a, pp. 701-728.
[5] Aghion, P. and Howitt, P. (1992). A Model of Growth Through Creative Destruction. Econometrica, 60(2), 323 –351.
[6] Aguilera, R.V. & G. Jackson (2003): The Cross-National Diversity of Corporate Governance: Dimensions and Determinants. Academy of Management Review, 28: 447-465
[7] Amable B., L. Demmou and D. Gatti [2007] Employment Performance and Institutions: New Answers to an Old Question. IZA Discussion Paper No. 2731.
[8] Amable B., L. Demmou and I. Ledezma [2007] Competition, Innovation and Distance to frontier. mimeo, CEPREMAP.
[9] Amable B. and D. Gatti [2004] The Political Economy of Job Protection and Income Redistribution IZA Discussion Paper No. 1404.
[10] Amable B., D. Gatti and J. Schumacher (2006) Welfare state retrench-ment: the partisan e¤ect revisited, Oxford Review of Economic Policy, 22:3, autumn
[11] Amable B. and B. Hancké (2001) Innovation and Industrial Renewal in France in Comparative Perspective. Industry and Innovation 8(2), 113-133.
[12] Armingeon, Klaus, Philipp Leimgruber, Michelle Beyeler and Sarah Menegale (2005). Comparative Political Data Set 1960-2003, Institute of Political Science, University of Berne.
[13] Barker R. and David Rueda [2007] The Labor Market Determinants of Corporate Governance Reform, CLPE Research Paper 5/2007, Vol. 03 No. 03.
[14] Becht, Marco and Colin Mayer (2001), “Corporate Control in Europe”, in The World’s New Financial Landscape : Challenges for Economic Policy, Mohr-Siebeck, Tübingen.
[15] Blair M. [2003] Shareholder Value, Corporate Governance, and Corpo-rate Performance in Peter K. Cornelius and Bruce Kogut, eds., Cor-porate Governance and Capital Flows in a Global Economy (Oxford University Press, 2003, 53-82)
[16] Braumoeller, Bear F. 2004. "Hypothesis Testing and Multiplicative In-teraction Terms". International Organization, Vol. 58, No. 4, pp. 807-820.
[17] Conway P., V. Janod and G. Nicoletti (2005), "Product Market Regula-tion in OECD Countries, 1998 to 2003". OECD Economics Department Working Paper, No 419
[18] Conway, P. and G. Nicoletti 2006. " Product Market regulation in the Non-Manufacturing Sector of OECD Countries: Measurements and Highlights". OECD Economics Department Working Paper No. 530. [19] Conway P., D. de Rosa, G. Nicoletti and F. Steiner (2006) "Regulation,
Competition, and Productivity Convergence. Economics Department Working Papers No. 509, Paris: OECD.
[20] Cusack T., Iversen T. and D. Soskice “ Economic Interests and the Origins of Electoral Systems.” American Political Science Review 101, August 2007
[21] Djankov S., La Porta R., Florencio López-de-Silane and Andrei Shleifer [2006] The Law and Economics of Self-Dealing", Journal of Financial Economics, November.
[22] Deakin, S., Hobbs, R., Konzelmann, S. and Wilkinson, F. (2002) ’Part-nership, ownership and control: the impact of corporate governance on employment relations’, Employee Relations, 24(3): 335-352.
[23] Faccio, Mara and Larry H.P. Lang. 2002. “The Ultimate Ownership in Western European Corporations,” Journal of Financial Economics 65:3, pp. 365-395.
[24] Friedrich, Robert J. 1982. "In defence of multiplicative terms in multiple regression equations", American Journal of Political Science, Vol. 26, No.4, pp. 797-833.
[25] Gatti D. [2000] Unemployment and Innovation Patterns: the critical role of coordination, Industrial and Corporate Change, 9:3
[26] Gatti D. and A. Glyn (Eds.) [2006] Fiscal Restraint and the Welfare State, numéro spécial de la Oxford Review of Economic Policy, 22:3, autumn, Oxford University Press, Oxford
[27] Gatti D. and A. Glyn (2006) Welfare States in Hard Times, Oxford Review of Economic Policy, 22:3, autumn
[28] Geroski, P. (1995) Market Structure, Corporate Performance and In-novative Activity, Oxford: Oxford University Press
[29] Gugler K., Dennis C. Mueller, and B. Burcin Yurtoglu [2004], Corporate Governance and Globalization, Oxf Rev Econ Policy 2004 20: 129-156 [30] Kho Bong-Chan, René M. Stulz, Francis E. Warnock [2006] Financial Globalization, Governance, and the Evolution of the Home Bias, NBER Working Paper No. 12389
[31] La Porta, R., F. Lopez-De-Silanes, and A. Shleifer. (1999). "Corporate Ownership Around the World." Journal of Finance 54 (2):471-518. [32] La Porta, Rafael , Florencio Lopez-de-Silanes, Andrei Shleifer, and
Robert W. Vishny. (1998). "Law and Finance." Journal of Political Economy 106 (4):1113-55.
[33] Morck, Wolfenzon and Yeung [2005] Corporate Governance, Economic Entrenchment, and Growth, Journal of Economic Literature, Vol. 43, No. 3, September.
[34] Nicoletti, G. and S. Scarpetta (2003), “Regulation, Productivity and Growth: OECD Evidence”, Economic Policy, No. 36, pp. 9-72, April. [35] Pagano, M., and P. F. Volpin. 2005. "The Political Economy of
Corpo-rate Governance." American Economic Review 95:1005-30.
[36] Persson T., Gerard Roland and Guido Tabellini (2007) "Electoral Rules and Government Spending in Parliamentary Democracies", Quarterly Journal of Political Science: Vol. 2:No 2, pp 155-188.
[37] Plümper Thomas and Vera Tröger 2007. "E¢ cient Estimation of Time Invariant and Rarely Changing Variables in Panel Data Analysis with Unit E¤ects", Political Analysis, Vol. 15, No. 2, pp. 124-139.
[38] Rebérioux A. (2002) European Style of Corporate Governance at the Crossroads: the Role of Worker Involvement, Journal of Common Mar-ket Studies, vol. 40, n 1, pp. 111-134.
[39] Scruggs, Lyle 2004. Welfare State Entitlements Data Set: A Compara-tive Institutional Analysis of Eighteen Welfare States, Version 1.0. [40] Shleifer, Andrei, and Robert Vishny. 1997. “A survey of Corporate