HAL Id: hal-00297042
https://hal.archives-ouvertes.fr/hal-00297042
Submitted on 2 Jan 2008
HAL is a multi-disciplinary open access
archive for the deposit and dissemination of
sci-entific research documents, whether they are
pub-lished or not. The documents may come from
teaching and research institutions in France or
abroad, or from public or private research centers.
L’archive ouverte pluridisciplinaire HAL, est
destinée au dépôt et à la diffusion de documents
scientifiques de niveau recherche, publiés ou non,
émanant des établissements d’enseignement et de
recherche français ou étrangers, des laboratoires
publics ou privés.
Satellite-based detection of volcanic sulphur dioxide
from recent eruptions in Central and South America
D. Loyola, J. van Geffen, P. Valks, T. Erbertseder, M. van Roozendael, W.
Thomas, W. Zimmer, K. Wißkirchen
To cite this version:
D. Loyola, J. van Geffen, P. Valks, T. Erbertseder, M. van Roozendael, et al.. Satellite-based
detec-tion of volcanic sulphur dioxide from recent erupdetec-tions in Central and South America. Advances in
Geosciences, European Geosciences Union, 2008, 14, pp.35-40. �hal-00297042�
www.adv-geosci.net/14/35/2008/ © Author(s) 2008. This work is licensed under a Creative Commons License.
Geosciences
Satellite-based detection of volcanic sulphur dioxide from recent
eruptions in Central and South America
D. Loyola1, J. van Geffen2, P. Valks1, T. Erbertseder3, M. Van Roozendael2, W. Thomas4, W. Zimmer1, and K. Wißkirchen3
1German Aerospace Center (DLR), Remote Sensing Technology Institute (IMF), 82234 Wessling, Germany 2Belgian Institute for Space Aeronomy, Av. Circulaire 3, 1180 Brussels, Belgium
3German Aerospace Center (DLR), German Remote Sensing Data Center (DFD), 82234 Wessling, Germany 4Deutscher Wetterdienst (DWD), P.O. Box 10 04 65, 63004 Offenbach, Germany
Received: 15 June 2007 – Revised: 12 October 2007 – Accepted: 13 October 2007 – Published: 2 January 2008
Abstract. Volcanic eruptions can emit large amounts of rock
fragments and fine particles (ash) into the atmosphere, as well as several gases, including sulphur dioxide (SO2). These
ejecta and emissions are a major natural hazard, not only to the local population, but also to the infrastructure in the vicinity of volcanoes and to aviation. Here, we describe a methodology to retrieve quantitative information about vol-canic SO2plumes from satellite-borne measurements in the
UV/Visible spectral range. The combination of a satellite-based SO2detection scheme and a state-of-the-art 3D
trajec-tory model enables us to confirm the volcanic origin of trace gas signals and to estimate the plume height and the effective emission height. This is demonstrated by case-studies for four selected volcanic eruptions in South and Central Amer-ica, using the GOME, SCIAMACHY and GOME-2 instru-ments.
1 Introduction
Volcanic eruptions and outgassing are the most important natural sources of SO2(Graf et al., 1997). Most volcanic SO2
emissions and aerosols remain in the troposphere. There, the lifetime of SO2 depends strongly on meteorological
condi-tions but it is typically in the order of a few days. In the troposphere, the major sink of SO2is its transformation into
sulphate aerosol and sulphuric acid, the latter being responsi-ble for the “acid rain” phenomenon. Since SO2is also toxic it
has to be considered a possible hazard to human health (e.g. EPA, 2007).
Correspondence to: D. Loyola
(diego.loyola@dlr.de)
Severe volcanic eruptions, such as those of El Chi-chon (1982) and Pinatubo (1991), can bring a considerable amount of sulphur dioxide and particles into the stratosphere. Here, the SO2is mainly transformed into sulphuric droplets
(aerosols). These aerosol droplets may persist for weeks in the stratosphere and may be transported on intercontinental scales (Read et al., 1993). Sulphate aerosol has a cooling ef-fect on the atmosphere and leads to enhanced rates of ozone loss in the lower stratosphere, as it was observed after the Pinatubo eruption (Self et al., 1996).
Satellite remote sensing of volcanic SO2provides a unique
global and systematic way of detecting and tracking volcanic gas plumes and their evolution in near-real time, thus deliver-ing additional information to authorities to take appropriate actions. The new generation of atmospheric remote sensing sensors allows the accurate detection of volcanic SO2plumes
and ash clouds. Especially the latter are also a hazard to avi-ation: the ash can limit the view of aircraft pilots and it can melt inside the engines, as a result of which the engines may fail. Since SO2is also dissolved in water droplets and forms
corrosive sulphuric acid, it can create sulphate deposits in the engines (van Geffen et al., 2007).
The main focus of this paper is the retrieval of SO2
us-ing satellite measurements in the UV spectral range from the Global Ozone Monitoring Experiment (GOME) (Bur-rows et al., 1999) on-board ERS-2 and the Scanning Imag-ing Absorption Spectrometer for Atmospheric CHartogra-phY (SCIAMACHY) (Bovensmann et al., 1998; Gottwald et al., 2006) on-board ENVISAT. We focus on major eruptions of four volcanoes in South and Central America during the last decade. Finally, the perspectives for global SO2
mon-itoring using GOME-2 data on-board MetOp and the issues related to the near-real time retrieval and delivery of SO2data
36 D. Loyola et al.: Satellite-based detection of volcanic sulphur dioxide
Cloud Top Height [km] GOME / ERS-2
Cloud Top Height (ROCINN) Mexico Dec 15, 2000 0 2 4 6 8 10 110˚W 105˚W 100˚W 95˚W 90˚W 15˚N 20˚N 25˚N 30˚N
Mexico City Popocatepetl
Cloud Fraction GOME / ERS-2
Cloud Fraction (OCRA) Mexico
Dec 15, 2000 0.0 0.2 0.4 0.6 0.8 1.0 110˚W 105˚W 100˚W 95˚W 90˚W 15˚N 20˚N 25˚N 30˚N
Mexico City Popocatepetl
SO2 [Dobson Units] GOME / ERS-2
Sulphur Dioxide Vertical Column Density Mexico Dec 15, 2000 0 1 2 3 110˚W 105˚W 100˚W 95˚W 90˚W 15˚N 20˚N 25˚N 30˚N
Mexico City Popocatepetl
SO2 [Dobson Units] 0 1 2 3 110˚W 105˚W 100˚W 95˚W 90˚W 15˚N 20˚N 25˚N 30˚N
Mexico City Popocatepetl 5
6 7
Trajectory numbers indicate height in km
GOME / ERS-2
Sulphur Dioxide Vertical Column Density Mexico Dec 13, 2000
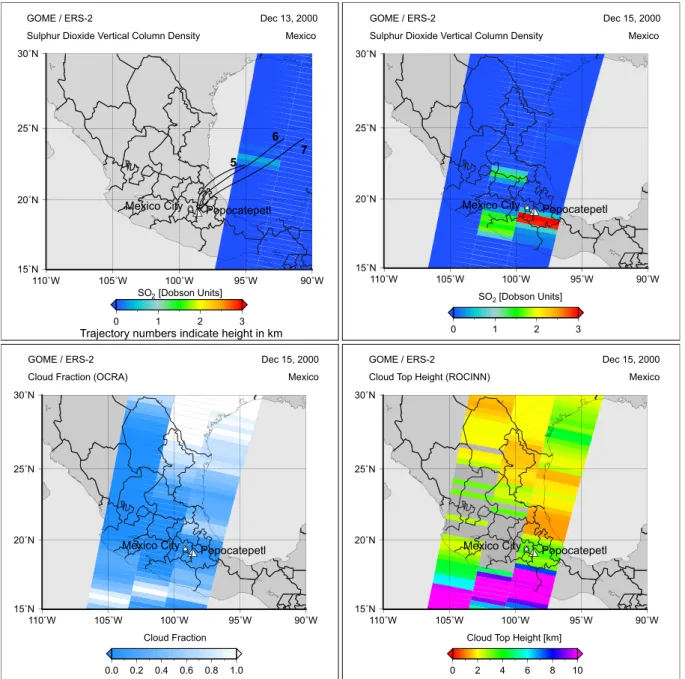
Fig. 1. SO2vertical column densities as retrieved from GOME for 13 December 2000 (top-left). Representing a coherent ensemble of
matching forward trajectories, three trajectories are plotted released at the Popocatepetl at altitudes from 5 to 7 km and durations of 24 h. The other panels show SO2vertical column densities, cloud fraction and cloud top height on 15 December 2000.
2 SO2column retrieval
The SO2 column along slant absorption paths is retrieved
from the UV backscatter spectra by GOME and SCIA-MACHY, applying the well-established Differential Optical Absorption Spectroscopy (DOAS) approach (Platt, 1994). The non-linear least square fit is performed in the 315– 326 nm wavelength range and provides the SO2 slant
col-umn (Eisinger et al., 1998). Absorption cross-sections of sulphur dioxide, ozone, nitrogen dioxide and a correction for the Ring effect (rotational Raman scattering) are fitted
simultaneously. Furthermore, a SO2 background correction
is applied to account for systematic artefacts introduced by the interference between ozone and SO2in the given spectral
window.
In the next step, the SO2 slant columns are converted to
geometrically independent vertical column amounts through division mass factors (AMF). The AMFs are calculated with the radiative transfer model LIDORT (LInearized Discrete Ordinate Radiative Transfer model) (Spurr et al., 2001) and depend on the viewing geometry, the reflection properties of the underlying surface, the SO2plume height, and the
0 2 4 6 8 10 14 16 18 20 22 H ei gh t(k m ) -90 -85 -80 -75 -70 -65 Longitude 12 SO2 [Dobson Units] GOME / ERS-2
Sulphur Dioxide Vertical Column Density Ecuador Nov 02, 2002 0 1 2 3 90˚W 80˚W 70˚W 10˚S 5˚S 0˚ 5˚N 10˚N El Reventador Quito 20 18 12 14 10 8 4 6 16
Trajectory numbers indicate height in km
SO2 [Dobson Units] GOME / ERS-2
Sulphur Dioxide Vertical Column Density Ecuador Nov 03, 2002 0 1 2 3 90˚W 80˚W 70˚W 10˚S 5˚S 0˚ 5˚N 10˚N El Reventador Quito 16 20 18 14 1210 8 6 4
Trajectory numbers indicate height in km
SO2 [Dobson Units] GOME / ERS-2
Sulphur Dioxide Vertical Column Density Ecuador Nov 05, 2002 0 1 2 3 90˚W 80˚W 70˚W 10˚S 5˚S 0˚ 5˚N 10˚N El Reventador Quito 20 18 16 14 12 10 8 6 4
Trajectory numbers indicate height in km
El Reventador
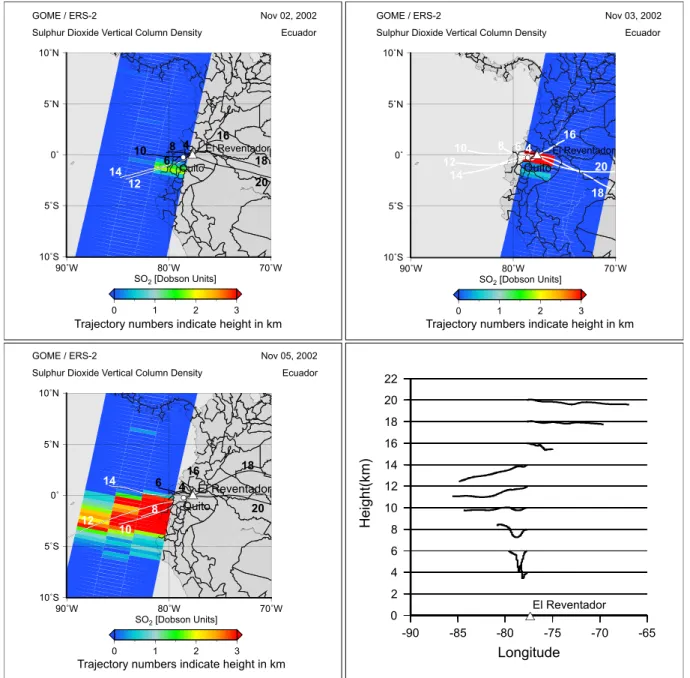
Fig. 2. SO2vertical column densities of the eruption of El Reventador, Ecuador for 2, 3 and 5 November 2002, as measured by GOME.
Trajectories were released from 4 km to 20 km in steps of 2 km using durations of 24 h. The trajectories matching the plume are coloured in white. Bottom-right: Longitudinal crosssection of the forward trajectories released for the El Reventador eruption at 3 November 2002. Trajectories were released at 06:00 UTC from 4 to 20 km above sea level in steps of 2 km using durations of 24 h. The vertical wind shear between 14 km and 16 km can be well recognized.
ence and optical properties of clouds and aerosols (Thomas et al., 2005).
3 Trajectory analysis
In order to attribute increased SO2 values as found in
satellite-based observations to a particular volcano or an ac-tive volcanic region, we apply the trajectory matching
tech-nique (Thomas et al., 2005). By means of calculating en-sembles of backward trajectories starting from enhanced SO2
column observations, the volcanic origin of such SO2plumes
can be identified or rejected. In the latter case the emission can be attributed e.g., to anthropogenic processes or other natural sources. The quantitative retrieval of SO2 column
densities strongly depends on the SO2plume height, i.e. the
sulphur dioxide profile. We determine the unknown plume height and the emission height of SO2at a volcano using the
38 D. Loyola et al.: Satellite-based detection of volcanic sulphur dioxide
SO2 [Dobson Units]
GOME-2 / MetOp
Sulphur Dioxide Vertical Column Density Ecuador
May 07, 2007 0 1 2 3 90˚W 80˚W 70˚W 10˚S 5˚S 0˚ 5˚N 10˚N Quito El Reventador
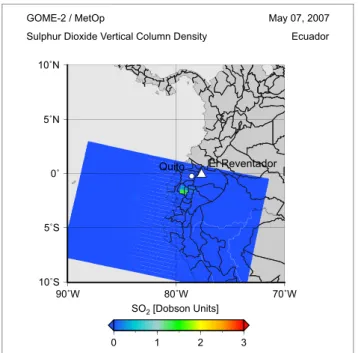
Fig. 3. SO2vertical column densities derived from GOME-2 for the eruption of El Reventador/Ecuador for 7 May 2007. Backward trajectories calculated for this case indicate an emission height of 6 km.
3-D trajectory model FLEXTRA (Stohl et al., 1999). This model is driven by meteorological analyses of the European Centre for Medium Range Weather Forecast (ECMWF). En-sembles of backward trajectories were released at different pressure levels from 2 km to 20 km at the geolocation of satellite-based observations with elevated SO2columns. This
allows confirming the volcanic origin of the SO2,
determin-ing the effective emission height over the volcano and reveal-ing the spatial and temporal evolution of the SO2plume. In
order to reconfirm an estimated volcanic source, ensembles of 3-D forward trajectories were released at volcanoes (see Sect. 4) at different levels ranging from 2 km to 20 km above mean sea level (AMSL). By matching the parcel trajectories with the first guess satellite-based SO2retrievals the height of
the SO2plume is determined. The accuracy of the combined
retrieval and trajectory matching approach was evaluated in Thomas et al. (2005) using ground-based measurements of SO2and aerosols.
4 Case studies
This section presents the SO2 and trajectory analysis for
selected eruptions of four volcanoes in South and Central America. We used observations from the GOME and SCIA-MACHY sensors, as well as data from the recently launched GOME-2 instrument. Important differences between the in-struments are the spatial resolution and the temporal cover-age. The spatial resolution for GOME is 320×40 km2,
pro-viding global coverage within 3 days, SCIAMACHY has a spatial resolution of 60×30 km2 and global coverage is reached within 6 days only. The new GOME-2 instrument offers nearly global coverage within one day at a spatial res-olution of about 80×40 km2.
4.1 Popocatepetl, 12–15 December 2000
Popocatepetl (19◦1′N, 98◦37′W), located 70 km south-east
from Mexico City, erupted from 12–15 December 2000. Popocatepetl is one of the most active volcanoes in Mex-ico. The SO2 vertical column densities as retrieved from
GOME for 13 December 2000 are shown in Fig. 1. The en-hanced SO2 values over the Gulf of Mexico were the first
signal detected for this eruptive period and hence they were used to determine the origin of the SO2 and the effective
emission height. The trajectory analysis revealed an effec-tive emission height at the Popocatepetl between 5 km and 7 km, which is around its summit height of 5462 m. The three trajectories overlaid in Fig. 1 indicate the main path of the SO2 plume and are a subset of a coherent
ensem-ble of matching forward trajectories (not shown here). They were released at 00:00 UTC at the geolocation of Popocate-petl and represent a travel time of 24 h at altitudes from 5 km and 7 km. The retrieved SO2vertical column densities, the
cloud fraction and the cloud top height for 15 December 2000 are also depicted in Fig. 1. The low cloud fraction above the volcano provided good observation conditions. On this day, maximum SO2 column densities of ∼7 Dobson Units
were detected with GOME southwards from the volcano (1 DU=2.69×10¹⁶molec/cm2).
4.2 El Reventador, 2–5 November 2002 and 7 May 2007 El Reventador (0◦4′S, 77◦39′W) is located 90 km north-east
from Quito/Ecuador and erupted from 2-5 November 2002. Due to a strong wind shear between 14 km and 16 km alti-tude, the plume split in two, one part moving east and reach-ing 20 km height, and the other part movreach-ing south-west and reaching 14 km height. The GOME-based SO2vertical
col-umn densities of this eruptive period are presented in Fig. 2 for 2, 3 and 5 November 2002. The trajectory analysis re-vealed an effective emission height at the Reventador tween 4 km and 14 km in south-westerly direction and be-tween 14 km to 20 km in easterly direction. This is corrob-orated by airplane observations (VAAC Washington, 2002). The trajectories depicted in Fig. 2 confirm the observed trans-port of the SO2plume. They were released at 15:00 UTC at
the Reventador (06:00 UTC for 3 November 2002) and rep-resent a travel time of 24 h at altitudes ranging from 4 km to 20 km. Trajectories matching the plume are coloured in white while others are black. For 2 November 2002 the matching trajectories can be associated with heights between 12 km and 14 km, respectively. At 3 November 2002 all released trajectories cover the SO2plume and at 5
SO2 [Dobson Units]
SCIAMACHY / ENVISAT
Sulphur Dioxide Vertical Column Density Galapagos Islands
Oct 23, 2005 0 1 2 3 100˚W 90˚W 80˚W 15˚S 10˚S 5˚S 0˚ 5˚N 10˚N 15˚N
Sierra Negra Quito
SO2 [Dobson Units]
SCIAMACHY / ENVISAT
Sulphur Dioxide Vertical Column Density Galapagos Islands
Oct 24, 2005 0 1 2 3 100˚W 90˚W 80˚W 15˚S 10˚S 5˚S 0˚ 5˚N 10˚N 15˚N
Sierra Negra Quito
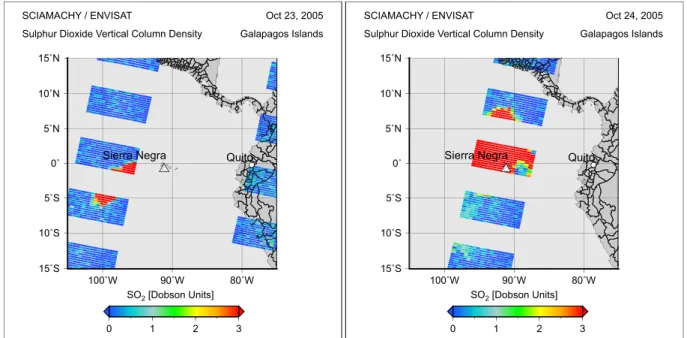
Fig. 4. SO2vertical column densities retrieved from SCIAMACHY for the eruption of Sierra Negra on the Galapagos Island for 23 and 24
October 2005.
ber 2002 the trajectories from levels between 8 km to 14 km match the SO2plume. Maximum SO2columns of ∼10 DU
were measured with GOME on 3 November 2002, close to the volcano.
More recent eruptions of the El Reventador took place dur-ing March and May 2007 and were observed by GOME-2. Backward trajectories calculated for the eruption on 7 May 2007 revealed an emission height of 6 km. Figure 3 shows the SO2vertical columns derived from preliminary
GOME-2 data for 7 May GOME-2007. A relatively small SO2 amount of
∼1.7 DU was measured for the plume south-westerly of the volcano. Figure 3 shows also the smaller GOME-2 ground-pixels and the larger swath-width of the GOME-2 instrument compared to GOME.
4.3 Sierra Negra, 23–24 October 2005
The Sierra Negra volcano (0◦49′S, 91◦10′W), located on the
Isla Isabela of the Galapagos archipelago (Ecuador), erupted on 23 October 2005. The eruption produced a large amount of volcanic smog (vog), which is typically a mixture of SO2,
oxygen, water, and aerosols. The vog spread over several hundred square-kilometres of the Pacific Ocean. Figure 4 shows the SO2vertical column densities for 23 and 24
Octo-ber 2005 retrieved from SCIAMACHY observations. Back-ward trajectories calculated for 23 October 2005 indicate a plume height of 12 km. While the moving direction of the plume on 23 October 2007 was to west-southwest direction, we could not find a preferred direction for the 24 October 2007. We therefore found elevated SO2values in nearly the
whole region around Sierra Negra. On 24 October 2007, very
large SO2 column densities of more than 60 Dobson Units
were detected with SCIAMACHY, close to the volcano.
5 Conclusions
We have shown the unique possibilities of satellite remote sensing in detecting and tracking volcanic SO2plumes. The
GOME (ERS-2), SCIAMACHY (ENVISAT) and GOME-2 (MetOp) satellite instruments allow retrieving atmospheric SO2column densities on a global scale and in near-real time.
By combining the satellite-based SO2retrieval with
state-of-art 3-D trajectory models, the volcanic origin can be con-firmed, and the plume and effective emission heights can be estimated. The maximum SO2column densities of the four
eruptions analysed in this study, range from ∼1.7 Dobson Units for the El Reventador eruption in May 2007, to more than 60 DU for the Sierra Negra eruption in October 2005.
Volcanic eruptions are a major hazard to aviation, and the only safe solution for aircrafts is to avoid flying through such volcanic clouds. The Volcanic Ash Advisory Centres (VAACs) have been set up by the International Civil Avia-tion OrganisaAvia-tion (ICAO) to gather informaAvia-tion on volcanic activity and to issue alerts on the possible danger of volcanic eruptions to aviation. To assist the VAACs in their task, the Support to Aviation Control Service (SACS) of the PRO-MOTE project intends to deliver in near-real-time SO2data
and, in the event of high SO2concentrations, notifications by
email to the VAACs and other interested parties (van Gef-fen et al., 2007). The SO2 data of SACS can be accessed
40 D. Loyola et al.: Satellite-based detection of volcanic sulphur dioxide via http://sacs.aeronomie.be/ or via the PROMOTE website
http://www.gse-promote.org/ under “Special Services”. Acknowledgements. GOME and SCIAMACHY level 1 data were provided by ESA, GOME-2 level 1 data was provided by EUMETSAT. We thank A. Stohl for providing the FLEXTRA model and ECMWF for the access to the meteorological analy-ses. We are grateful to the two referees for their valuable comments. Edited by: P. Fabian
Reviewed by: two anonymous referees
References
Bovensmann, H., Burrows, J. P., Buchwitz, M., Frerick, J., Noel, S., Rozanov, V. V, Chance, K. V., and Goede, A. P. H.: SCIA-MACHY: Mission Objectives and Measurement Modes, J. At-mos. Sci., 56, 127–150, 1999.
Burrows, J. P., Weber, M., Buchwitz, M., Rozanov, V., Ladstaetter-Weissenmayer, A., Richter, A., de Beek, R., Hoogen, R., Bram-stedt, K., Eichmann, K.-U., Eisinger, M., and Perner, D.: The Global Ozone Monitoring Experiment (GOME): Mission con-cept and first scientific results, J. Atmos. Sci., 56, 151–175, 1999. Eisinger, M. and Burrows, J. P.: Tropospheric Sulphur Dioxide ob-served by the ERS-2 GOME Instrument, Geophys. Res. Lett., 25, 4177–4180, 1998.
EPA (Environmental Protection Agency of the United States): Health and Environmental Impacts of SO2, http://www.epa.gov/ air/urbanair/so2/index.html, 2007
van Geffen, J., Van Roozendael, M. , Di Nicolantonio, W., Tam-pellini, L., Valks, P., Erbertseder, T., and van der A, R., Mon-itoring of volcanic activity from satellite as part of GSE PRO-MOTE, Proceedings of the ENVISAT Symposium, 23–27 April 2007, Montreux, Switzerland, ESA publication SP-636, 2007. Gottwald, M., Bovensmann, H., Lichtenberg, G., Noel, S., von
Bar-gen, A., Slijkhuis, S., Piters, A., Hoogeveen, R., von Savigny, C., Buchwitz, M., Kokhanovsky, A., Richter, A., Rozanov, A., Holzer-Popp, T., Bramstedt, K., Lambert, J.-C., Skupin, J., Wit-trock, F., Schrijver, H., and Burrows, J. P.: SCIAMACHY, Mon-itoring the Changing Earth’s Atmosphere, published by DLR, 2006.
Graf, H.-F., Feichter, J., and Langmann, B.: Volcanic sulfur emis-sions: Estimates of source strength and its contribution to the global sulfate distribution, J. Geophys. Res., 102, 10 727–10 738, 1997.
Platt, U.: Differential optical absorption spectroscopy (DOAS), Air Monitoring by Spectroscopic Techniques, edited by: Siegrist, M., Chemical Analysis Series, 127, 1994.
Read, W. G., Froidevaux, L., and Waters, J. W.: Microwave Limb Sounder (MLS) measurements of SO2from Mt. Pinatubo
vol-cano, Geophys. Res. Lett. 20, 1299–1302, 1993.
Self, S., Zhao, J.-X., Holasek, R. E., Torres, R. C., and King, A. J.: The atmospheric impact of the 1991 Mount Pinatubo erup-tion, in: Fire and Mud: Eruptions and lahars of Mount Pinatubo, edited by: Newhall, C. G. and Punongbayan, R. S., Philip-pines Philippine Institute of Volcanology and Seismology, Que-zon City, and University of Washington Press, Seattle and Lon-don, 1996.
Spurr, R. J. D., Kurosu T. P., and Chance K. V.: A linearized discrete ordinate radiative transfer model for atmospheric remote sensing retrieval, J. Quant. Spec. Radiat. Transfer, 68, 689–735, 2001. Stohl, A., Haimberger, L., Scheele, M., and Wernli, H.: An
inter-comparison of results from three trajectory models, Meteorol. Appl., 8, 127–135, 1999.
Thomas, W., Erbertseder, T., Ruppert, T., van Roozendael, M., Verdebout, J., Meleti, C., Balis, D., and Zerefos, C.: On the retrieval of Volcanic Sulfur Dioxide Emissions from GOME backscatter measurements, J. Atmos. Chem., 50, 295–320, doi:10.1007/s10874-005-5079-5, 2005.
VAAC Washington (Volcanic Ash Advisory Center) VOL-CANIC ASH ADVISORY FVXX21 KWBC 040000, issued: 002NOV04/0000Z, http://www.ssd.noaa.gov/VAAC/ARCH02/ REVE/2002K040000.html, 2002.