H. C. Probst
D. A. Oliver
IN TURBOMACHINERY
H. C. Probst D. A. OliverGTL Report No. 111
August 1972
This research carried out in the Gas Turbine
Laboratory, M.I.T., supported by the NASA Lewis
Research Center under Grant NGL 22-009-383.
INTRODUCTION
As part of a general development of computational techniques for multi-dimensional flows through turbomachine passages and over turbomachine blading at the M.I.T. Gas Turbine Laboratory, display techniques and programs have been developed for the visualization and interpretation of the computed flows.
These display programs have been developed for the Adage AGT-30 system implemented at the Electronic Systems Laboratory at M.I.T. In the present report two major programs are described and illustrated. These are programs for the display of the turbomachine blading and flow passage geometry and for the display of contours of any scalar fluid variable in the flow passage.
The manner in which the system is used is as follows. The turbomachine blading and flow passage geometrical data exist on an Adage tape. The output of the fluid dynamic calculation which is presently done on the OS/370 system is connected on OS/370 to an Adage compatible tape. This tape which represents the computed flow is then viewed on the Adage system.
1.
Turbomachine Blade Display (2BLDS)This program enables the operator to graphically display from 1 blade to all 23 blades of the axial flow compressor in the Gas Turbine Laboratory blowdown facility.* The display is of the blades and hub. The system can
read from tape and display up to three additional images along with the blades. The images read from the tape may be of any form provided they are in standard display format. In general, the images will be contour lines or vector lines associated with
1
blade or section of a blade, and therefore will be repeated with each blade displayed.At present the 2BLDS uses six control dials for operator interaction with the display. Three dials control the blade orientation along the three
fixed axes of the CRT, one controls the picture size, one controls the blade position along the X axis, and the sixth enables the operator to black out
certain portions of the display for improved viewing.
A variety of subroutines within 2 BLDS allow the operator to add or remove the images read from the tape containing the blading and flow passage geometry. Included in this flexibility is removal of longitudinal or spanwise grid lines from the blade images.
2. Contour Display Program (AGTCON)
This is a FORTRAN routine for use on the IBM 370 for developing two-dimensional contours in either two- or three-two-dimensional space and writing the contour coordinates on a 7 track tape for use with the DODGE Graphers Terminal. If contours are in two-dimensional space, labels are written with the data and keys inserted. In three-dimensional space labels are generated, but the positions relative to the third axis are calculated from the array
* Kerrebrock, J. L., "The M.I.T. Blowdown Compressor Facility," Gas Turbine
Lab Rep. 108, M.I.T., May 1972.
and output along with the contours.
AGTCON has several useful options.
It can produce Stromberg Carlson
plots as the output to the tape, it can print out the coordinates on the line
printer for reference, and it can accept either Cartesian or polar coordinate
systems for the plane in which contours are generated.
The values along the
third axis are associated with the data points and therefore independent of
the coordinate system in the contouring plane.
3.
Planar Display Program
(DSP2D)
This program is an Adage program to read two-dimensional display images
from tape (such as fluid variable contours) and display them on the CRT.
Provision for numerical labeling of the images is included.
4.
A Gallery of Display Results
A sampling of display results utilizing the Display Programs AGTCON,
2BLDS, and DSP2D shown in Figs.l(a)through 6
.These displays illustrate the
variety of three-dimensional visualization which the system allows.
APPENDIX I
DOCUMENTATION OF PROGRAMS
(RDTP7) Program to Read and Convert the IBM Tapes to Adage Format
The program RDTP7 is used for reading a 7 track tape written on an IBM machine and converting it to ADAGE word lengths and code, the significant differences being that IBM machines use 8 bit bytes with variable word lengths,
along with 2's compliment arithmetic, while ADAGE uses fixed word lengths of 30 bits and l's compliment arithmetic.
The program permits the operator to specify whether the IBM tape being read has two- or three-dimensional data, how many files are on the input tape, and the title of the output tape. The program tests for certain data keys to determine if the next word of data is actual data or a key word used to indicate that a label is next or that the CRT beam should be blanked when moving to the next data point, a move rather than a draw.
The program RDTP7 is loaded into core by typing RESET("RDTP7", unit
#)!
on the teletype and is executed by typing RDTP7! The program then outputs instructions to the operator on how to continue. The operator specifies which and how many IBM files are to be converted and stored on ADAGE format tapes, whether the files are two or three dimensional, the name to be assigned to thefile output, and how many digits are to be displayed on the labels in the case of a two dimensional file.
Once this information has been input, the program locates the data on the IBM tape, reads it, converts it to 15 bit ADAGE halfwords from IBM 8 bit bytes, packs the data into the two or three dimensional display format, and writes
the data on a second tape in ADAGE Display Format.
Each IBM file is stored
as an individual record on
the ADAGE tape.
All records which are related and
converted during the same execution of the program are combined into one
ADAGE file.
The program uses integer binary codes to signal whether lines should be
drawn or moved, and whether a label is included in two dimensional cases.
The IBM program generating the data tape must supply these codes as needed.
The data written by the IBM program should be 2 byte integer data which has been
scaled
to ADAGE CRT coordinates.
The values of the keys are 16383. (octal 37777)
to indicate that the next set of coordinates are a point to which the
should be moved without drawing a line, and 16380. (octal 37774) to indicate
that the next two words contain label
information.
(See section on ADAGE AGT30
coordinate system and SC-4020 coordinate system.)
(2BLDS) Blade Display Program
The program 2BLDS is designed to graphically display flow conditions,
either theoretical or experimental, within the blade passages of the 23 blade
transonic axial flow compressor at the Gas Turbine Laboratory blowdown facility.
Execution is begun by typing 2BLDS! and then following the instructions
output by the program.
The program allows the operator to include at run time
up to three additional
display lists.
Once the desired lists
have been read
into core the blade display is started.
With the display running the operator can remove sections of the display
and bring them back using subroutines.
The subroutines SCTOF and SCTON remove
and replace the longitudinal cross sections of the blade, GRDOF and GRDON
operate on the spanwise guide lines, and CT1ON, CT20N, CT3ON, CT1OF, CT20F,
and CT30F operate on the three lists
supplied during run time.
by using the priority switch and buffer register.
(DSP2D)
Program for Two Dimensional Displays
The program provides for two dimensional display on the AGT30.
The program
is executed by typing DSP2D! on the teletype and following the instruction output.
The program allows the operator to specify the name of the file which he wants
displayed, the total number of records with the file, and whether or not labels
have been included in the file.
No operator interaction with the display has
been provided for.
(AGTCON) Contour Display Program
AGTCON is an adaptation of two SC-4020 contouring subroutines, FNCON1 and
FNCON2.
The routine AGTCON is designed to output the SC-4020 plot coordinates
to a 7-track unlabeled tape in a format compatible with the display coordinates
on an ADAGE Graphics Terminal.
AGTCON performs two dimensional contouring in either two dimensional space
or three dimensional space.
If done in three dimensional space, the contours
are done in one plane perpendicular T. and at a fixed distance from the origin
on the third axis.
The frame is not automaticly advanced, and no grid is provided.
The calling sequence for AGTCON is:
CALL AGTCON(FUNX,Y,NXA,NYA,NX,NY,R1,R2,R3,LBL1,LBL2,ISCIND,IWRITEIRDIND,LBLIND,
IPLANEZ)
INTEGER*4 NXA,NYA, NX,NY,LBL1,LBL2,ISCIND, IWRITE,IRDIND,LBLIND,IPLANE
REAL*4
FUN(NXA,NYA),X(NXA),Y(NYA),R1,R2,R3,Z(NXA,NYA)
FUN
The array to be contoured
X+Y
The arrays of coordinates "X"+"Y" respectively
NXA+NYA
The dimensions of FUN declared in the MAIN CALLING PROGRAM.
These are also the dimensions of X and Y respectively.
NX+NY
The maximum indices of FUN to be included in the plot.
Rl,R2,R3 The levels of the function (surface) at which contour lines will be made.
Rl the minimum level R2 the maximum level
R3 the increment between contour lines.
If Rl =
0.0
and R2 =0.0
and R3#
0.0,
Rl and R2 will beset
to the minimum and maximum values of the function.If Rl =
0.0,
R2 =0.0
and R3 =0.0,
Rl and R2 will be computed as above and the increment will be computed in order to have 10 levels of plotting.LBLl Number of characters to be displayed in the labels, including leading blanks and decimal point. LBLl must be less than or equal to 6
(7 with decimal point).
LBL2 Maximum decimal scale, i.e. the maximum number of characters to be displayed to the left of the decimal point.
ISCIND Indicates whether or not SC4020 plots are desired along with the 7 track tape.
ISCIND =
0
No SC-4020output
ISCIND
#
0 SC-4020 output generatedIWRITE Indicates whether or not printed output of the coordinates is desired.
TWRITE
=0
No printed outputIWRITE
#
0 Coordinated are output in 2 or 3 columns with the appropriate headerIRDIND Indicates whether the contents of arrays X and Y are to be taken as linear or polar coordinates.
IRDIND =
0
Linear (X,Y) IRDIND#
0 Polar (R,G)LBLIND Indicates whether labels are to be output with the contour coordinates.
LBLIND =
0
No labelsoutput
LBLIND
#
0 Labels output (LBLIND#
0 implies that contours are strictly two dimensional and therefore have no third dimension output)IPLANE Indicates in which plane the contours occur and which axial distance is held constant.
IPLANE = 0 Contour in XY plane, Z constant IPLAINE < 0 Contour in XZ plane, Y constant
Z The distance the contoured point in plane is from the origin along the third axis (plane of contour may be skew).
AGTCON uses Stromberg-Carlson library subroutines so the library 'SYS5-SC4020-SUBR' must be included.
APPENDIX II
READING AND WRITING ADAGE TAPES ON OS/370
Reading: In order to read a tape it is necessary to have the tape mounted on the proper device at IPC. The user specifies this with the 1*SETUP card and with the DD cards in the deck. The SETUP and DD cards must both specify UNIT=TAPE7 and-that it is non-labeled tape. The DCB parameters RECFM=U and DEN=2 must also be coded on the DD card. BLKSIZE should be large enough to hold the longest
record to be read.
When reading the data output by the A/D conversion program, it must be read in Al format and then converted to integer notation. This can be most easily done by dimensioning three two-byte integer arrays by the blocksize, reading a single character into each element of two arrays, combining the two arrays and storing the binary integer in the third array. The conversion equation would be
ARRAY3(I)
=
[Al(I)/256]*64 + [A2(I)/256]
Division by 256 shifts the blank characters out of the low order byte of the element. Multiplication of the element of the first array by 64 positions the data in the proper bit positions. It can now be converted from an integer to a voltage using the appropriate formula.
Writing: When writing a tape for use on the ADAGE, the following DCB parameters must be coded: DEN=l, RECFM=U, and TRTCH=C. The TRTCH parameter specifies that the data conversion feature for 7 track tapes will be used. BLKSIZE should be at least as large as the longest record to be output. With RECFM=U records
shorter than BLKSIZE are written with no padding characters.
Data should be written in A format. If two byte integers are being written, A2 format should be used. For 4 byte integers or real numbers, A4 format should be used.
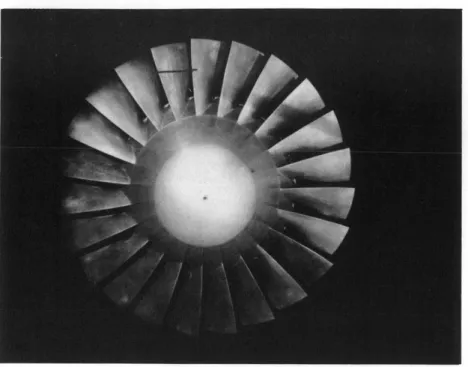
Figure
1(a):
Actual 23 blade transonic rotor and hub forGas Turbine Laboratory Transonic Blowdown Facility.
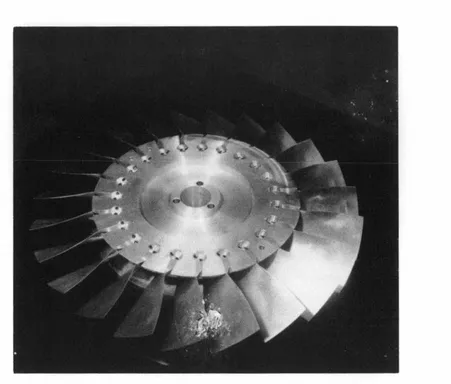
Figure 2(a):
Side view of 23 blade transonic rotor for Gas
Turbine Laboratory Transonic Blowdown Facility.
Figure 2(b):
Computer generated display of Fig. 2(a) obtained
by display rotation of the image of Fig. l(b).
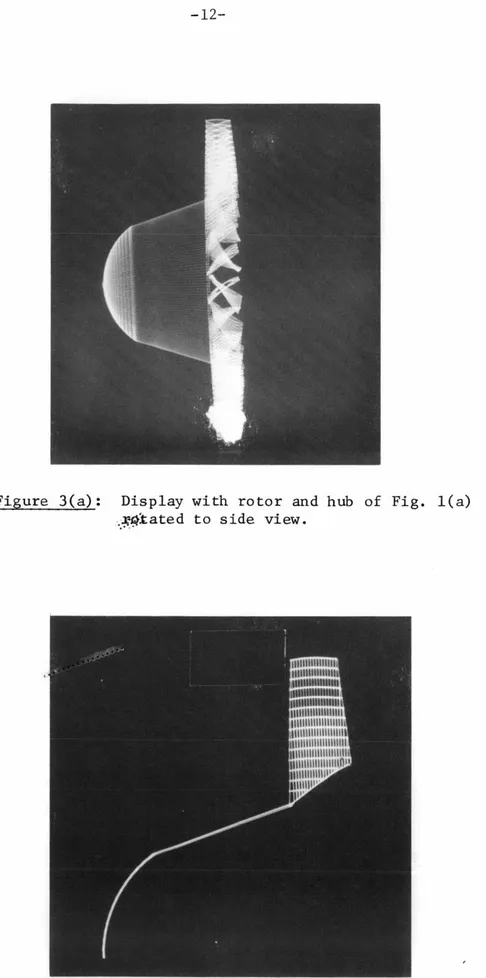
Figure 3(a): Display with rotor and hub of Fig. l(a) .ktated to side view.
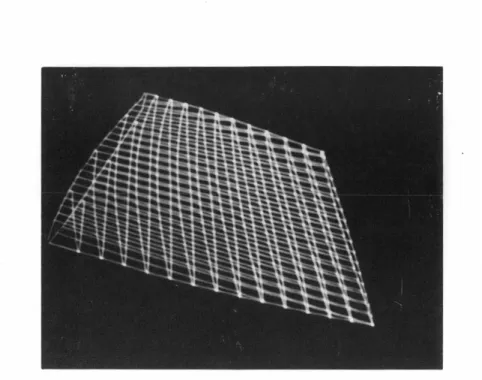
Figure 4(a): Single blade display with both constant radius cross sections and spanwise grid lines shown.
Figure 4(b): Single blade display with constant radius sections suppressed.
(b)
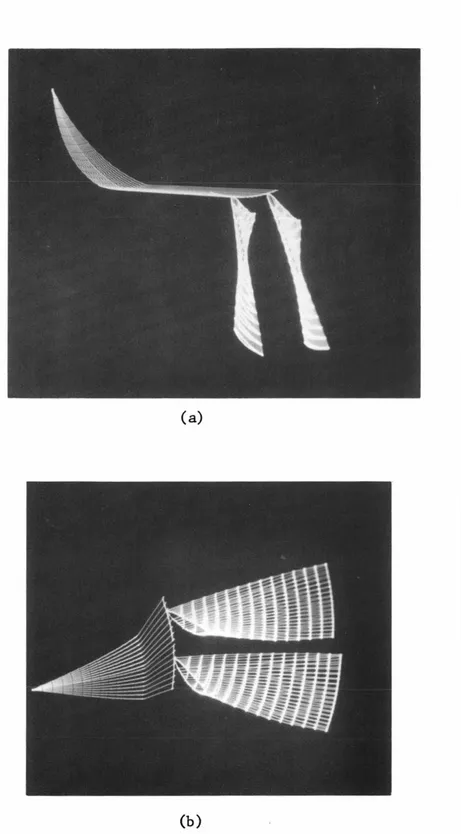
Figure
5(a),(b):
Two blades showing interblade region and section
of hub from two different viewing angles.
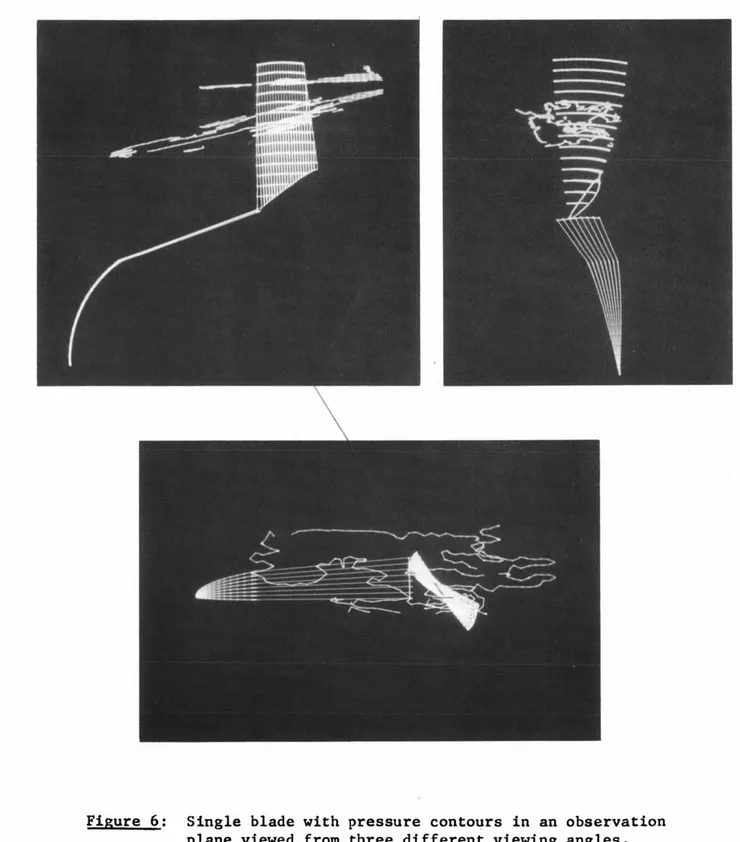
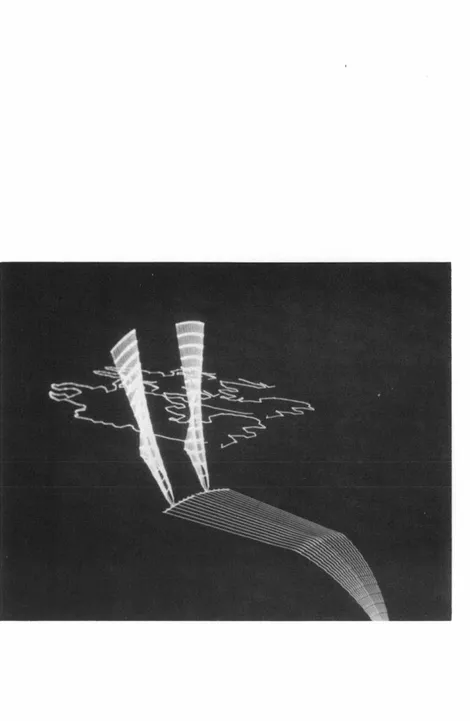
Figure 6:
Single blade with pressure contours in an observation
plane viewed from three different viewing angles.
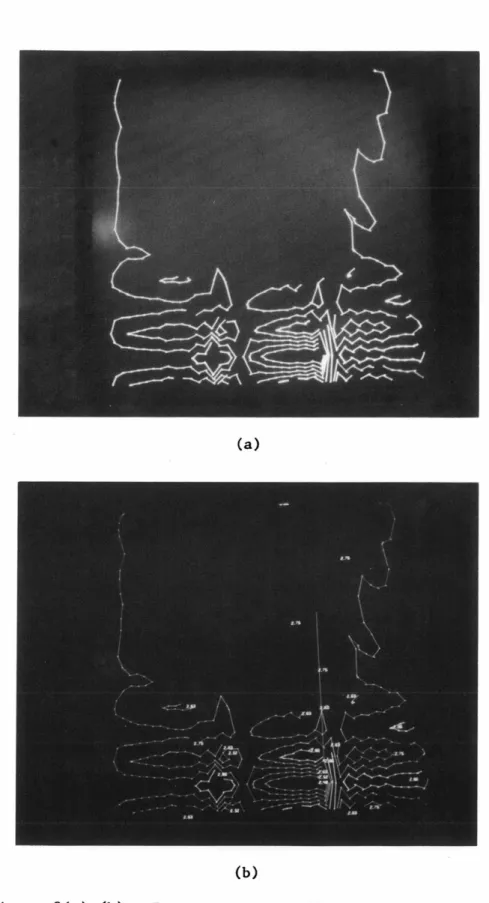
(a)
(b)
Figure 8(a),(b): Pressure contour display on Adage AGT-30 system
(a) without labels, (b) with labels.
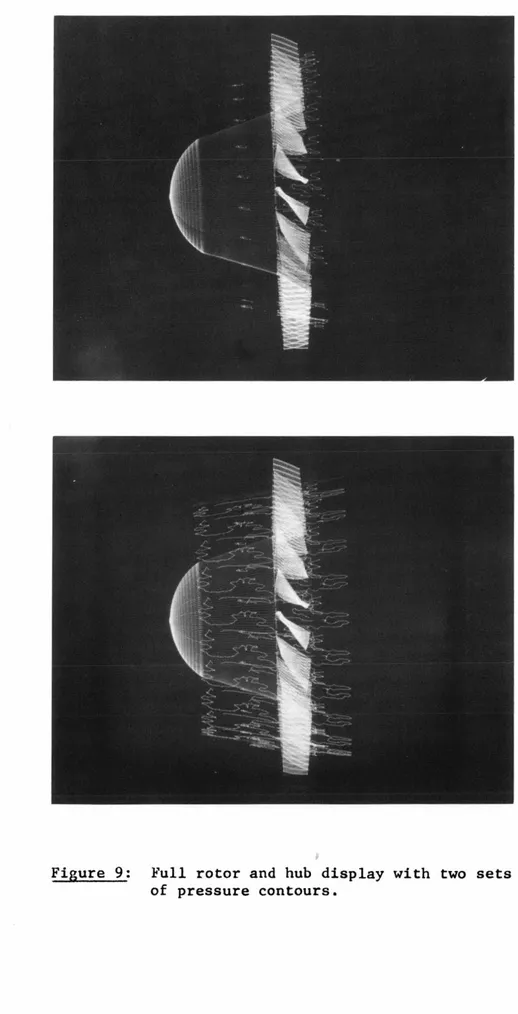
Figure 9: Full rotor and hub display with two sets of pressure contours.