HAL Id: hal-00139376
https://hal-insu.archives-ouvertes.fr/hal-00139376
Submitted on 17 Apr 2007
HAL is a multi-disciplinary open access
archive for the deposit and dissemination of sci-entific research documents, whether they are pub-lished or not. The documents may come from teaching and research institutions in France or abroad, or from public or private research centers.
L’archive ouverte pluridisciplinaire HAL, est destinée au dépôt et à la diffusion de documents scientifiques de niveau recherche, publiés ou non, émanant des établissements d’enseignement et de recherche français ou étrangers, des laboratoires publics ou privés.
Late Neoproterozoic paleomagnetic results from the
Sugetbrak Formation of the Aksu area, Tarim basin
(NW China) and their implications to paleogeographic
reconstructions and the snowball Earth hypothesis
Sheng Zhan, Yan Chen, Bei Xu, Bo Wang, Michel Faure
To cite this version:
Sheng Zhan, Yan Chen, Bei Xu, Bo Wang, Michel Faure. Late Neoproterozoic paleomagnetic results from the Sugetbrak Formation of the Aksu area, Tarim basin (NW China) and their implications to paleogeographic reconstructions and the snowball Earth hypothesis. Precambrian Research, Elsevier, 2007, 154 (3-4), pp.143-158. �10.1016/j.precamres.2007.01.001�. �hal-00139376�
Late Neoproterozoic paleomagnetic results from the Sugetbrak Formation of the Aksu area, Tarim basin (NW China) and their implications to paleogeographic
reconstructions and the snowball Earth hypothesis
Sheng Zhan1, 2, 3*, Yan Chen2, Bei Xu1, 3, Bo Wang2, 4, Michel Faure2
1. Key Laboratory of Orogenic Belts and Crustal Evolution (Peking University),
Ministry of Education, Beijing, 100871, China
2. ISTO, CNRS/Université d’Orléans, UMR6113, 45067 Orléans cedex 02, France
3. School of Earth and Space Sciences, Peking University, Beijing, 100871, China
4. Department of Earth Sciences, Nanjing University, Nanjing, 210093, China
Precambrian Research Revised Dec. 30th, 2006
*Corresponding author: sheng.zhan@univ-orleans.fr; zhansheng@pku.edu.cn
Abstract
In order to better constrain the Neoproterozoic paleogeographic reconstruction of continents and to improve the understanding of the snowball Earth hypothesis, paleomagnetic investigations were carried out in the Aksu area of the northwestern Tarim basin. Forty-eight sites of samples were collected from the Sugetbrak and Chigebrak formations. Twenty-four sites of sandstone and volcanic rock from the Sugetbrak Formation revealed stable characteristic remanent components (ChRm) isolated between 500 and 680°C. The computed magnetic directions from these components are consistent and significantly distinguished from those of younger ages. Both normal and reverse polarities have been observed, and a positive fold test is revealed after bedding corrections at 95% confidence level. Anisotropy of magnetic susceptibility measurements shows primary sedimentary fabrics with weak anisotropy degrees. A paleomagnetic pole is calculated at 19.1°N, 149.7°E, k = 11.2, A95 = 9.3° with n = 24, yielding a paleolatitude of ~27°N for the sampling area. The chemo-stratigraphic correlation of this section with reference ones reveals an average age of ~595 Ma. A new paleogeographic reconstruction has been attempted showing general low paleolatitude positions for the Australia, South China and Tarim blocks at about 600Ma. This observation provides new evidences for the snowball Earth hypothesis.
Keywords: Paleomagnetism; Aksu; Tarim; Paleogeographic reconstructions;
1. Introduction
About 50 years ago, scientists noted for the first time some major differences between Neoproterozoic glacial deposits and Cenozoic glacial deposits (Harland and Bidgood, 1959; Harland, 1964a, 1964b). Firstly, the Neoproterozoic record indicates global-scale glaciations and secondly, paleomagnetic studies yielded low latitudes for these continents (e.g. Bidgood and Harland, 1961). These phenomena led Harland (1964a) to postulate that there existed a “great Infra-Cambrian glaciation” in the Earth’s history. Due to the development of paleomagnetism and improvement of analyzing techniques in rock magnetism, many studies were carried out to test the low-latitude glaciations (Morris et al, 1977; McWilliams and McElhinny, 1980; Zhang and Zhang, 1985; Schmidt et al., 1991). All these studies seem to confirm low-latitude glaciations during the Neoproterozoic. Meert and Van der Voo (1994) assessed the quality of the paleomagnetic results that support the existence of low-latitude glaciations and found that the majority of them had a low reliability for a variety of reasons. Within the same time, “the great Infra-Cambrian glaciation” slowly evolved into the snowball Earth hypothesis (Kirschvink, 1992; Hoffman et al., 1998; Hoffman and Schrag, 2002). This hypothesis implies that the Earth experienced several complete freezes in its history. The three most acceptable episodes are the Sturtain, Marinoan, and Gaskiers (Hankalchough in Tarim) glaciations (Grey et al., 1998; Xiao et al., 2004; Condon et al., 2005). However, the existence of these low latitude global glaciations relies upon a small number of high quality paleomagnetic data, such as those from the Elatina Formation in Australia (Schmidt and Williams, 1995; Sohl et al.,
1999). More paleomagnetic data from the other blocks are needed to verify low latitude glaciations, and forwardly, to test the snowball Earth hypothesis. For this reason, and also to better constrain the paleogeography reconstructions, paleomagnetic studies have been carried out in the Tarim Basin where the Neoproterozoic glacier deposits have been well documented (Gao and Zhu, 1984; Gao et al., 1985).
2. Geological setting and paleomagnetic sampling
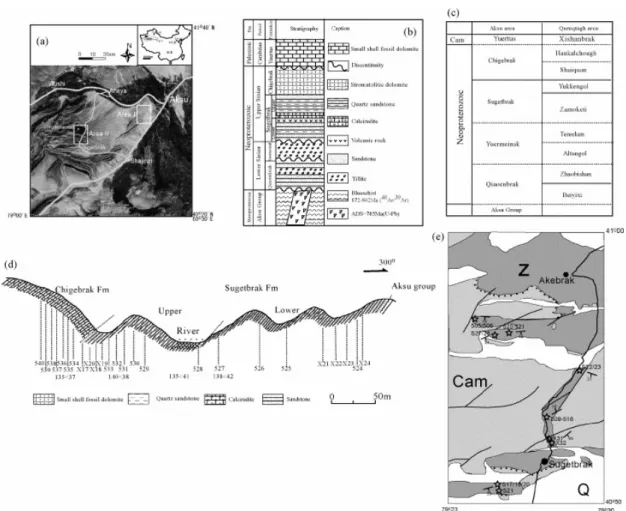
The Aksu area is located in the northwestern part of the Tarim Basin, NW China (Figure 1a). The stratigraphic succession includes the Mesoproterozoic Aksu group of metamorphic rocks, the Lower Neoproterozoic Qiaoenbrak Formation, the Yuermeinak Formation, the Upper Neoproterozoic Sugetbrak Formation, the Chigebrak Formation and the Cambrian Yuertus Formation (Figure 1b). Continental and marine glacial deposits are observed in the Yuermeinak and Qiaoenbrak formations (Gao and Zhu, 1984; Gao et al., 1985; Figure 1b). Terrestrial clastic, shallow marine carbonated rocks, with minor interbedded basaltic flows, characterize the late Neoproterozoic strata. Several tectonic episodes have occurred in this area since the Neoproterozoic, one of them, an early Permian event possibly related to the accretion of Tarim into the southern margin of the Asian plate, influenced the whole north margin of the Tarim block (Watson et al., 1987). Angular stratigraphic unconformities have been observed between the Lower and Upper Cambrian, as well
as the Lower Permian and Devonian sediments (XBGM, 1967). The collision between India and Eurasia in Cenozoic times also is responsible for the tectonic reactivation of this area. Li et al (1991) had published few paleomagnetic results, however, their samples have suffered severe remagnetization due to the Devonian and Permian magmatic events.
The Sugetbrak Formation is subdivided into the Upper and Lower part members (Figure 1b). The Lower Sugetbrak Formation is composed from bottom to top of layered red sandstone (32 m thick), layered quartz sandstone (30 m thick), and another red sandstone (46 m thick); the Upper Sugetbrak Formation is composed of gray calcirudite (22 m thick), quartz sandstone (10 m thick) and red sandstone (29 m thick), The overlaying Chigebrak Formation is composed of layered gray stromatolitic dolomite (141 m thick, Gao et al., 1985). In Area II (Figure 1a), 80-100m thick interbedded basaltic flows were locally found at the boundary between the Upper and Lower Sugetbrak formations.
No direct bio-stratigraphic age has been obtained from the Sugetbrak Formation. It may, however, be estimated by litho-stratigraphic correlation. The investigation on the Neoproterozoic stratigraphy carried out in 70 and 80’s revealed that the Neoproterozoic sedimentary strata well exposed in the Aksu area in the northwestern Tarim Basin could be correlated with those of the Quruqtagh area of the northeastern Tarim Basin (Figure 1c; Gao et al., 1985). The Yuermeinak Formation, overlain by the Sugetbrak Formation is a diamictite that is regarded as being synchronous with the Tereeken diamictite in the Quruqtagh area (Gao et al., 1985; Figures 1b and 1c).
Chemo-stratigraphic and sedimentary features of the Tereeken diamictite suggest a Marinoan age for the Tereeken glaciation (Xiao et al., 2004). Thus the Sugetbrak Formation can be considered as the strata that deposited after the Marinoan glaciation.
We collected paleomagnetic samples of the Sugetbrak Formation from two separate study areas (Figure 1a). In both areas, the deformation is weak; the rocks do not exhibite any obvious schistosity. The strata exposed in Area I, about 40 km in the southwest of Aksu city (Figure 1d), are monocline, however, variable beddings are observed in Area II, about 100 km in the southwest of Aksu city (Figure 1e).
Figure 1
Forty-eight sites were drilled using a portable gasoline-powered drill. In Area I, we collected 6 sites of gray limestone from the Chigebrak Formation, 4 sites of red sandstone and 6 sites of yellow sandstone from the Upper Sugetbrak Formation, 8 sites of red sandstone from the Lower Sugetbrak Formation. In Area II, we collected 2 sites of red sandstone and 8 sites of yellow sandstone from the Upper Sugetbrak Formation, 4 sites of volcanic rocks and 10 sites of red sandstone from the Lower Sugetbrak Formation. Each site is composed of 6 to 10 cores oriented by both magnetic and solar compasses, when it was possible. The difference between two azimuth measurements is about 3.5±2.0° and this mean value is used to the orientation corrections for those measured only by magnetic compass as well as for the trends of
the beddings. In this paper, site names initiated with X, S, 5 refer to the samples collected in 2001, 2003, 2005, respectively.
3. Paleomagnetic analyses
3.1 Laboratory measurement and directional analytic techniques
In the laboratory, drilled cores are prepared into standard specimens with 2.5 cm in diameter and 2.2 cm in length. Several methods were applied to magnetic mineralogical investigations: the acquisition of Isothermal Remanent Magnetization (IRM) by IM30 pulse magnetizer, thermal magnetic experiments by KLY3S kappa bridge susceptibility-meter coupled with a CS3 furnace, the measurements of Anisotropy of Magnetic Susceptibility (AMS) by KLY3 kappa bridge susceptibility-meter in Laboratoire de Magnetisme des Roches d’Orléans (LMRO), magnetic hysteretic curves in Laboratoire de Paleomagnétisme of Institut de Physique du Globe de Paris (IPGP) at Saint Maur. Both thermal and alternating field (AF) demagnetization methods were applied to clean the magnetic remanence. The majority of sandstone specimens were measured in LMRO with JR5A spinner magnetometer; the remaining samples were measured in IPGP with a 2G cryogenic magnetometer for comparison reason. Almost all of the limestone specimens were measured in IPGP with a 2G cryogenic magnetometer because of its low magnetic remanent intensity. No significant difference was found between the results of these two laboratories. The magnetic remanent components were isolated using the
principal component analysis method (Kirschvink, 1980), the mean directions were computed using Fisher spherical statistics (1953) which included in PMGSC (V4.2) offered by R. Enkin. The reconstruction map of continents was made using GMAP software provided by T.H. Torsvik.
3.2 Magnetic mineralogical analyses
Area I
The paleomagnetic collection from this area is essentially composed of limestone of the Chigebrak Formation and sandstone of the Sugetbrak Formation (Table 1), their magnetic behaviors are very different, and so they will be separately discussed.
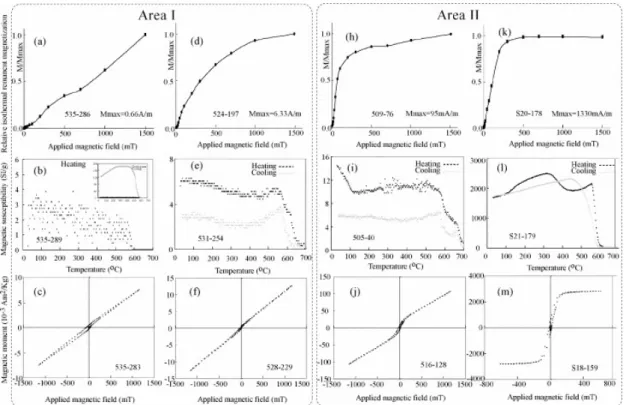
For the limestone of the Chigebrak Formation, isothermal magnetization measurements show linear increase of IRM up to about 1.5 Tesla without total saturation, indicating predominant high coercive magnetic minerals (Figure 2a). Weak and noisy susceptibility intensity has been measured during the heating process of the thermal magnetic experiment (Figure 2b), a rapid increase of magnetic susceptibility took place at about 600-550°C during the cooling, which indicates a mineral oxidation during the thermal experiments (the inlayed figure in Figure 2b). Pyrite may be the origin of newly formed magnetite. The magnetic hysteretic curves show also almost linear relation between the applied magnetic field (H) and induced magnetization up to 1.2 Tesla. As no low magnetic coercive minerals have been identified by either IRM or hysteresis courves, the relative drop of magnetic susceptibility at about 580°C may be produced by newly formed magnetite (Figure
2b), and the concentration of magnetic remanent minerals in the limestone should be low.
For the sandstone of the Sugetbrak Formation, IRM measurements show a relative rapid increase of remanent magnetization at the weak applied field but without a total saturation at about 1.5 Tesla, indicating the existence of both low and high magnetic coercive minerals in samples (Figure 2d). Thermal magnetic experiments revealed a slight continuous drop of magnetic susceptibility at about 580°C, and then there is another drop after 600°C, identifying the existence of both magnetite and hematite (Figure 2e). The magnetic hysteretic curves show a linear relationship between the applied magnetic field and induced magnetic moment without any saturation tendency at about 1.1 Tesla (Figure 2f), confirming that hematite should play a dominant role for the magnetic remanent carriers as usually observed in the red beds (Butler, 1998).
Area II
As the paleomagnetic collection from this area is composed of sandstone and basalt (Table 1), their magnetic mineralogical investigations will be described separately.
To the sandstone samples, several representative specimens were chosen for the magnetic mineralogical experiments. Isothermal magnetization measurements show a rapid increase of IRM up to about 200 mT, then continue with a linearity increase until to about 1.5 Tesla without total saturation, indicating possible existence of both high
and low magnetic coercive minerals (Figure 2h). Thermal magnetic experiments reveal a sharp drop of magnetic susceptibility at about 100°C, indicating the existence of goethite (Figure 2i), and two other rapid drops at about 580°C and 680°C, indicating the existence of magnetite and hematite (Figure 2i). The magnetic hysteretic curves show a clear curvature change at about 200 mT and the linear increase of induced magnetic moment without any saturation at about 1.2 Tesla (Figure 2j). The ratios of Js/Jrs at about 0.35 and of Hc/Hrc at about 2.4 have been calculated after subtracting the linear proportion of curves. These values show characteristics of pseudo single domain magnetite (Dunlop, 1986). The above observations indicate that the magnetic remanent carriers of the sandstone are magnetite and hematite.
Concerning the basalt samples, isothermal magnetization measurements show a rapid increase at weak applied magnetic fields and attain the magnetic saturation at about 200 mT, indicating the predominance of low magnetic coercive minerals (Figure 2k). Thermal magnetic experiments reveal a slight drop at about 350-450°C showing the possible presence of maghematite (Figure 2l). A sharp drop of magnetic susceptibility at about 560-580°C with a Hopkinson peak has been observed indicating the existence of low-titanium single domain magnetite (Figure 2l; Dunlop and Ozdemir, 1997). The magnetic hysteretic curves characterize the behavior of typical low magnetic coercive minerals. The induced magnetic moment is totally saturated at about 200 to 300 mT (Figure 2m). The ratios of Js/Jrs and Hc/Hrc vary from 0.18 - 0.23 and 2.86 – 3.34, respectively. These values show typical
characteristics of pseudo single domain magnetite (Dunlop, 1986). The above observations indicate that magnetite is the principal magnetic remanent carrier of the basalt samples.
Figure 2
3.3 Magnetic direction analyses
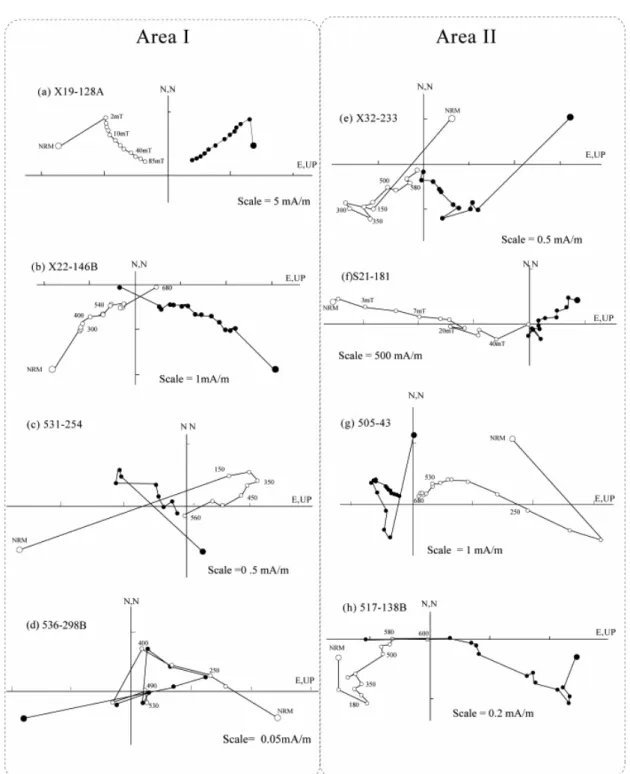
A pilot study has been carried out by both thermal and AF demagnetization. The Natural Remanent Magnetization intensity (NRM) of most basalt samples is about 1 A/m, which of sandstone samples varies from 0.6 to 11.2 mA/m with an average of 3.25 mA/m. While to the limestone samples from the Chigebrak Formation, a weak NRM has been observed with a mean value of about 9 x 10⁻⁴ A/m ranging from 0.15 to 2.57 mA/m. About 15 steps have been applied to progressive magnetic remanence cleaning with intervals varying from 20 to 150°C for thermal demagnetization (Figures 3b, 3c, 3d, 3e, 3g and 3h) and 1 to 20 mT for AF ones (Figures 3a and 3f). Figures 3a, 3b, 3c, and 3d show samples from Area I (left column), and Figures 3e, 3f, 3g and 3h show samples from Area II (right column).
As mentioned above, the limestone of Chigebrak Formation suffered a severe mineralogical transformation during the heating process. No stable component could be isolated after removing the viscous or unstable component (a drop of 60% of NRM at 1 mT or 150°C; Figure 3d), 6 limestone sites of the Chigebrak Formation are, therefore, excluded from the following discussion.
Concerning sandstone and basalt samples, because both techniques show similar results and the thermal one seems more efficient, the latter one has been used as the principal magnetic remanence cleaning technique. Most of the measured specimens show multi-components and normal polarity (Fig 3), some of them show reversed polarity (Figures 3c and 3g). Both polarities have been observed in Site 505.
Figure 3
Several groups of directions isolated from the remaining 42 sandstone and basalt sites were distinguished as following: 3 sandstone sites show a site-mean direction close to the Present Earth Field (PEF; see Table 1); 4 sandstone sites show dispersed high temperature components; 5 yellow and red sandstone sites show weak NRM intensity with an average of 9 x 10⁻⁴ mA/m and/or viscous remanence, and their NRM intensity drops to less than about 50% of NRM after the first demagnetization at 150°C which is close to the JR-5A sensibility; 5 sites (Sites 529, 530, 533, 514 and 515 in Table 1) present their site-mean direction with southward declinations and high upward inclinations, this direction is consistent with the Permian ones defined in both Tarim and Junggar basins by several paleomagnetic studies (e.g. Li et al., 1988; Table 1); 1 basalt site (Site S18) shows an extremely high NRM of about 20 A/m, the direction isolated from the magnetic component is significantly different from the other sites (Table 1). The calculation of Koenigsberger ratio of this site, Q value, is about 4 times that the other sites, which is suspected to have suffered lightening. The
remained 24 sites (12 sites from each area) from both basalt and sandstone of the Sugetbrak Formation reveal coherent and stable characteristic magnetic components that are significantly different with the well-known paleomagnetic directions of Tarim basin since Paleozoic. Almost all of specimens show an eastward declination and downward inclination (e.g. Figures 3a and 3b) and few of them present a westward declination and upward inclination (e.g. Figures 3c and 3g).
Table 1
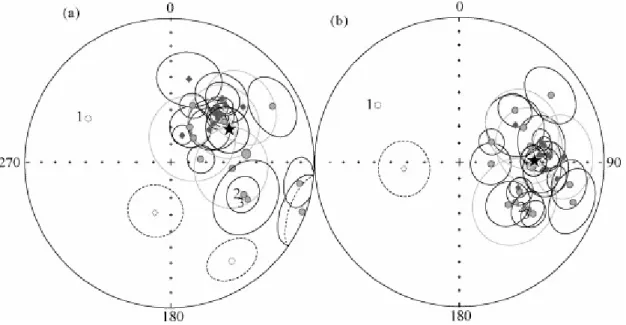
Area-mean directions have been firstly computed before and after bedding corrections (Table 1): for Area I, Dg = 39.9°, Ig= 51.5°, kg = 36.6, a95g = 7.3° (diamond symbols in Figure 4a) and Ds = 86.0°, Is = 41.3°, ks = 37.4, a95s = 7.2° with n = 12 (diamond symbols in Figure 4b); for Area II: Dg = 82.0°, Ig = 46.6°, kg = 4.1, a95g = 24.4° (circle symbols in Figure 4a) and Ds = 92.8°, Is = 48.5°, ks = 8.9, a95s = 15.4° with n = 12 (circle symbols in Figure 4b). Because of weak bedding variation, the directional statistic parameters remain constant for Area I after bedding corrections. However, Area II reveals a significant improvement of directional clustering after bedding corrections with respect to before ones. Moreover, due to the insignificant angular difference of 8.0±12.1° (Debiche and Watson, 1995) between the directions after bedding corrections from Areas I and II and the short distance of about 60 km apart of these two areas, a total average of 24 sites has been calculated as well (MeanA in Table 1): Dg = 59.5°, Ig = 51.2°, k = 6.3, a95 = 12.7° and Ds = 89.0°, Is
=44.8°, k = 14.4, a95 = 8.1° with n = 24 (Stars in Figures 4a and 4b, respectively). From Table 1, one may easily find that 4 of 24 sites that are included in the global average calculation have a relatively weak confidence level with α95 > 20°. This is probably due to the influence of secondary components, either PEF or Permian direction. A new mean direction has been, therefore, calculated: Dg = 59.2°, Ig = 50.4°, k = 5.6, α95 = 15.2° and Ds = 89.4°, Is =44.8°, k = 13.7, α95 = 9.1° with n = 20. This new mean direction is consistent with the global one (MeanB in Table 1).
Figure 4
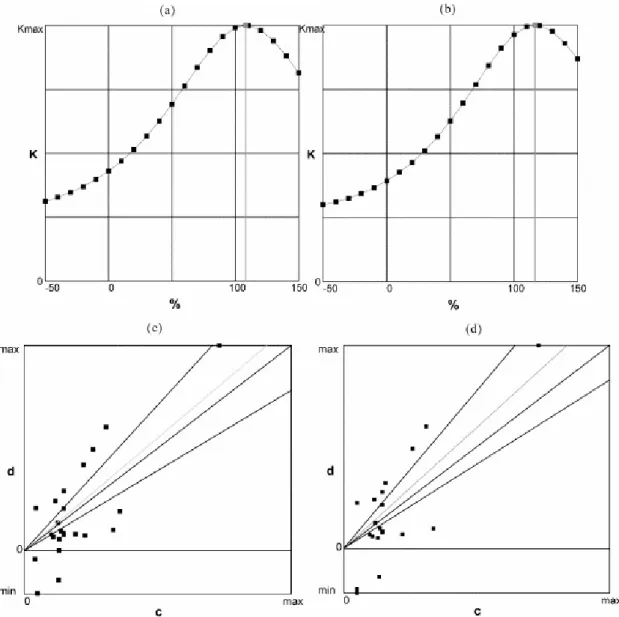
The progressive unfolding shows a significant improvement in clustering after bedding corrections with respect to before ones for both area-mean directions with ratios of Ks/Kg=2.24 and 1.67 (Meana and MeanB in Table 1; Figures 5a and 5b). The optimal concentration of direction correction (DC) tilt test are achieved at 108.08± 32.84% and 119.04±36.10% (Enkin, 2003), indicating a positive fold test at the 95% confidence level for both mean direction calculations (Figures 5c and 5d). McFadden’s method (1990) gives also positive answer to fold test at 99% confidence level.
Figure 5
Laboratory magnetic mineralogical and directional analyses reveal several features of this Neoproterozoic paleomagnetic collection: (1) weak and viscous magnetic remanence takes an important proportion (11 sites); (2) the influence of posterior tectonic events cannot be neglected. It seems that the late Paleozoic tectonics of Central Asia is responsible for sample remagnetization. The Permian paleomagnetic direction has been observed in 5 sites and, sometimes, this Permian component may be also observed in some samples as middle temperature component among lower and higher temperature ones. For instance, the sample 505-43 (Figure 3g) shows three distinct components: after removing the close-to-PEF lower temperature component at about 100°C (probably due to goethite), a stable middle temperature component can be isolated from 100 to 400°C, which is typical of the Permian direction (e.g. Li et al., 1988; Wang et al., in review), and finally a high temperature component from about 500 to 680°C reveals a direction consistent with other characteristic remanent magnetization. Before pushing forward the tectonic interpretations of these paleomagnetic data, their reliability and remanence age should be discussed.
4.1 Reliability of paleomagnetic data
As mentioned in the geological setting section, the sampling areas experienced several important tectonic events since the Paleozoic, for examples, the continental accretion of Tarim into the southern margin of the Asian plate (e.g. Watson et al., 1987), large scale strike-slip relative motion between the Tarim and Junggar blocks
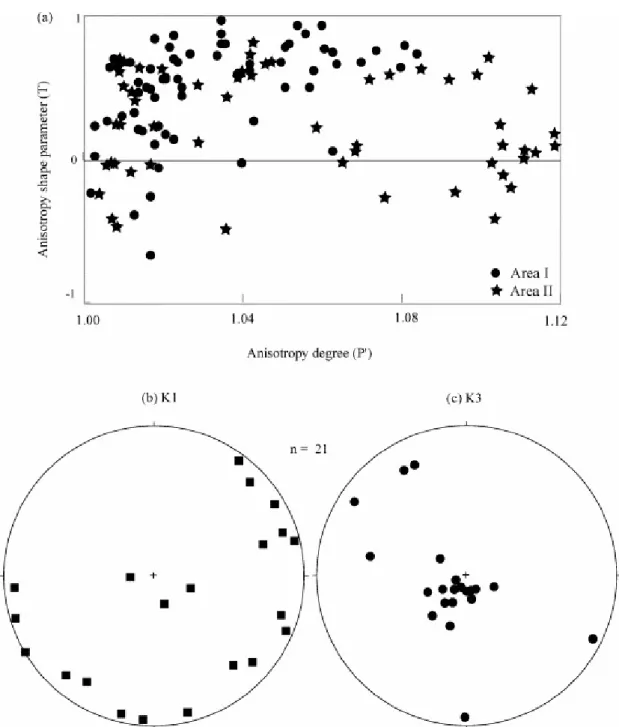
(e.g. Wang et al., in review), important deformation along the boundaries of Tarim block due to the India-Asia collision (Chen et al., 1993). In order to recognize the deformation degree of sampled rocks as well as the possible influence of tectonic events on the magnetic remanence, the Anisotropy of Magnetic Susceptibility (AMS) measurements have been systematically carried out on specimens. The orientation of the principal magnetic fabric axes, namely Kmax (K1), Kint (K2) and Kmin (K3), has been measured for each specimen. K1 represents the magnetic lineation and K3 the pole of the magnetic foliation. The bulk magnetic susceptibility, excluding the basalts, varies from 6 to 526 x 10-6 SI with an average value of 151±142 x 10-6 SI. The anisotropy degree (P’) and shape parameter (T) have been calculated. Table 2 and Figure 6 present AMS measurement results of the 21 sedimentary sites used to calculate the area-mean direction. The P’ value ranges from 1 to 1.12 with the majority lower than 1.10 for both areas. The average value is 1.05±0.05 and 1.06±0.06 for Area I and Area II, respectively (Figure 6a, circles refer to Area I and stars refer to Area II). This may imply that the sampled rocks have not been significantly deformed by tectonic events. In Area I, most of specimens reveal a positive T value, indicating that the magnetic foliation is dominant with respect to the magnetic lineation (Figure 6a). However, the dominance of magnetic foliation in Area II is less significant than in Area I (Figure 6a). The equal-area projections of the principal axes (Figures. 6b and 6c) show near horizontal K1 axes and highly inclined K3 axes for the most of measured specimens, respectively, indicating a well defined horizontal attitude for the initial bedding. Combining the weak anisotropy degree, the planar fabric dominance
and the confidently initial horizontal bedding, the fabrics measured from these specimens can be considered as primary and sedimentary.
Figure 6 Table 2
The observations of positive fold test, both normal and reversed polarities, stable magnetic remanent carriers and primary sedimentary AMS lead us to conclude that the characteristic remanent magnetization isolated from the Sugetbrak Formation of the Aksu area is primary. A paleomagnetic pole is, therefore, calculated from 24 sites (Table 1): λ =19.1°N, φ =149.7°E, k = 11.2 with A95 = 9.3°, yielding a paleolatitude of 27.3°±10.0°N at the sampling locality (Table 1).
4.2 Age range of the Sugetbrak Formation
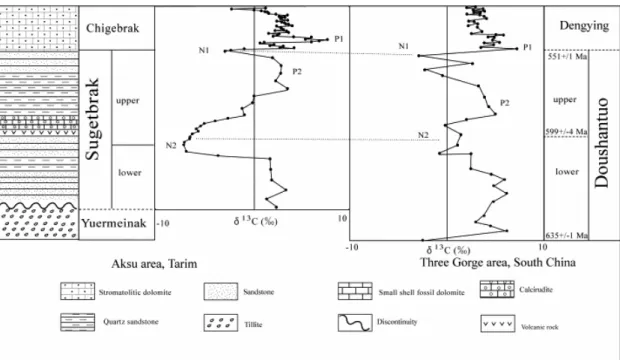
Though several radiometric attempts have been made to date the basalt interlayer at the top of the Lower Sugetbrak Formation, no direct age constraint was obtained. However, a chemo-stratigraphic investigation on the same section of the Sugetbrak Formation in Area I have been carried out allowing estimating the formation age. The characteristic δ13C curve presents two negative and two positive carbon excursions that are comparable to that of the Doushantuo Formation of South China (Figure 7, modified after He et al., in press). The negative excursion at the boundary between the Lower and Upper Sugetbrak Formation is interpreted as the mark of a cap carbonate
associated with the glaciation (He et al., in press). Two SHRIMP U-Pb zircon ages of 551.1±0.7 Ma and 635.2±0.6 Ma yielded from the top and bottom of the Doushantuo Formation constrain the duration time of the Doushantuo Formation (Condon et al., 2005), which suggests that the Duoshantuo Formation lasted about 80 Ma. This also suggests a similar duration for the Sugetbrak Formation. According to this correlation, we take the middle age of Doushantuo Formation, ~595 Ma, as the average age of the Sugetbrak Formation and, consequently, as the age of the paleomagnetic pole determined here.
Figure 7
4.3 Implications for the snowball Earth hypothesis and continent reconstruction
According to this paleomagnetic study and others of similar age, such as Australia (590~610 Ma for the Elatina Formation; Sohl et al., 1999), South China (599±4 Ma from the lower part of the Upper Sequence of the Doushantuo Formation, Barfod et al., 2002; Macouin et al., 2004), and India (comparable to the Elatina Formation pole; De, 2003; Macouin et al., 2004), a new paleogeographic reconstruction at about 600 Ma is made for these blocks (Figure 8a). This new paleogeographic reconstruction suggests that the Tarim Block was located to the north of Australia and, if taking the error bars into consideration, probably still in the Kimberley-Tarim connection that was firstly proposed by Li et al (1996; 2001) mainly on geological evidences, then confirmed by the paleomagnetic study of Aksu dyke swarm (Chen et al., 2004). The main arguments
for the Kimberley-Tarim connection are: 1. The ages of 798~811 Ma of the Kimberley rocks (Pidgeon et al., 1989; Li et al., 2003) are not statistically different from that of the Aksu dykes (785±31 Ma, Zhang, personal communication). This may imply that these rocks could be related to the same magmatic event. 2. In addition to this widespread magmatism, the Neoproterozoic Sturtian tillites and overlaying sedimentary succession in the Kimberley Proterozoic Basin (Plumb, 1996; Corkeron et al., 1996; Grey and Corkeron, 1998) are also comparable to those of the Tarim Basin (Gao and Zhu, 1984; Gao et al., 1985; Brookfield, 1994). Concerning the paleoposition of SCB, as it is beyond the scope of this study, we just put the possible latitudinal positions in Figure 8 (see Li et al., 1999; 2004 for detailed discussion).
The configuration at about 600 Ma (Figure 8a) is quite similar to that given in Chen et al (2004, Figure 8b). It is worth to note that a new SHRIMP U-Pb age of 785±31 Ma has been obtained from the Aksu dyke swarm recently (Zhang, L.F., 2006; personal communication). Therefore, this new age is used to the paleogeographic reconstruction. Figure 8b shows the corresponding modification of Chen’s reconstruction based on reliable paleomagnetic data from MDS of Australia (755±3 Ma; Wingate and Giddings, 2000) and the Liantuo Formation of South China (748±12 Ma; Evans et al., 2000). Although more detailed geochronological work is still needed to better constrain the age of the paleomagnetic data, these paleogeographic reconstructions at about 760 and 600 Ma are acceptable.
Conversely to the above paleogeographic reconstructions, the paleomagnetic results obtained for the ~740 Ma Beiyixi volcanic rocks from the northeastern Tarim
Basin (Huang et al. 2005; Xu et al., 2005) reveals an equatorial paleolatitude of their sampling locality, even in the south of Australia (Figure 8c, see their Figure 7). Taking into account the paleomagnetic data of Chen et al. (2004), Huang et al. (2005) propose a scenario in which the Tarim Block would be a continental fragment rifted along Western Australia during the break-up of the Rodinia supercontinent at about 820-750 Ma. This implies that the Tarim Block moved independently about 4000 km from the north to the south of Australia during this period.
Several hypotheses can be invoked to explain this contradiction. (a) As suggested by Huang et al (2005), the Tarim Block was rather mobile during this period. It experienced a motion from the north to the south of Australia during 800-750 Ma and then rifted back from the south to the north of Australia before 600 Ma. It is rather difficult to understand the geodynamic mechanism responsible for this kinematic history. (b). The Tarim Block is probably formed by two independent tectonic units as suggested by geochronological study of the magmatic rocks from Central Tarim (Guo et al., 2005). The sampling zones of the two studies are located at about 800 kilometres apart on each of these two tectonic units that might have experienced quite distinct Proterozoic histories. (c). As the paleomagnetic collection of Huang et al (2005) from the Beiyixi volcanic rocks was taken along a monoclinal series in a small area (less than 1 km2), the samples may have suffered posterior tectonic events and remagnetization, the paleomagnetic results may, therefore, reflect a local tectonic phenomenon. Furthermore, neither fold test nor reversal one has been documented in that study. If this is the case, Tarim was kept in connection with Australia until at least
600 Ma. The principal feature of these two reconstructions at ca.760Ma and ca.600Ma suggests that these continents have slowly shifted from north to south during this period and the continental mass occupied an equatorial paleolatitude at the end of the Neoproterozoic. According to neighbouring geographic relationship, it seems that Tarim was quite close to both Australia and SCB forming a wide landmass with other major continents, and had experienced the similar kinematics history with Australia and South China until the end of the Neoproterozoic. The break-up of Tarim-Australia probably took place after 600 Ma. Further work on different type rocks of various ages is needed to enlarge the database and to make more comprehensive understandings.
Figure 8
In summary, this paleomagnetic study yields a reliable paleomagnetic pole for the Neoproterozoic Sugetbrak Formation based on (1) well defined and stable magnetic remanent carriers; (2) the presence of both polarities; (3) positive fold test; (4) negligible deformation demonstrated by AMS measurements and (5) consistent magnetic directions shown by both sedimentary and volcanic rocks from two distant areas. An age of about 600 Ma is estimated for this pole by the isotopic correlation with the type section of South China. This pole corresponds to a paleolatitude of 27°N for the Tarim Block at the corresponding period. Combining these results with those of similar age from Australia, South China, and India, a new paleogeographic reconstruction at about 600Ma was built up that shows a rather low paleolatitude for
such a large landmass. If a so large scale freezing observed on this landmass in this period, this phenomenon may be global, which presents new evidence for the snowball Earth hypothesis. The comparison of this reconstruction with those drawn at about 760 Ma and 740Ma suggests at least three possibilities for the kinematic history of the Tarim Block in the Neoproterozoic time can be discussed. Therefore, more paleomagnetic data with good geochronological control are needed to better constrain the paleogeographic reconstructions and the kinematic history of the Tarim Block in Neoproterozoic time.
Acknowledgements
This study was supported by a grant from the National Natural Science Foundation of China (40572133, 40032010) and French CNRS ECLIPSE program. The first author benefits a scholarship grant from the French Embassy PhD alternate research program. We are grateful to two anonymous reviewers for their constructive critics that significantly improved the quality of the first draft. We present also our thanks to Luc Barbanson, Shaoying Huang, Rongjin Deng, Peng Chen, Jinyou He, Julien Charreau, Johann Tuduri, Pierre Trap, Xiubin He and Zhiyun Yuan for their field assistance and technical help in the laboratory.
References
Barfod, G.H., Albarède, F., Knoll, A.H., Xiao, S., Télouk, Frei, R., Baker, J., 2002. New Lu-Hf and Pb-Pb age constraints on the earliest animal fossils. Earth Planet. Sci. Lett. 201, 203-212.
Bidgood, D.E.T., W.B. Harland, 1961. Palaeomagnetism in some East Greenland sedimentary rocks. Nature (London) 189(4765), 633-634.
Brookfield, M.E., 1994. Problems in applying preservation facies and sequence models to Sinian (Neoproterozoic) glacial sequences in Australia and Asia. Precambrian Res. 70, 143–147.
Butler, R.F., 1998. Paleomagnetism: Magnetic domains to geologic Terranes, Electronic Edition, pp. 23.
Chen, Y., Courtillot, V., Cogne, J.P., Besse, J., Yang, Z., Enkin, R., 1993. The configuration of Asia prior to the collision of India Cretaceous paleomagnetic constraints, J. Geophys.Res. 98, 21937-21941.
Chen, Y., Xu, B., Zhan, S., Li, Y.A., 2004. First mid-Neoproterozoic paleomagnetic results from the Tarim Basin (NW China) and their geodynamic implications. Precambrian Res. 133, 271–281.
Condon, D., Zhu, M.Y., Bowring, S., Wang, W., Yang, A.H., Jin, Y.G., 2005. U-Pb Ages from the Neoproterozoic Doushantuo formation, China. Science 308, 95-98. Corkeron, M., Grey, K., Li, Z.X., Powell, C.M., 1996. Neoproterozoic glacial
episodes in the Kimerley region, northwestern Australia. Abstr. Geol. Soc. Australia, 41, 97.
De, C., 2003. Possible organisms similar to Ediacaran forms from the Bhander Group, Vindhyan Supergroup, Late Neoproterozoic of India. J. Asian Earth Sci. 21, 387-395.
Debiche, M. G., Watson, G. S., 1995. Confidence limits and bias correction for estimating angles between directions with applications to paleomagnetism. J. Geophys. Res. 100, 24405–24430.
Dunlop, D.J., 1986. The rock magnetism of fine particles. Phys. Earth Planet. Inter. 13, 260-267.
Dunlop, D., Ozdemir, O., 1997. Rock magnetism, Cambridge University press, pp. 576.
Enkin, R.J., 2003, The direction-correction tilt test: an all-purpose tilt/fold test for paleomagnetic studies. Earth Planet. Sci. Lett. 212, 151-166.
Evans, D.A.D., Li, Z.X., Kirschvink, J.L., Wingate, M.T.D., 2000. A high-quality mid-Neoproterozoic paleomagnetic pole from South China, with implications for ice ages and the breakup configuration of Rodinia. Precambrian Res. 100,
313-334.
Fisher, R., 1953. Dispersion on a sphere. Proc. R. Soc. London, Ser. A 217, 295–305. Gao, Z., Wang, W., Peng, C., Li, Y., Xiao, B., 1985. The Sinian System of Xinjiang.
Urumqi, pp. 1–173 (in Chinese with English abstract).
Gao, Z., Zhu, C., 1984. Precambrian Geology in Xinjiang, China. Urumqi, pp. 1–151 (in Chinese with English abstract).
succesions of the Kimberley region, Western Australia: evidence for a younger Marinoan glaciation. Precambrian Res. 92, 65-87.
Guo, Z.J., Yin, A., Robinson, A., Jia, C.Z., 2005. Geochronology and geochemistry of deep-drill-core samples from the basement of the central Tarim basin . J. Asian Earth Sci. 25, 45-56
Harland, W.B., 1964a. Critical evidence for a great infra-Cambrian glaciation. Geologische Rundschau. 54, 45-61.
Harland, W.B., 1964b. Evidence of late Precambrian glaciation and its significance. In: Nairn, A.E.M. (ed.) Problems in Palaeoclimatology. Interscience, London, pp. 119-149.
Harland, W.B., Bidgood, D.E.T., 1959. Palaeomagnetism in some Norwegian sparagmites and the late pre-Cambrian ice age. Nature 184, 1860-1862. He, X.b., Xu, B., Yuan, Z.Y., 2006. C-isotope composition and correlation of the
Upper Neoproterozoic in Keping area, Xinjiang, Chinese Sci. Bull. (in press) Hoffman, P.F., Kaufman, A.J., Halverson, G.P., Schrag, D.P., 1998. A Neoproterozoic
snowball Earth. Science 281, 1342-46.
Hoffman, P.F., Schrag, D.P., 2002. The snowball Earth hypothesis: testing the limits of global change. Terra Nova 14, 129-155.
Huang, B.C., Xu, B., Zhang, C.X., Li, Y.A., Zhu, R.X., 2005. Paleomagnetism of the Baiyisi volcanic rocks (ca. 740 Ma) of Tarim, Northwest China: A continental fragment of Neoproterozoic Western Australia? Precambrian Res. 142, 83-92. Kirschvink, J.L., 1980. The least squares line and the analysis of paleomagnetic data.
Geophys. J. R. Astron. Soc. 62, 699–718.
Kirschvink, J.L., 1992. Late Proterozoic low-latitude glaciation: the snowball Earth. In The Proterozoic Biosphere, Schopf, J.W. and Klein, C., eds., pp. 51-52, Princeton Univ. Press, New York.
Li, Y.P., McWilliams, M., Cox A., Sharps, R., Li, Y.A., Gao, Z.J., Zhang, Z.K., Zhai, Y.J., 1988. Late Permian paleomagnetic pole from dikes of the Tarim craton, China. Geology 16, 275–278.
Li, Y.P., Li, Y.A., Sharps, R., McWilliams, M., Gao, Z.J., 1991. Sinian paleomagnetic results from the Tarim block, western China. Precambrian Res. 49, 61–71.
Li, Z.X., Zhang, L., Powell, C.M., 1996. Position of the East Asian cratons in the Proterozoic supercontinent Rodinia. Aust. J. Earth Sci. 43, 593-604.
Li, Z.X., Li, X.H., Kinny, P.D., Wang, J., 1999. The breakup of Rodinia: Did it start with a mantle plume beneath South China? Earth Planet. Sci. Lett. 173, 171-181. Li, Z.X., Powell, C.M., 2001. An outline of the palaeogeographic evolution of the
Australasian region since the beginning of the Neoproterozoic. Earth Sci. Rev. 53, 237-277.
Li, Z.X., Li, X.H., Kinny, P.D., Wang, J., Zhang, S., Zhou, H., 2003. Geochronology of Neoproterozoic syn-rift magmatism in the Yangtze Craton, South China and correlations with other continents: evidence for a mantle superplume that broke up Rodinia. Precambrian Res. 122, 85–109.
Li, Z.X., Evans, D.A.D., Zhang, S., 2004. A 90o spin on Rodinia: possible causal links between the Neoproterozoic supercontinent, superplume, true polar wander and
low-latitude glaciation. Earth Planet. Sci. Lett. 220, 409-421.
Macouin, M., Besse, J., Ader, M., Gilder, S., Yang, Z., Sun, Z., Agrinier, P., 2004. Combined paleomagnetic and isotopic data from the Doushantuo carbonate, South China: implication for the “Snowball Earth” hypothesis. Earth Planet. Sci. Lett. 224, 387-298.
McFadden, P. L., 1990. A new fold test for paleomagnetic studies. Geophys. J. Int. 103, 163~169.
McWilliams, M.O., McElhinny, M.W., 1980. Late paleomagnetism of Australia: the Adelaide Geosyncline. J. Geol. 88, 1-26.
Meert, J.G., Van der Voo, R., 1994. The Neoproterozoic (1000-540 Ma) glacial intervals: no more snowball Earth? Earth Planet. Sci. Lett. 123, 1-13.
Morris, W., 1977, Paleolatitude of glaciogenic upper precambrian rapitan group and the use of tillites as chronostratigraphic marker horizons. Geology 5, 85–88. Pidgeon, R.T., Smith, C.B., Fanning, C.M., 1989. Kimberlite and lamproite
emplacement ages in Western Australia. In: Ross, J., et al. (Eds.), Kimberlites and Related Rocks Volume 1: Their Composition, Occurrence, Origin and
Emplacement. Geol. Soc. Aust. Spec. Pub. Carlton, pp. 382–391.
Plumb, K.A., 1996. Revised correlation of Neoproterozoic glacial successions from the Kimberley region, northwestern Australia. Abstr. Geol. Soc. Australia 41, 344. Schmidt, P.W., Williams, G.E., Embleton, B.J.J., 1991. Low palaeolatitude of Late
Proterozoic glaciation: early timing of remnance in Haematite of the Elatina Formation, South Australia. Earth Planet. Sci. Lett. 105, 355-367.
Schmidt, P.W., Williams, G.E., 1995. The Neoproterozoic climatic paradox:
Equatorial paleolatitude for Marinoan glaciation near sea level in South Australia. Earth Planet. Sci. Lett. 134, 107-124.
Sohl, L.E., Christie-Blick, N., Kent, D.V., 1999. Paleomagnetic polarity reversals in Marinoan (ca. 600 Ma) glacial deposits of Australia: Implications for the duration of low-latitude glaciation in Neoproterozoic time. GSA Bulletin 111, 1120-1139. Wang, B., Chen, Y., Zhan, S., Shu, S., Faure, M., Cluzel, D., Charvet, J.,
Laurent-Charvet, S., 2006. Primary Carboniferous and Permian paleomagnetic results from the Yili Block (NW China) and their geodynamic implications on the evolution of Chinese Tianshan Belt. Submitted to Earth Planet. Sci. Lett.
Watson, M P., Hayward, A B, Parkinson, D N., Zhang, Zh.M., 1987. Plate Tectonic History, Basin Development and Petroleum Source Rock Deposition onshore China. Marine and Petroleum Geology 4, 205-225.
Wingate, M. T. D., Giddings, J.W., 2000. Age and paleomagnetism of the Mundine Well dyke swarm, Western Australia: implications for an Australia–Laurentia connection at 755 Ma. Precambrian Res. 100, 335-357
Xiao, S., Bao, H., Wang, H., Kaufman, A. J., Zhou, C., Li,G., Yuan,X., Ling, H., 2004. The Neoproterozoic Quruqtagh Group in eastern Chinese Tianshan: Evidence for a post-Marinoan glaciation. Precambrian Res. 130, 1-26.
XBGM, Xinjiang Bureau of Geologyy and Mineral Resources, 1967. Xinjiang geological map of Wushi region, scale 1:20,000, Minist. Geol. Min.Res, Beijing. Xu, B., Jian, P., Zheng, H.F., Zou, H.B., Zhang, L.F., Liu, D.Y., 2005. U-Pb zircon
geochronology and geochemistry of Neoproterozoic volcanic rocks in the Tarim Block of northwest China: implications for the breakup of Rodinia supercontinent and Neoproterozoic glaciations. Precambrian Res. 136, 107-123.
Zhang, L.F., Jiang, W.B., Wei, C.J., Dong, S.B., 1999. Discovery of dolerite from the Aksu Precambrian blueschist terrane and its geological significance. Sci. China 42, 233-239.
Zhang, H., Zhang, W., 1985, Palaeomagnetic data, late Precambrian magnetostratigraphy, and tectonic evolution of eastern China. Precambrian Res. 29, 65-75.
Zijderveld, J.D.A., 1967. Demagnetization of rocks: analysis of results. in: Methods in Paleomagnetism D. W. Collision, K. M. Creer and S. K. Runcorn, eds., D. W. Collision, K. M. Creer and S. K. Runcorn, eds.: 254-286.
Figure and table captions
Figure 1. (a). Topographic map of Aksu area and study area. (b). Stratigrsphic column of the Asku area. (After Gao, et al., 1985; Zhang,et al., 1999), The thickness is not implied. (c). Stratigraphic correlation chart of Aksu and Kuruqtagh areas, Tarim basin. The dash lines show discontinuity of strata. (d). Succession of the section in Area I showing the paleomagnetic sampling details as well as the bedding attitudes of the Sugetbrak Formation and its underlying and overlying strata. (e). Simplified geology map of Area II showing the paleomagnetic sampling details. Thick black line shows the
road, thin black lines show major faults. Z: Sinian group. Cam: Cambrian. Q: the Quaternary Formation.
Figure 2. Magnetic mineralogical analyses. The upper row, (a), (d), (h) and (k), concerns IRM measurements; the middle row, (b), (e), (i) and (l), results from thermo magnetic experience; the lower row, (c), (f), (j) and (m), is representative magnetic hysterestic curves. The left two columns are samples from Area I, they are samples of Chigebrak Formation (left) and samples from the Sugetbrak Formation (right). The right two columns are samples of the Sugetbrak Formation from Area II, they are sedimentary
samples (left) and basalt samples (right).
Figure 3. Typical orthogonal vector plots (Zijderveld, 1967). Directions are plotted in tilt-corrected bedding. Black/white circles represent vector endpoints projected onto the horizontal/vertical plane. Numbers on the plots indicate particular temperature steps. NRM: natural remanent magnetization. Left
Figure 4. Equal-area projection of mean-site directions in geographic and stratigraphic coordinates. Diamond symbols stand for the directions from Area I and circle symbols from Area II with larger diamond and circle for their mean directions, respectively. Star: global stands for the average direction of 24 sites. Number 1, 2 and 3 show reverse, normal and their mean directions of Site 505, respectively.
Figure 5. Enkin (2003) DC fold test. (a) and (b). Progressive unfolding showing a significant clustering of magnetic directions after bedding corrections with 24 sites and 20 sites; (c) and (d). DC Slope: 110.0 ± 31.94% untilting, showing a positive fold test with 24 sites, and 119.04±36.10% untilting, showing a positive fold test with 20 sites.
Figure 6. Results of AMS measurements. (a) Plots of anisotropy degree (P’) vs anisotropy shape (T) of magnetic susceptibility for Area I (circle) and Area II (star), respectively. (b) and (c) Equal-area projection of K1 and K3 directions of the sedimentary sites included in area-mean direction calculations (see Table 2 for P’ and T definitions).
Figure 7. δ13C isotope line of the Sugetbrak Formation in Area I correlated to the δ13C line of the South China Block (Modified after He et al., 2006).
Figure 8. (a) (b) and (c) Paleogeographic reconstruction maps of Antarctica, Australia, Tarim, South China and India at ca. 600 Ma (after Macouin et al., 2004), ca. 760Ma (after Chen et al., 2004) and ca. 740Ma (after Huang et al., 2005) .
Table 1.
Summarized paleomagnetic results of this study
Site Lith Slong Slat n/N Polarity Dg Ig Ds Is k α95 Strike Dip Plat Plong Comment
Area I
X17 Upper Red sandstone 80°02′08″ 41°01′03″ 8/8 N 48.2 49.1 85.2 35.9 67.3 6.8 49 40 16.4 157.6
X18* Upper Red sandstone 80°02′08″ 41°01′03″ 0/6 – – – – – – – – Viscous
X19 Upper Red sandstone 80°02′08″ 41°01′03″ 8/8 N 40.9 47.3 74.8 39.6 95.4 5.7 46 35 25.7 161.7
X20 Upper Red sandstone 80°02′08″ 41°01′03″ 7/8 N 44.3 43.7 78.8 38.3 173.1 4.6 54 38 22.2 160.1
X21 Lower Red sandstone 80°02′28″ 41°01′12″ 5/6 N 38.9 41.4 77.2 39.7 27.3 14.9 56 42 24 160.2
X22 Lower Red sandstone 80°02′28″ 41°01′12″ 8/8 N 47.5 52.5 99.3 30.7 78.2 6.4 54 55 4 151.5
X23* Lower Red sandstone 80°02′28″ 41°01′12″ 0/6 – – – – – – – – Dispersed
X24a Lower Red sandstone 80°02′28″ 41°01′12″ 5/6 N 52.6 35.9 86.9 27.0 14.7 20.6 61 52 11.6 161.1
524 Lower Red sandstone 80°02′05″ 41°01′06″ 6/7 N 24.3 73.1 112.7 52.3 144.1 5.6 48.5 42 6.4 131.2
525 Lower Red sandstone 80°02′05″ 41°01′06″ 3/7 N 12.9 39.5 56.8 50.6 52.4 17.2 48.5 42 44 163.2
Site Lith Slong Slat n/N Polarity Dg Ig Ds Is k α95 Strike Dip Plat Plong Comment
527 Lower Red sandstone 80°02′05″ 41°01′06″ 6/7 N 49.0 56.7 94.2 38.2 22.6 14.4 48.5 42 10.9 150.9
528 Upper Yellow Sandstone 80°02′05″ 41°01′06″ 3/6 N 50.2 60.4 95.0 40.6 106.6 12.0 45.5 39 11.4 149.1
529* Upper Yellow
Sandstone 80°02′05″ 41°01′06″ 7/7 172.7 −44.2 224.8 −64.3 32.3 10.8 45.5 39 Permain
530* Upper Yellow
Sandstone 80°02′05″ 41°01′06″ 5/6 159.6 −48.6 228.5 −69.0 74.8 8.9 37.5 41 Permian
531 Upper Yellow Sandstone 80°02′05″ 41°01′06″ 4/6 R 196.8 −59.9 263.8 −57.7 36.6 15.4 47.5 37 37.3 174.8
532* Upper Yellow Sandstone 80°02′05″ 41°01′06″ 0/7 – – – – – – – – Dispersed 533* Upper Yellow Sandstone 80°02′05″ 41°01′06″ 7/7 161.5 −56.2 250.1 −75.8 72.4 7.1 47.5 37 Permian 534* Chigebrak Gray Limestone 80°02′17″ 41°01′01″ 0/7 – – – – – – – – Viscous 535* Chigebrak Gray Limestone 80°02′17″ 41°01′01″ 0/7 – – – – – – – – Viscous 536* Chigebrak Gray Limestone 80°02′17″ 41°01′01″ 0/7 – – – – – – – – Viscous 537* Chigebrak Gray Limestone 80°02′17″ 41°01′01″ 0/7 – – – – – – – – Viscous
Site Lith Slong Slat n/N Polarity Dg Ig Ds Is k α95 Strike Dip Plat Plong Comment 538* Chigebrak Gray Limestone 80°02′17″ 41°01′01″ 0/7 – – – – – – – – Viscous 539* Chigebrak Gray Limestone 80°02′17″ 41°01′01″ 0/7 – – – – – – – – Viscous Average 12 39.9 51.5 36.6 7.3 86.0 41.3 37.4 7.2 Area II
X31a Lower Red sandstone 79°27′37″ 40°52′37″ 4/6 N 42.1 71.0 126.0 49.9 15.1 24.4 64 44 −2.7 123.6
X32 Lower Red sandstone 79°27′50″ 40°52′13″ 5/6 N 148.0 −21.2 131.0 52.8 37.2 12.7 265 85 −3.1 118.6
S17 Lower Basalt 79°25′13″ 40°50′41″ 6/6 N 84.0 71.8 116.2 51.2 76.7 7.7 51 26 3.5 129.2
S18* Lower Basalt 79°25′13″ 40°50′41″ 5/6 206.6 38.2 197.8 10.7 31.3 13.9 78 33 Lightening
S20 Lower Basalt 79°25′13″ 40°50′41″ 4/7 N 28.5 67.1 93.6 72.2 62.6 11.7 72 23 31.6 118.7
S21 Lower Basalt 79°25′16″ 40°50′37″ 5/7 N 20.6 55.2 58.0 68.4 110.0 7.3 72 23 49.6 133.7
Site Lith Slong Slat n/N Polarity Dg Ig Ds Is k α95 Strike Dip Plat Plong Comment
S23 Lower Red sandstone 79°29′08″ 40°54′58″ 4/6 N 98.8 10.1 101.6 22.4 60.4 11.9 152.5 16 −1 153
S27* Lower Red sandstone 79°25′17″ 40°56′17″ 4/6 11.3 42.3 31.1 54.5 51.8 12.9 56 21 PEF
S28a Lower Red sandstone 79°25′17″ 40°56′17″ 4/6 N 52.0 51.2 76.9 48.0 21.4 20.3 56 21 27.9 153.8
505 Lower Red sandstone 79°24′23″ 40°56′55″ 3/6 N 114.0 44.6 124.7 41.1 161.0 9.7 102.5 12
2/6 R 298.1 −34.5 305.5 −30.4 102.5 12
5/6 M 115.8 40.6 125.1 36.8 112.0 7.3 102.5 12 −10.2 130.5
506* Lower Red sandstone 79°24′23″ 40°56′55″ 3/6 18.4 45.5 25.6 63.9 111.0 11.8 96.5 19 PEF
509a Upper Red sandstone 79°27′34″ 40°53′14″ 4/6 N 95.0 55.2 62.2 48.1 18.7 21.8 273.5 26 38.8 162
510* Upper Red sandstone 79°27′34″ 40°53′14″ 0/6 – – – – – – Viscous
511* Upper Yellow Sandstone 79°27′34″ 40°53′14″ 0/6 – – – – – – Viscous 512* Upper Yellow Sandstone 79°27′34″ 40°53′14″ 4/6 347.5 42.5 343.3 31.8 107.1 8.9 228.5 12 PEF 513* Upper Yellow Sandstone 79°27′34″ 40°53′14″ 0/7 – – – – – – Viscous 514* Upper Yellow Sandstone 79°27′34″ 40°53′14″ 6/7 164.9 −70.2 153.0 −54.3 35.9 11.3 227.5 17 Permian
Site Lith Slong Slat n/N Polarity Dg Ig Ds Is k α95 Strike Dip Plat Plong Comment
Sandstone
516 Upper Yellow Sandstone 79°27′34″ 40°53′14″ 5/7 N 61.0 20.3 53.7 21.5 27.3 14.9 233.5 19 34.4 186
517 Upper Yellow Sandstone 79°27′34″ 40°53′14″ 5/7 N 110.3 3.0 109.3 17.0 25.6 15.4 220.5 15 −8.5 150.1
518* Upper Yellow
Sandstone 79°27′34″ 40°53′14″ 0/6 – – – – – – Dispersed
520 Lower Red sandstone 79°25′36″ 40°56′26″ 6/6 N 38.8 42.5 46.9 45.8 50.7 9.5 64.5 9 49.3 174.1
521* Lower Red sandstone 79°25′36″ 40°56′26″ 0/6 – – – – – – Dispersed
Average 12 82.0 46.6 4.1 24.4
92.8 48.5 8.9 15.4
Total average (Areas I and II)
MeanA Areas I + II 24 59.5 51.2 6.3 12.7
89.0 44.8 14.4 8.1 19.1 149.7 (A95 = 9.3°)
Site Lith Slong Slat n/N Polarity Dg Ig Ds Is k α95 Strike Dip Plat Plong Comment
89.4 44.7 13.7 9.1
Sites with * were excluded from average direction calculation of MeanA. Sites with * and a were excluded from average direction calculation of MeanB. Abbreviations: Lith,
lithology; Slong/Slat, longitude and latitude of sampling site; n/N, number of samples used to calculate mean direction/number of demagnetized samples; N, R and M, magnetic normal, reversal and mixed polarities, respectively; Dg, Ig, Ds, Is, k and α95, declination and inclination in geographic and stratigraphic coordinates with statistic precision and the
radius that mean direction lies within 95% confidence, respectively; Plat/Plong, latitude and longitude of paleomagnetic pole with A95, 95% confidence.
Table 1. Summarized paleomagnetic results of this study.
Sites with * were excluded from average direction calculation of MeanA. Sites with * and ª were excluded from average direction calculation of MeanB.
Abbreviations: Lith, lithology; Slong/Slat, longitude and latitude of sampling site; n/N, number of samples used to calculate mean direction/number of demagnetized samples; N, R and M, magnetic normal, reversal and mixed polarities, respectively, Dg, Ig Ds, Is, k and α95, declination and inclination in geographic and stratigraphic coordinates with statistical precision and the radius that mean direction lies within 95% confidence, respectively; Plat/Plong, latitude and longitude of paleomagnetic pole with A95, 95% confidence.
Table 2.
Anisotropy of magnetic susceptibility data for the sites that are include in mean direction calculations
Site Lithology P T K1 K3
Dec Inc Dec Inc
X17 Red sandstone 1.04 0.71 165.7 6.9 151.4 80.4 X19 Red sandstone 1.05 0.68 60 7.1 218.8 79.8 X20 Red sandstone 1.04 0.67 36.8 4 251.6 84.1 X21 Red sandstone 1.07 0.68 71.8 10.6 302.2 73.8 X22 Red sandstone 1.02 0.64 107.3 11.4 218.3 71.4 X24 Red sandstone 1.04 0.23 131.6 13.4 247.4 66.3 524 Red sandstone 1.02 −0.29 239 0 329 20 525 Red sandstone 1.02 0.39 252.8 4.8 114.8 73.7 526 Red sandstone 1.01 0.09 46 12.2 237.2 75.2 527 Red sandstone 1.02 0.32 75.8 4.8 177 81 528 Yellow Sandstone 1.02 0.59 221.2 12.5 208 73 531 Yellow Sandstone 1.01 −0.1 74 24.5 334.5 20.5 X31 Red sandstone 1.01 0.21 138.8 20.8 280.8 34.8 X32 Red sandstone 1.05 −0.05 211.8 18.2 219.4 61 S23 Red sandstone 1.04 0.66 113.1 5 202.3 83 S28 Red sandstone 1.11 0.04 160.3 73.2 303 11.8 505 Red sandstone 1.09 −0.16 265.3 77 116.5 6.7 509 Red sandstone 1.01 0.3 184.2 4.2 165.2 80.8 516 Yellow Sandstone 1.04 0.47 265.4 6.4 172.4 77.4 517 Yellow Sandstone 1.01 −0.07 193.2 5.4 198.8 60.8 520 Red sandstone 1.09 0.59 106.7 69.2 180.8 5.5
P = exp{2[(ln K1 − lin Km)2 + (ln K2 − lin Km)2 + (lin K3 − ln Km)2]1/2}, and
their average. K1: magnetic lineation; K3: pole of the magnetic foliation; Dec, Inc: declination,
inclination, respectively, in degrees.
Table 2 Anisotropy of magnetic susceptibility data for the sites that are include in mean direction calculations.
P'= exp 2 (ln K1− linKm)2 + (ln K 2 − linKm) 2 +(linK 3 − ln Km) 2
[
]
1/ 2{
}
, and T = 2ln(K[
2 / K3) / ln(K1/ K3)]
−1, where K1, K2 and K3 are principal axes of the magnetic fabrics and Km is their average. K1: Magnetic lineation; K3: Pole of the magnetic foliation; Dec, Inc: declination, inclination, respectively, in degrees.