HAL Id: insu-02952618
https://hal-insu.archives-ouvertes.fr/insu-02952618
Submitted on 29 Sep 2020
HAL is a multi-disciplinary open access
archive for the deposit and dissemination of
sci-entific research documents, whether they are
pub-lished or not. The documents may come from
L’archive ouverte pluridisciplinaire HAL, est
destinée au dépôt et à la diffusion de documents
scientifiques de niveau recherche, publiés ou non,
émanant des établissements d’enseignement et de
A full experimental and numerical modelling of the
practicability of thin foam barrier as vibration reduction
measure
Mehran Naghizadehrokni, M Ziegler, J Sprengel
To cite this version:
Mehran Naghizadehrokni, M Ziegler, J Sprengel. A full experimental and numerical modelling of the
practicability of thin foam barrier as vibration reduction measure. Soil Dynamics and Earthquake
Engineering, Elsevier, 2020, 135, pp.106416. �10.1016/j.soildyn.2020.106416�. �insu-02952618�
A full experimental and numerical modelling of
the practicability of thin foam barrier as
vibration reduction measure
M. Naghizadehrokni
1, M. Ziegler
1, and J. Sprengel
2 1RWTH Aachen University, Department of Civil Engineering,
Chair of Geotechnical Engineering, Aachen, Germany
2V¨
ossing Engineer, Former GiB RWTH Aachen University
September 10, 2020
Abstract
This paper presents the performance of geofoam-filled trenches in miti-gating of ground vibration transmissions by the means of a full experimen-tal study. The results are interpreted in the frequency domain. Fully auto-mated 2D and 3D numerical models are applied to evaluate the screening effectiveness of geofoam-filled trenches in the active and passive schemes. Experimental results are in good agreement with the prediction of nu-merical modelling. The validated model is used to investigate the influ-ence of geometrical and dimensional features on the trench. In addition, three different systems including single, double and triangle wall obsta-cles are selected for analysis, and the results are compared for various situations. The parametric study is based on complete automation of the model through coupling finite element analysis software (Plaxis) and Python programming language to control input, change the parameters, as well as to produce output and calculate the efficiency of the barrier. The results show that the depth and the width of approximately 1λrand
0.2λr, respectively are enough to reach the acceptable amount of efficiency
for the active isolation for all three systems. For the passive scheme, the role of depth can be ignored for the single and double wall barriers, while depth plays a significant role for the triangle wall system.
1
Introduction
In metropolitan cities, man-made ground vibrations generated by external dy-namic sources including traffic, blasting, machine foundations and other con-structional activities have recently become a major concern for the nearby struc-tures and inhabitants. Most of the transmitted vibration energy is propagated by Rayleigh waves close to the soil surface. The rest of the energy is transmitted by the body waves [1]. Near-surface vibration can be a major problem for the surrounding buildings and their inhabitants. Therefore, implementing a wave barrier in the transmission path is a suitable solution as it allows scattering
the ground-borne vibrations [2]. The barrier intercepts the dispatched waves through a complex mode of wave interactions including, reflection, refraction, diffraction and wave interference. Vibration screening is classified into two cat-egories including the active scheme, in which the obstacle is installed near the source of vibration, and the passive scheme, in which the trench is constructed far away from the vibration source. On the other hand, the applicability of the wave barrier is classified in terms of open or in-filled trenches [3].
Several studies including both field tests [4, 5] and numerical modelling [6–8] have been carried out in order to evaluate the efficiency of the wave barrier in wave attenuation. Woods [9] was one of the first to perform a full experimental test for evaluating the efficiency of open trenches. He suggested that a wave barrier should reach at least 75% mitigation in screening of incoming waves to be deemed as efficacious. In practice, however, open trenches are not applicable in many cases for a longer time due to difficulties in construction and stability problems. In such cases, in-filled trench obstacles are generally used.
A series of field tests are conducted by [10, 11] for finding the screening effec-tiveness of open and geofoam-filled obstacles and found that the performance of geofoam-filled trench reached 68 and 67%, respectively. Multiple rows of geofoam-filled barriers are employed for assessing the applicability of trench in frequency domain [12]. They proved that increasing trench depth, to more than one wavelength has only negligible affect on screening performance in the pas-sive scheme. Celebi et al. [13] described the results of experimental studies to compute the screening efficiency of open, stiff and soft barriers in the case of active and passive schemes. The observations illustrated that the passive isolation is more effective than the active isolation and softer back-fill material can be more effective in attenuating the incoming waves in comparison with the stiff materials. In addition, a centrifuge parametric investigation is accom-plished by [14] to examine the effect of dimensional and geometrical factors on the geofoam-filled trench in the mitigation of incident waves. The results of the study showed that the screening performance is dependent on the trench depth. In addition, numerical techniques including the finite element method (FEM) and the boundary element method (BEM) can be used as powerful tools to study the screening performance of wave barriers. Beskos et al [15–17] devel-oped a BEM model to determine the screening capability of open and concrete-filled trenches in homogeneous and layered soil. Ahmad and Al-Hussaini [18] conducted an extensive parametric study to analyse the influence of different geometrical and material parameters on the screening efficiency of rectangu-lar open and concrete-filled obstacles. Finally, they developed a simple model for vibration isolation in active and passive schemes. Haupt [19, 20] also used numerical modelling for assessing the vibration isolation performance. He sug-gested that the trench depth should be at least 80% of the R-wavelength (λr) to
reach a successful attenuation. A FEM is developed to evaluate the efficiency of water and geofoam-filled trenches [21, 22]. They observed that the depth of the barrier is the governing factor in increasing the efficiency of the barrier and width and length of the trench do not play a significant role in screening performance. Majumder et al. [23–25] performed some numerical modelling in order to evaluate the efficiency of the geofoam-filled trench. They suggested the normalized depth equal to 1 as the optimum value for reaching the highest value of the efficiency. In addition, they stated that increasing the frequency of the vibration source results in increasing the efficiency of the trench. Qiu et al. [26]
established a 2D numerical model for a comparative study on vibration isola-tion effectiveness and developed a model for optimizing various dimensions of the barrier. Concerning different configurations of the barriers, Saikia [27] and Schevenels et al. [28] considered double wall barriers, Esmaeili et al. [29, 30] evaluated the effectiveness of V-shaped and step-shaped trenches and Alzawi et al. [31] conducted a comprehensive study for computing the performance of geofoam-filled barriers in the form of box-walls, single and double wall systems. Studying the literature revealed that a full experimental test and a parametric investigation to examine the efficiency of various configurations of geofoam-filled trenches are required. This paper deals with filling this gap through a field test and a comprehensive parametric study.
The results of the field tests for evaluating the efficiency of geofoam-filled barrier in mitigating the incident waves in the frequency domain are presented in sec-tion 2. 2D and a 3D finite element models are developed and the validity of the models are compared with the results of the full experimental test as shown in section 3.1. Subsequently, different configurations including single, double and triangle wall systems are selected for evaluating the performance of vibration screening in the active and passive schemes in sections 4 and 5, respectively. Various parameters including geometrical parameters and dimensional factors that govern the screening performance are considered for more assessing.
2
Field Test
2.1
Site Investigation
A full experimental test has conducted [32] to analyse the efficiency of the geofoam-filled trench in screening dispatched waves. The subsoil properties and the location of the field test are one the most important features. The main criteria for selecting the site location are considered as homogeneity of the soil, easy accessibility to the test site and possibility of the implementation of the trench. For these purposes, the location of the test site has selected in a gravel pit based on a flat area with dimensions of approximately 40m × 60m, located in Geilenkirchen, a town in North Rhine-Westphalia.
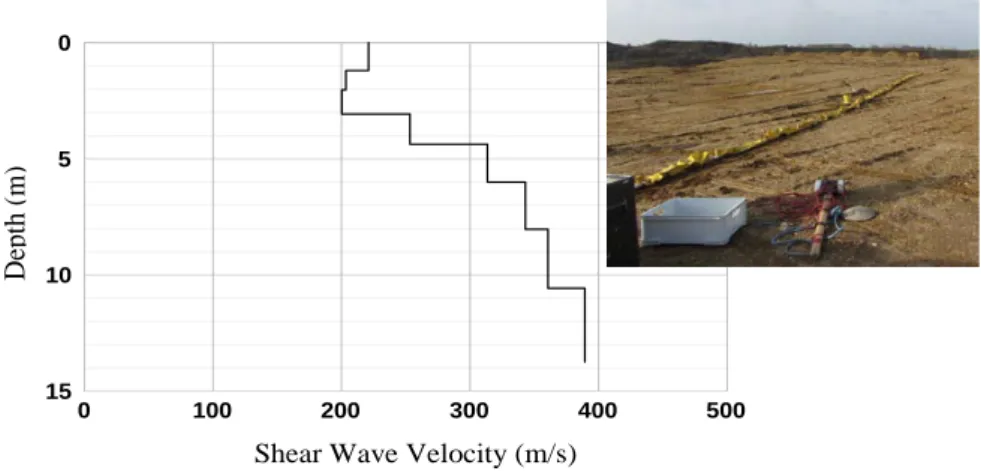
The soil analysis consisted of soil classification and has done on some samples from different depths. The result of laboratory test of the soil demonstrated that the subsoil is a mixture of sand and gravel up to a depth of at least 15m. According to DIN 18196, the soil is classified as intermittent graded sand. The medium soil density was determined to (ρ = 2g/cm3).
The Multichannel Analysis of Surface Waves method (MASW) was used to determine the dynamic elastic material parameters, which are key factors for describing the soil dynamic behaviour of the subsoil. MASW is a geophysical procedure for determining the depth-dependent profile of the propagated shear wave velocity. The data were recorded over a total of 48 geophones, which were laid out at a distance of 1m, and registered by a seismograph. Fig. 1 shows the geophones in the field test and the determined profile of the propagation velocity of the shear wave over the depth as an average value over the entire measuring section.
T
ie
fe
t
[m]
Ausbreitungsgeschwindigkeit der Scherwelle vs[m/s]
15 5 0
10
0 100 200 300 400 500
Shear Wave Velocity (m/s)
D
ept
h (
m
)
Figure 1: Shear wave velocity profile of the site
2.2
Field Test Method and Equipment
A shaker from Baudynamik Heiland & Mistler GmbH was used (see Fig. 2A), which allows to produce a harmonic excitation of the ground [33]. The shaker was founded on four steel plates and the overall dimensions of the shaker were 72 ∗ 72cm. The servo-hydraulic shaker simulated the requested objects, in this case, harmonic load in the frequency range of theoretically 0.01 to 110Hz with• The maximum force amplitude is about 20kN , but the dynamic force amplitude is about 15kN . The force amplitude generated in the field test was constantly 5kN in the frequency range from 10Hz to 110Hz, but only the range from 20Hz to 80Hz was used for trench efficiency evaluation [32]. The measurement of the
Figure 2: Vibration source: (A) Shaker structural dynamics Heiland & Mistler GmbH, (B) Vibration sensor
vertical soil particle velocity had been done two times, before installation the trench and one after implementation of the geofoam-filled barrier. The measur-ing chain in the field test consisted of the vibration sensors includmeasur-ing geophone and accelerometer shown in Fig. 2B, which transmitted their data to a mea-suring computer. The transferred data were analysed by MESSI, a program developed by the Department of Structural Mechanics at RWTH Aachen
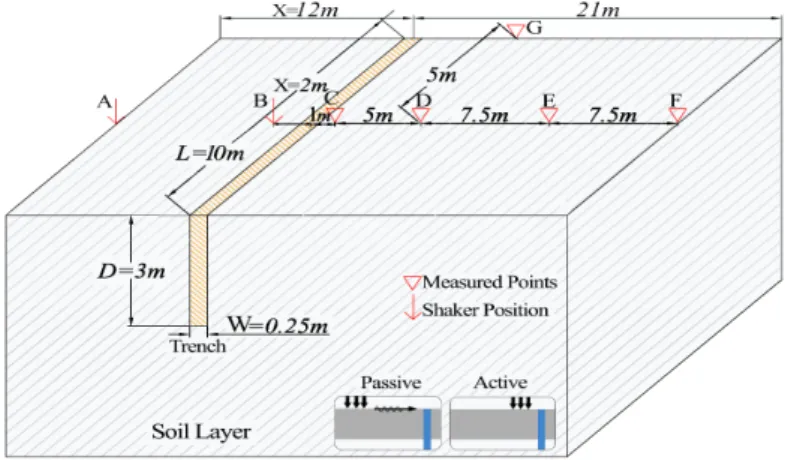
Uni-versity for signal acquisition and processing. Some distinct points were selected for installing vibration sensors with different distances from the source of vi-bration and the obstacle. Fig. 3 illustrates the selected measuring arrangement including the positioning of the vibration source, the geofoam-filled barrier and the vibration sensors, respectively. The shaker was located at two different
dis-Figure 3: Measuring arrangement
tances from the trench. To investigate the effectiveness of the obstacle for both situations, the vibration source had appropriately positioned relative to the bar-rier. Due to the limited number of available vibration sensors, seven measuring points were selected per measurement series, with measuring points A and B located directly on the shaker for the passive and active isolation, respectively. An approximate propagation velocity of the R-wavelength at the surface of vr = 200m/s and a minimum and maximum examined frequency of 20 and
100Hz leads to a wavelength of λr = 10 and 2m. Therefore, the position of
vibration source was chosen 2m for the active isolation and 12m for the passive isolation, respectively. Excavating a trench for mitigating of incident waves was the next step after measuring the vertical soil particle velocity in the absence of the barrier. Most of previous studies [8, 15, 34] stated that a normalized depth of 0.8λr is enough to reach acceptable value of the efficiency. Therefore, an
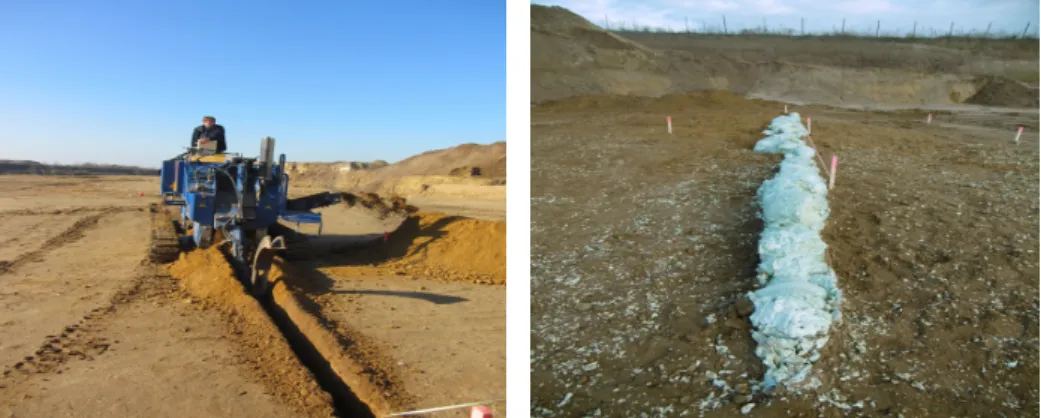
attempt was made to reach this depth during the experimental test. A wheel trencher device was used for digging the trench with the dimensions of 3.2m depth, 20cm width and 10m length. However, the excavating process to reach this depth failed because of facing hard soil in some sections. Therefore, the excavated depth of the barrier was between 2.8 − 3.2m and the average depth of 3m was considered for whole trench. The low stability of the trench due to the kind of soil resulted in a very short stability of the barrier. Therefore, the foam was injected immediately after excavating the trench. The device during digging the trench and final geometry of the injection body is shown in Fig. 4. The geofoam material for filling the barrier was a PU foam from Uretek Deutschland GmbH that could be injected in the trench without any resistance and expanded freely; all these factors lead to a geofoam with very low density.
A laboratory test was carried out for finding the dynamic properties of the geo-foam. The results showed a medium density of 0.61kN/m3, shear wave velocity
of 330m/s and poison’s ratio close to zero (0.01).
Figure 4: Wheel trench device and injection of geofoam
2.3
Test Results and Discussion
The test results of the field-test are evaluated in terms of the vertical vibration velocities of the soil, which are measured in the time domain and transmitted into the frequency domain by applying Discrete Fourier Transformation (DFT). The results are presented in the frequency domain. An advantage of represent-ing the results in the frequency domain is to visualize the wave interference influences. The final assessment of the effectiveness of the trench is made by comparing the two measurements.
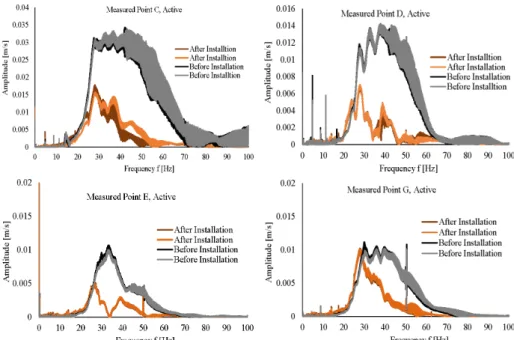
Result of full experimental study for all measured points beyond the geofoam-filled trench are analysed and the results are presented in following figures. In order to ensure reliability of the results, the measurements have been done two times for both before and after installing the barrier. Fig. 5 shows a significant attenuation for almost all measured points for the frequency between 30 and 60Hz by implementing the geofoam-filled trench. The results shows the highest amount of mitigation for the first point after the trench (point C) in comparison with other points. As the frequency of applied load increases, the vertical soil velocity amplitude reduces dramatically and then gradually reaches to a stable value after a frequency of 60Hz. The system effectiveness is increased from 37 to 60% by increasing the frequency from 30 to 40Hz for point C. A practical comparison can be done between the screening of incident waves for measured points of D and G, where are located at the center and beside of the source in Fig. 3, respectively. The results reveal that we have the highest amount of mitigation in the centreline of the trench in comparison with other areas. The efficiency of the frequency of 40Hz for both points D and G are 65 and 35%, respectively, which shows a considerable difference.
However, there is not any attenuation effect for the frequency less than 20Hz and it seems that the isolation system is not practical for lower frequencies. Athanasopoulos et al. [35] stated that the attenuation of R-wave amplitude is frequency-dependent and it increases exponentially with the frequency due to both radiation and material damping. Therefore, low frequency of the load
Figure 5: Representation in the frequency domain: Measuring points C, D, E, G (Active Isolation)
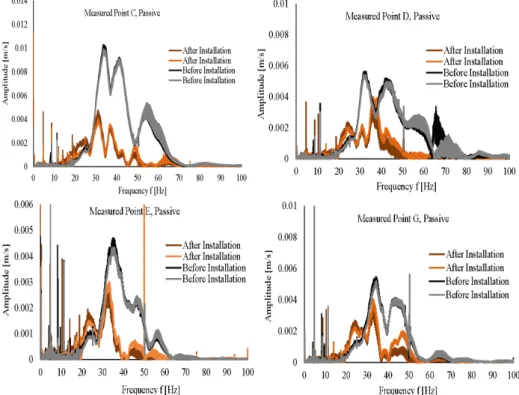
results in less attenuation of the propagated waves in the soil. This issue dis-appears the effectiveness of the trench in mitigating the waves with large R-wavelength (which is equal to low frequency). The same statement can be applied for the reason of not practicability of the trench in high frequencies. Increasing the frequencies result in losing of the wave energy until disappearing. Therefore, there is not any difference between amplitude of the vertical soil par-ticle velocity before and after installing the trench. The results of various points for the passive isolation are presented in Fig. 6. The area immediately after the trench has the highest screening performance. The screening performance in attenuation of incident waves increases for the frequency range between 30 to 60Hz, whereas this frequency range decreased to 35 − 50Hz for point E. How-ever, some unexpected peaks and valleys are observed in vertical soil velocity amplitude of 50 and 40Hz for points C and D, respectively.
Baidya, et all [36] investigated change of amplitudes of vibrations in layered soil and they stated that many soils in nature exhibit an increase in shear modulus with depth and this issue can be recognized as a reason for distinct peaks and valleys. The incoming waves may reflect and refract at the interfaces of soil layer and they can superpose with surface waves in the same phase and originate a bigger wave, which cause amplification in vertical response of the soil. As it is already mentioned in section 2.2, we faced a hard soil during the excavation and for this reason the depth of the trench could not reach the target value (3.2m). It means that we have almost a full reflection of incoming waves. Therefore, the unexpected discrepancies in the result can be explained by superposition of surface waves and reflected waves [10]. In addition, Haupt stated that the reflection and refraction of the R-wave energy generates a typical interference pattern, in which the maximum or minimum points usually appear at intervals
of half of R-wave [19]. By following the intervals for each minimum/maximum point in the figure, it can be seen that the intervals follow the rules of Haupt. This pattern is generated by the superposition of waves.
Figure 6: Representation in the frequency domain: Measuring points C, D, E, G (Passive Isolation)
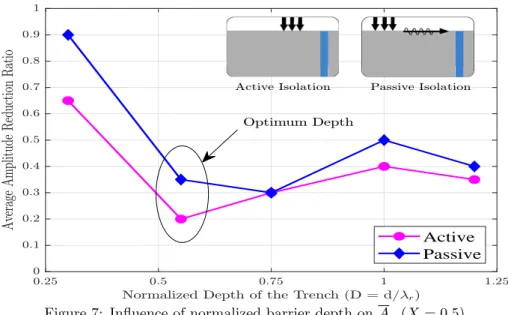
Frequency domain analysis of the results enables to monitor normalized trench depth in terms of R-wavelength. Changing the frequency of the load leads to changing the length of R-wave since the shear wave velocity of the soil is constant. Therefore, the effectiveness of the geofoam-filled trench is presented as a normalized depth in Fig. 7. The results show that increasing D results in decreasing the value of (Ar), which means increasing the efficiency of the trench.
The lowest value of (Ar) is achieved for a normalized depth of approximately
0.6, which agrees with the result of [11].
Average amplitude reduction ratio is expected to decrease with increasing the depth of the trench. However, some amplifications in (Ar) are observed after the
normalized depth of 0.6. Haupt stated that distinct peak can occur when shear wave velocity of the soil increases proportional with the depth. In addition, Mas-sarsch [4] indicated that refracted waves from the trench and transferred waves beneath the trench can superpose in the same phase and originate a bigger wave, which can cause amplification. Since the soil profile in experimental test is non-homogeneous in terms of increasing shear wave velocity, the unexpected distinct peaks can be explained by superposition of surface waves.
Active Passive
Figure 7: Influence of normalized barrier depth on Ar (X = 0.5)
3
Numerical Modelling
Since the model is largely affected by the transmitted and reflected waves from the boundary of the model, it is important to keep the region of interest enough far from the reflecting boundary. Therefore, the dimensions of the model are selected as (50, 20, 20 m) and (70, 25 m) in the case of active and passive system, respectively. The soil is modelled as a homogeneous and isotropic half space. The linear elastic model is selected for the soil since the amplitude of generated vibrations are small and the soil does not experience the development of plastic deformations in the region of consideration. In order to applying a special boundary condition, viscous boundaries are applied to the bottom and right sides of the 2D and 3D models and at Y max direction for 3D model, too. A viscous boundary condition, which was introduced by Lysmer and Kuhlmeyer [37] consist of the viscous dampers applied in X, and Y (for 2D), and Z (for 3D) direction along the boundary. Relaxation coefficients (C1 and C2) are introduced in order to improve the effect of absorption. Improving the wave absorption in the normal and tangential direction is done by coefficients C1 and C2, respectively. The values for both coefficients are selected as 1.
Plaxis uses a global meshing parameter, which is called average element size for showing the quality of the mesh. This parameter is calculated based on the dimensions of the model and the number of elements. The average element size (Ie) of 0.5 is enough for reaching acceptable results and satisfying the criteria of
Kuhlemeyer and Lysmer [37] for assuming the average element size less than to one-eight of the wavelength associated to the maximum frequency component of the input wave. The vibration source is modelled as a vertical harmonic load with the amplitude of 1 and frequency of 50Hz. The dynamic time interval is considered as 0.5s, which is enough to allow the passage of dynamic load. The steel plate under the shaker is modelled as plate and the shaker weight is consid-ered as a uniform distributed load with magnitude of 1kN/m2. However, weight
it does not play a significant role in vibration attenuation results and the differ-ence for the efficiency of trench between zero and non-zero foundation weight is 1.5%, which can be neglected [11, 34, 38].
A large number of models are developed for the parametric study through chang-ing the governchang-ing factors of the trench. Creatchang-ing all models manually is a time-consuming process. In order to save the calculation costs, a script is developed for coupling the finite element model (Plaxis) with Python language. This script allows the user to control both the input and the output of the model via an external Python handler. The main advantage of the automation is accelerating the pace of the parametric study. The input of the script corresponds to the values selected for different parameters, including the depth D, width W , length L, distance between the walls S and the location X. Three different systems are selected including the single, double and triangle wall for assessing the effect of the shape of the trench on the screening performance. The script starts by cre-ating a borehole and subsequently installs the trench, defines different phases, runs the model and calculates the efficiency of the trench. The entire process is executed automatically as shown in Fig. 8. Different functions are defined for excavating the trench with different configurations including the single, double and the triangular wall. An average amplitude reduction ratio factor (Ar) is
used for finding the efficiency of the trench beyond the trench. The value of (Ar)
is the average value of vertical soil velocity before and after the installation of the trench. Finally, the data for each system are stored in an Excel file. The created Python script for 2D and 3D model are provided in the Appendix.
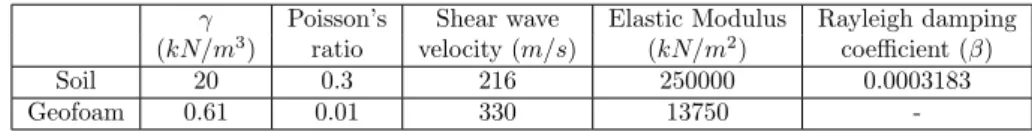
The soil properties for the following analysis are considered the same as those measured in the field test, which are presented in table 1. The con-stant frequency of f = 50Hz is selected for the applied load, which results in R-wavelength equal to 4m. In addition, the linear elastic behaviour is used for both the geofoam and soil in the further calculations. The parameters α and β are Rayleigh coefficients that determine the effect of mass and stiffness in the damping of system, respectively. In mass proportional damping, damp-ing forces are generated by velocities of the model and simulated the model’s movement through a still viscous fluid. Therefore, motion at points within the model cause damping. It should also be observed that the mass proportional damping would give damping due to rigid body motions. In stiffness propor-tional damping, damping is generated by strain rates. Therefore, the damping is more related to the material in comparison with motion of the model. Hence, stiffness proportional damping is used in this finite element model [14]. In ad-dition, in many practical soil related problems, α is ignored since it can lead to undesirable result if a large mass has been introduced into the model [39–41].
Table 1: material properties of Proposed FE model
γ Poisson’s Shear wave Elastic Modulus Rayleigh damping
(kN/m3) ratio velocity (m/s) (kN/m2) coefficient (β)
Soil 20 0.3 216 250000 0.0003183
3.1
Experimental Validation of Finite Element Method
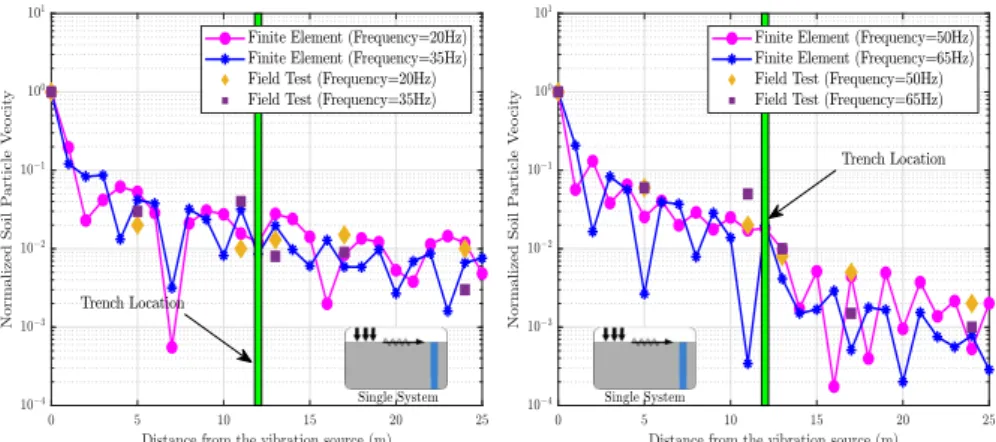
The developed model has been validated using the results of the field test for the active and passive isolations. The measured and the calculated wave attenuation curves are depicted in Figs. 9 and 10 using a logarithmic scale for different excitation frequency including, 20, 35, 50 and 65Hz, respectively.
Figure 9: Validation of numerical modelling based on the result of field test, active isolation, (D=3m, W=0.25m, L=10m, X=2m)
Figure 10: Validation of numerical modelling based on the result of field test, passive isolation (D=3m, W=0.25m, L=10m, X=12m)
The FEM results are in line with the trends in the experimental results and there is a reasonable agreement between the normalized vertical soil particle ve-locities, obtained for both the active and passive cases. Nonetheless, unexpected valleys are visible in the results. Propagated waves through and underneath the geofoam-filled trench are sometimes in or out of phase. This results in a destruc-tive interference of waves and creates valleys in numerical modelling results [21]. Another reason of observing some irregular peaks in the results is the less nor-malized distance between the points for presenting the numerical modelling, which is 0.25. This distance results in presenting the results as detailed as possible and showing all irregularities that may happen for the area after the trench. The same figure has been illustrated with normalized distance of 0.5
and fewer irregularities have been observed with new distance but the results of this distance is not presented here.
Therefore, the model developed in this study, including the wave absorbing boundary, adequately predicts the vibration propagation problem for the case of the geofoam-filled trench.
4
Active Isolation
A comprehensive parametric investigation is carried out to evaluate the effec-tiveness of different isolation systems including the single, double and triangular walls as the wave barriers for the active isolation due to the harmonic load in the vertical direction. Results of the detailed parametric investigation are pre-sented and some applicable recommendations are suggested for designing the wave barriers.
The parametric study begins with considering the different normalized values with respect to the R-wavelength for parameters of the trench including the depth D (from 0.5 to 2.5), the width W (from 0.0625 to 0.25) and the length L (from 0.625 to 5), respectively. All parameters are normalized with respect to the R-wavelength. The different geometrical parameters are considered to be the same for all configurations in this paper. Three different normalized locations including 0.5, 1.25 and 2 are selected for computing the efficiency of the geofoam-filled trench. Since the efficiency of the barrier for all three systems is not affected by the location of the trench, the result of one location (0.5) is presented.
4.1
Single Wall System
The normalized soil particle velocity before and after installing the trench was compared for an area beyond trench. The geofoam-filled trench was installed at the normalized location of 0.5. The results, which are not presented here showed that there is not any considerable difference after distance of 7.5λr for
both with and without trench for the area beyond the barrier. This leads to use 7λr for the screened zone for calculating Ar. This value is selected for all
systems in the active scheme.
4.1.1 Effect of Trench Dimensions
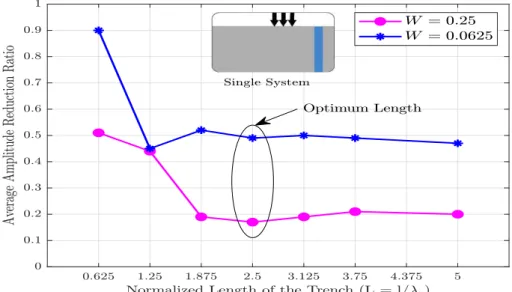
Fig. 11 shows that Ar decreases dramatically, which is the result of increasing
the normalized length from 0.625 to approximately 2.5. It is apparent from the figure that the normalized length beyond around 2.5 does not create any changes and may be conservatively assumed to remind unchanged thereafter. The same parametric study has been applied to other systems with the same results. Therefore, the normalized length of the trench is considered as 2.5 for other systems as well. The influence of varying the depth of the EPS Geofoam wave barrier is studied and the results are presented in Fig. 12. We achieve a considerable amount of wave attenuation by increasing the depth of the barrier from 0.5 to 1 for all widths. A gradual increase or decrease in wave attenuation is observed when increasing the normalized depth up to 1. It is observable that
Figure 11: Influence of normalized barrier length on Ar (X = 1.25, D = 1.25)
there are not significant discrepancies after this depth. Hence, the depth of 1 is defined as the optimum depth for all widths for blocking a major portion of incoming waves. The optimum D has a direct relationship with the width of the barrier.
Fig. 13 shows that W plays a significant role in screening efficiency of the geofoam-filled obstacle. It is apparent that in general the wave attenuation reaches its maximum amount at a W value around 0.25. For wider trenches (W > 0.2), the effect of W is negligible and can be ignored. Increasing the width of the barrier means having more distance between the two sides of the obstacles, which is leading to additional geometric discontinuities in the boundary area and results in a further refraction phenomena of the incoming R-waves.
Figure 13: Influence of normalized barrier width on Ar(X = 0.5)
4.2
Double Wall System
Attenuation of incident waves through a double wall system may be advan-tageous in circumstances where the implementation of a single wall system is difficult because of unrealistic depth. Using a pair of geofoam-filled barriers may possibly require lower depth in comparison with the single wall system. The efficiency of the double wall system is compared to a single wall with a thickness of 2W , having the same width, depth and length as the single wall obstacle. Therefore, the width of both walls are considered as one width, which is the normalized width W for both trenches. At the first step, a parametric study is investigated for finding the optimum spacing between the barriers to achieve the best performance. A parametric study has been done to find the optimum space between the wall and the normalized space of 0.5 is selected for this parametric study. However, the result of the parametric study is not pre-sented in this paper. This space is verified with the results of [31] for optimum distance between trenches.
4.2.1 Effect of Trench Dimensions
The information of Fig. 14 shows that D governs the wave screening for the normalized depth between 0.5 and 1.25 for all widths. The optimum depth of almost 1.25 is selected for all barriers. The results show that D plays a more significant role for narrow trenches than for wider trenches.
At the corners of the trench, mode conversion, that is converting R-wave to body wave occur, due to passing the incoming waves through the edges of the obstacle into the region behind this. Since the diffraction effect is low for a nar-row trench (W = 0.0625), due to the shorter distance between the two corners of an obstacle, the effect of D is more visible. For wider trenches (W > 0.0625), the influence of the diffraction phenomenon is greater than the effect of D. All of these issues indicate that the diffraction phenomenon plays an important role in the wave attenuation process for the double wall system.
As seen in Fig 15, Ar decreases dramatically by increasing the normalized
Figure 14: Influence of normalized barrier depth on Ar(X = 0.5)
width of the trench from 0.0625 to around 0.2. Thereafter, it remains at a constant value while W reaches to 0.375. An optimum width of almost 0.2 is selected for achieving the efficiency of approximately 70% and 80%. In addition, the influence of W is lower for barriers with D higher than 0.75 and the graphs of deeper trenches follow lower slopes for reaching the optimum width (0.2) from the start point (W = 0.0625).
According to developed theory by [42], the energy of R-wave in a region be-tween the ground surface and the R-wavelength (at normalized depth of the trench) is partially reflected at the zone of wave shadow. The R-wave energy passing beneath the obstacle creates a new R-wave at some distance beyond the barrier. The energy of the passing R-wave creates vibrations in the crucial zone. Increasing the width of the trench blocks more incoming waves and lead to passage fewer incident waves.
Figure 15: Influence of normalized barrier width on Ar(X = 0.5)
4.3
Triangular Wall System
A large part of the energy of a dispatched wave is in the form of R-wave. In addition, the amount of transferred energy by incident waves from an interface to the screened zone is a function of the incident angle. The ratio of the reflected to transferred R-wave energy is a function of the corner angle of the trench. The angle of the barrier wall and the ground surface is recognized as one of the most important factors in distributing energy among the waves. Moreover, as discussed in the previous sections for the single and double wall systems, the normalized width of the barrier appears to be one of the most important parameters that will govern the screening effectiveness of the trench. We achieve more wave attenuation by increasing the width of the trench even in the case of shallow trenches. For a proper comparison between all configurations, the triangular system is considered with the same depth and the same cross-sectional area as the single and double wall trench; however, the width of its trench is different from that of the other two systems.
4.3.1 Effect of Trench Dimensions
As shown in Fig. 16, increasing the normalized depth of the trench from 0.5 to almost 1.25 for the narrow trench leads to an increase in the efficiency of the trench. However, if the width of the trench increases (W > 0.25), a smaller decrease in Ar is visible in comparison with narrow trenches. A normalized
depth of 1 and 1.25 is considered for optimum depth to achieve an acceptable amount of wave attenuation for narrow and wider trenches, respectively.
Figure 16: Influence of normalized barrier depth on Ar(X = 0.5)
Fig. 17 shows the influence of W on screening performance. A wider trench is sufficient (for D < 0.75) for reaching an acceptable level of screening perfor-mance (around 75%), while by increasing the normalized depth of the trench (D > 0.75), a slender barrier is needed for the effective trench (W = 0.25). In-creasing the depth of the trench means hindering more incoming waves. For the shallow trench, as the corner of the barrier is near to the ground surface, the role of mode conversion of R-waves into body waves becomes apparent. However, in the case of deeper trenches, the corner of the trench move further into the soil. Therefore, the effect of the diffraction, which is resulting of passing the wave around a trench edge (trench corner) becomes smaller. Thus, a slender obstacle is needed to achieve an admissible amount of vibration for deep trenches.
Figure 17: Influence of normalized barrier width on Ar of EPS Geofoam wave
5
Passive Isolation
A 2D time domain finite element model is established for presenting the result of the parametric investigation. Increasing the normalized distance between the obstacle and vibration source can lead to making R-waves more prevailing in comparison with body waves. [3, 18]. If the barrier encounters plane waves, a plane strain model can present reliable results for calculating average amplitude reduction ratio. Another reason is saving the computational time. Since the geometry of passive is bigger than active model, analysing several models would require a lot of time. In addition, several researches [11, 26] showed that the result of 2D and 3D models are in acceptable agreement. Different parame-ters including trench depth, width and location are considered for studying the effectiveness of the trench.
5.1
Single Wall Barrier
The variation of the barrier’s dimensional factors (including depth and width) is determined in the same way as in the active isolation scheme. However, the geometric factor (including distance between the obstacle and vibration source) is determined to be 3. The reduction zone study of the single wall trench, which is not presented in detail, showed a considerable reduction in vertical ground displacement before and after installing the geofoam-filled trench for a normalized distance of 10, which is selected for calculating Ar.
5.1.1 Geometric Factor Study
The result of Aras a function of W is plotted in Fig. 18. A careful study of this
figure reveals that there is no substantial relationship between the computed Ar value and the normalized depth. On the other hand, increasing the wall
Figure 18: Influence of normalized barrier width on Ar(X = 3)
thickness leads to further scattering of the ground vibrations generated by source of disturbance. A reduction of approximately 60% is achieved by increasing W
from 0.0625 to 0.25 for almost all trench depths and it seems that W = 0.25 is the optimum width for achieving a reasonable amount of wave attenuation. An increase in trench thickness creates more discontinuity at the ground surface with different dynamic properties and this difference creates a diffraction in incident waves.
5.2
Double Wall Barrier
Fig. 19 shows that Ar is not affected by the trench depth and even increasing
W cannot create any change in the influence of D on Ar. Some of the incident
R-waves reflect downward to the left of the obstacle after encountering the left side of first wall and the remaining one transmit to the right of the barrier. Subsequently, the transmitted R-waves reflect again through the discontinuity at the second wall. In fact, the diffraction and mode conversation due to the corners of a pair of trenches play more significant role in decaying the incom-ing R-waves in comparison with the depth, and this issue outweighs the role of trench depth.
Wider barriers lead to better screening effect and W seems to govern the screen-ing process. For the narrow trench however, increasscreen-ing the normalized width (W > 0.2) results in decreasing the effect of W , owning the fact that increasing the width of the barriers hardly affects the screening vibration at any depth. Since the thickness of the obstacle reaches a certain value, increasing width of the barrier hardly affect the screening vibration for almost all depths. Increas-ing the normalized width leads to more discontinuity in the ground surface with different shear modulus hindering more ground-born vibration. However, since W continuously increases, the probability of having wave interferences among the R-waves that are propagated through the trench and the waves that are transmitted beneath the obstacle due to different velocity. This phenomenon may be one of the reasons for reaching to a stable value of the normalized width beyond 0.25.
5.3
Triangular Wall Barrier
As it can be seen in Fig. 20, the efficiency of the trench increases gradually and continuously by increasing the normalized depth for approximately all widths, implying that D governs the scattering influence. It is apparent from the figure that the barrier width has an ignorable influence on the scattering of incoming energy. Considering the corner of the triangular wall barrier, its shape can be the reason for observing no mode conversion or diffraction phenomenon that changes the R-waves to body waves.
Figure 20: Influence of normalized barrier depth on Ar(X = 3)
6
Conclusion
Based on a fully experimental test, a comprehensive numerical modelling for evaluating the efficiency of the geofoam-filled barrier in attenuating dispatched waves has been performed. The conclusions drawn from field work and para-metric studies can be summarized as follows:
Active isolation can be a better solution for hindering of incident waves in com-parison with the passive isolation based on the results of field test. However, the results also showed that the first point after the trench has the highest amount of mitigation and normalized depth of 0.6λr is enough for reaching the highest
value of the efficiency for both active and passive isolation systems.
The parametric study of the active and passive isolations showed the zone of 7λr and 10λr as crucial zones for an area after the trench for computing Ar.
This finding proves that the vibration isolation system should be divided into active and passive systems during analysing.
Analysing the result of the active scheme demonstrated that the optimum length can be considered as 2.5λr for all three systems for reaching the highest value
of the efficiency. The depths of 1λr, 1.2λr and 1λr are considered as the
op-timum depths for the single, double and triangular wall systems, respectively. Concerning the effect of width of the geofoam-filled trench, it is concluded that the value of W = 0.2 ,0.2 and 0.25 are enough for considering the optimum W
for single, double and triangular wall systems, respectively.
On the other hand, evaluation of the passive isolation revealed that the depth of the barrier hardly affects the efficiency of the obstacle for single and double wall systems and the influence of D can be ignored as long as D > 0.5. While, D is a key factor in scattering of incoming waves for the triangular wall system. However, an optimum depth cannot be selected for this system as the efficiency of the obstacle increases gradually and continuously by increasing D. The nor-malized width has to be increased to approximately 0.25 to have a successful single wall system. For the double wall system, W should be at least 0.2 for having satisfactory influence of screening. The barrier’s width has a negligible effect on the scattering of dispatched waves for the triangular wall system. In addition, the parametric study of the trench location for both active and pas-sive schemes demonstrated that this factor is not an important parameter that influences the efficiency of the geofoam-filled trench.
References
[1] GF Miller, H Pursey, and Edward Crisp Bullard. On the partition of energy between elastic waves in a semi-infinite solid. Proceedings of the Royal Society of London. Series A. Mathematical and Physical Sciences, 233(1192):55–69, 1955.
[2] Frank Edwin Richart, John Russell Hall, and Richard D Woods. Vibrations of soils and foundations. 1970.
[3] Tahmeed Malik Al-Hussaini. Vibration isolation by wave barriers. 1993. [4] KR MASSARSCH. Vibration isolation using gas-filled cushions, soil
dy-namics symposium to honor prof. richard d. woods. Geofrontiers 2005, Austin, Texas, January 24-26, 2005.
[5] E Mahdavisefat, H Salehzadeh, and AA Heshmati. Full-scale experimental study on screening effectiveness of srm-filled trench barriers. G´eotechnique, 68(10):869–882, 2018.
[6] Pieter Coulier, Vicente Cu´ellar, Geert Degrande, and Geert Lombaert. Ex-perimental and numerical evaluation of the effectiveness of a stiff wave bar-rier in the soil. Soil Dynamics and Earthquake Engineering, 77:238–253, 2015.
[7] Guangyun Gao, Qiwei Zhang, Juan Chen, and Qingsheng Chen. Field experiments and numerical analysis on the ground vibration isolation of wave impeding block under horizontal and rocking coupled excitations. Soil Dynamics and Earthquake Engineering, 115:507–512, 2018.
[8] Tulika Bose, Deepankar Choudhury, Julian Sprengel, and Martin Ziegler. Efficiency of open and infill trenches in mitigating ground-borne vi-brations. Journal of Geotechnical and Geoenvironmental Engineering, 144(8):04018048, 2018.
[10] D Ulgen and O Toygar. Screening effectiveness of open and in-filled wave barriers: a full-scale experimental study. Construction and Building Mate-rials, 86:12–20, 2015.
[11] Ashref Alzawi and M Hesham El Naggar. Full scale experimental study on vibration scattering using open and in-filled (geofoam) wave barriers. Soil Dynamics and Earthquake Engineering, 31(3):306–317, 2011.
[12] Xingbo Pu, Zhifei Shi, and Hongjun Xiang. Feasibility of ambient vibration screening by periodic geofoam-filled trenches. Soil Dynamics and Earth-quake Engineering, 104:228–235, 2018.
[13] Erkan C¸ elebi, Seyhan Fırat, G¨unay Beyhan, ˙Ilyas C¸ ankaya, ˙Isa Vural, and Osman Kırtel. Field experiments on wave propagation and vibration iso-lation by using wave barriers. Soil Dynamics and Earthquake Engineering, 29(5):824–833, 2009.
[14] Carol Murillo, Luc Thorel, and B Caicedo. Ground vibration isolation with geofoam barriers: Centrifuge modeling. Geotextiles and Geomembranes, 27(6):423–434, 2009.
[15] DE Beskos, B Dasgupta, and IG Vardoulakis. Vibration isolation using open or filled trenches. Computational mechanics, 1(1):43–63, 1986. [16] KL Leung, DE Beskos, and IG Vardoulakis. Vibration isolation using open
or filled trenches. Computational Mechanics, 7(2):137–148, 1990.
[17] Dimitri E Beskos. Boundary element methods in dynamic analysis: Part ii (1986-1996). Applied mechanics reviews, 50(3):149–197, 1997.
[18] S Ahmad and TM Al-Hussaini. Simplified design for vibration screening by open and in-filled trenches. Journal of geotechnical engineering, 117(1):67– 88, 1991.
[19] WA Haupt. Wave propagation in the ground and isolation measures. 1995. [20] WA Haupt. Isolation of vibrations by concrete core walls. In Proceedings of the ninth international conference on soil mechanics and foundation en-gineering, volume 2, pages 251–256, 1977.
[21] Sanka D Ekanayake, DS Liyanapathirana, and Chin Jian Leo. Attenua-tion of ground vibraAttenua-tions using in-filled wave barriers. Soil Dynamics and Earthquake Engineering, 67:290–300, 2014.
[22] DS Liyanapathirana and Sanka D Ekanayake. Application of eps geofoam in attenuating ground vibrations during vibratory pile driving. Geotextiles and Geomembranes, 44(1):59–69, 2016.
[23] Mainak Majumder, Priyanka Ghosh, and S Rajesh. An innovative vibra-tion barrier by intermittent geofoam-a numerical study. Geomechanics and Engineering, 13(2):269–84, 2017.
[24] Mainak Majumder, Priyanka Ghosh, and S Rajesh. Numerical study on in-termittent geofoam in-filled trench as vibration barrier considering soil non-linearity and circular dynamic source. International Journal of Geotechnical Engineering, 11(3):278–288, 2017.
[25] Mainak Majumder and Priyanka Ghosh. Intermittent geofoam in-filled trench for vibration screening considering soil non-linearity. KSCE Journal of Civil Engineering, 20(6):2308–2318, 2016.
[26] Qiu Bo, Limam Ali, and Djeran-Maigre Irini. Numerical study of wave bar-rier and its optimization design. Finite Elements in Analysis and Design, 84:1–13, 2014.
[27] Ankurjyoti Saikia. Numerical study on screening of surface waves using a pair of softer backfilled trenches. Soil Dynamics and Earthquake Engineer-ing, 65:206–213, 2014.
[28] M Schevenels, G Lombaert, et al. Double wall barriers for the reduction of ground vibration transmission. Soil Dynamics and Earthquake Engineering, 97:1–13, 2017.
[29] Morteza Esmaeili, Jabbar Ali Zakeri, and Seyed Ali Mosayebi. Investi-gating the optimized open v-shaped trench performance in reduction of train-induced ground vibrations. International Journal of Geomechanics, 14(3):04014004, 2013.
[30] Jabbar-Ali Zakeri, Morteza Esmaeili, and Seyed-Ali Mosayebi. Numerical investigation of the effectiveness of a step-shaped trench in reducing train-induced vibrations. Proceedings of the Institution of Mechanical Engineers, Part F: Journal of Rail and Rapid Transit, 228(3):298–306, 2014.
[31] Ashref Alzawi, M Hesham El Naggar, and Ph DP Eng. Numerical investiga-tions on vibration screening by in-filled geofoam trenches. In 64rd Canadian Geotechnical Conference, Toronto, ON, Canada,(Accepted), 2011.
[32] Julian Sprengel. Optimierung der praktischen Anwendbarkeit aufgesch¨aumter Isolierk¨orper im Boden zur Ersch¨utterungsreduktion. PhD thesis, RWTH Aachen University, 2017.
[33] D. Heiland M. Mistler. Mobiler shaker f¨ur die k¨unstliche ersatzanregung bei baudynamischen fragestellungen. Messtechnik im Bauwesen, 2014. [34] Ankurjyoti Saikia. Numerical investigation on vibration isolation by softer
in-filled trench barriers. Journal of Geo-Engineering Sciences, 3(1):31–42, 2016.
[35] GA Athanasopoulos, PC Pelekis, and GA Anagnostopoulos. Effect of soil stiffness in the attenuation of rayleigh-wave motions from field measure-ments. Soil Dynamics and Earthquake Engineering, 19(4):277–288, 2000. [36] DK Baidya and G Murali Krishna. Investigation of resonant frequency and
amplitude of vibrating footing resting on a layered soil system. Geotechnical Testing Journal, 24(4):409–417, 2001.
[37] Roger L Kuhlemeyer and John Lysmer. Finite element method accuracy for wave propagation problems. Journal of Soil Mechanics & Foundations Div, 99(Tech Rpt), 1973.
[38] SE Kattis, D Polyzos, and DE Beskos. Modelling of pile wave barriers by effective trenches and their screening effectiveness. Soil Dynamics and Earthquake Engineering, 18(1):1–10, 1999.
[39] Izzat Muhammad Idriss and Harry Bolton Seed. The response of earth banks during earthquakes. Technical report, 1966.
[40] M Iodice, E Rustighi, and J Muggleton. Comparison of soil excitation methods for surface wave speed measurements. 2014.
[41] Edward L Wilson. Three-dimensional static and dynamic analysis of struc-tures. 2002.
[42] Hans-Joachim Dolling. Abschirming von ersch¨utterungen durch boden-schlitze. Die Bautechnik, 5:151–158, 1970.