HAL Id: insu-02937040
https://hal-insu.archives-ouvertes.fr/insu-02937040
Submitted on 4 Mar 2021
HAL is a multi-disciplinary open access
archive for the deposit and dissemination of
sci-entific research documents, whether they are
pub-lished or not. The documents may come from
teaching and research institutions in France or
abroad, or from public or private research centers.
L’archive ouverte pluridisciplinaire HAL, est
destinée au dépôt et à la diffusion de documents
scientifiques de niveau recherche, publiés ou non,
émanant des établissements d’enseignement et de
recherche français ou étrangers, des laboratoires
publics ou privés.
Hiromu Nakagawa, Naoki Terada, Sonal K. Jain, Nicholas M. Schneider,
Franck Montmessin, Roger V. Yelle, Fayu Jiang, Loic Verdier, Scott L.
England, Kanako Seki, et al.
To cite this version:
Hiromu Nakagawa, Naoki Terada, Sonal K. Jain, Nicholas M. Schneider, Franck Montmessin, et al..
Vertical propagation of wave perturbations in the middle atmosphere on Mars by MAVEN/IUVS.
Journal of Geophysical Research.
Planets, Wiley-Blackwell, 2020, 125 (9), pp.e2020JE006481.
Hiromu Nakagawa1 , Naoki Terada1 , Sonal K. Jain2 , Nicholas M. Schneider2 , Franck Montmessin3 , Roger V. Yelle4 , Fayu Jiang4, Loic Verdier3, Scott L. England5 , Kanako Seki6 , Hitoshi Fujiwara7, Takeshi Imamura8 , Nao Yoshida1 , Takeshi Kuroda1 , Kaori Terada1 , Hannes Gröller2 , Justin Deighan4 , and Bruce M. Jakosky4
1Graduate School of Science, Tohoku University, Sendai, Japan,2Laboratory for Atmospheric and Space Physics, University of Colorado, Boulder, CO, USA,3Laboratoir Atmosphères, Milieux, Observations Spatiales (LATMOS), UVSQ, Université Paris‐Saclay, Sorbonne Université, CNES, Paris, France,4Lunar and Planetary Laboratory Science, University of Arizona, Tucson, AZ, USA,5Aerospace and Ocean Engineering, Virginia Tech, Blacksburg, Blacksburg, VA, USA, 6Graduate School of Science, The University of Tokyo, Tokyo, Japan,7Faculty of Science and Technology, Seikei University, Tokyo, Japan,8Graduate School of Frontier Sciences, The University of Tokyo, Tokyo, Japan
Abstract
This work offers thefirst in‐depth study of the global characteristics of wave perturbations in temperature profiles at 20–140 km altitudes derived from the Imaging Ultraviolet Spectrograph (IUVS) onboard the Mars Atmosphere and Volatile EvolutioN (MAVEN) spacecraft. The peak amplitudes of waves seen in temperature profiles exceed 20% of the mean background, especially on the nightside, which is larger than those in Earth's mesosphere and thermosphere. The wave perturbations generate an instability layer around 70–100 km on the nightside, which potentially causes wave‐breaking and turbulences. Our results highlighted a seasonal variation in the latitudinal distribution of nightside perturbations. Amplitudes of wave perturbations were found to be large in the northern low‐latitude region and the southern polar region during thefirst half of the year (Ls¼ 0–180°). An increase of waves in the spectral density was found insouthern low‐latitude regions in the latter half of the year (Ls¼ 180–360°). Vertical wavenumber spectral
density in the Martian middle atmosphere shows a power‐law dependence with a logarithmic spectral slope of−3, similar to the features seen in the Earth's atmosphere. The derived spectral power density suggests the longer waves growing with height while the effective dissipation of shorter waves occurs. The strong CO2
15‐micron band cooling can effectively dissipate shorter waves. In contrast, the spectral power density at longer waves suggests an amplitude growth with height of unsaturated waves up to the lower thermosphere.
Plain Language Summary
Atmospheric waves are recognized as an important part of the terrestrial climate system. This work offers thefirst in‐depth study of the global characteristics of wave perturbations in temperature profiles in the Martian middle atmosphere. The peak amplitudes of waves seen in temperature profiles exceed 20% of the mean background, especially on the nightside, which is larger than those in Earth's mesosphere and thermosphere. Wefind that the wave perturbations generate an instability layer around 70–100 km on the nightside. The longer waves suggest the amplitudes grow with height which becomes large enough to distort the Martian upper atmosphere significantly.1. Introduction
Internal gravity waves are recognized as an important part of the terrestrial climate system. They are ubiqui-tous in the Earth's upper atmosphere (Bruinsma & Forbes, 2008; Fritts, 2011; Hocke & Schlegel, 1996) and affect the dynamics, composition, and thermal structure of the terrestrial middle atmosphere (see the semi-nal review of Fritts & Alexander, 2003) and thermosphere (see the review of Yiğit et al., 2016). Global char-acteristics of gravity waves on Earth have been extensively investigated for decades (Forbes et al., 2016; John & Kumar, 2012; Tsuda & Nishida, 2000; X. Liu et al., 2017).
On Mars, largefluctuations in density and temperature with short vertical wavelengths for vertical wave-length <10 km were first detected in Viking, Opportunity, Spirit, and Mars Pathfinder entry probes (Magalhaes et al., 1999; Seiff & Kirk, 1976). Wave amplitudes in the Martian atmosphere are larger than those in the terrestrial atmosphere and the important role of gravity waves of tropospheric origin in the mid-dle atmosphere has been appreciated in early modeling studies (Barnes, 1900; Joshi et al., 1995). Gravity
©2020. American Geophysical Union. All Rights Reserved.
Key Points:
• MAVEN/IUVS revealed for the first time the global characteristics of wave perturbations in temperature profiles from 20 to 140 km altitude • The peak amplitudes of waves
exceed 20% of the mean background values on the nightside, larger than those in Earth's mesosphere • Amplitudes appear to grow with
height for longer wavelengths, whereas dissipation of shorter wavelengths occur
Correspondence to:
H. Nakagawa,
Citation:
Nakagawa, H., Terada, N., Jain, S. K., Schneider, N. M., Montmessin, F., Yelle, R. V., et al. (2020). Vertical propagation of wave perturbations in the middle atmosphere on Mars by MAVEN/IUVS. Journal of Geophysical Research: Planets, 125, e2020JE006481. https://doi.org/10.1029/2020JE006481
Received 13 APR 2020 Accepted 31 AUG 2020
waves strongly affect the large‐scale winds, thermal balance, and density in the mesosphere and lower thermosphere (e.g., Medvedev et al., 2011, 2015, 2016). The temperature perturbations induced by gravity waves facilitate mesospheric CO2ice cloud formation (González‐Galindo et al., 2011; Spiga et al., 2012;
Yiğit et al., 2015). Thermal tides are dominant with persistent wave modes that produce the largest variations in the temperature profiles (e.g., England et al., 2016, 2019). Tidal‐gravity wave interactions are expected to occur on Mars (Heavens et al., 2010). The observed polar warmings (McClees et al., 2008) are related to adiabatic heating in the downwelling branch of the single, nearly pole‐to‐pole Hadley circulation which has its downward branch at high northern winter latitudes, with a further contribution due to thermal tides, planetary, and gravity waves (e.g., Wilson, 1997).
Most of the information about small‐scale waves on Mars at altitudes from 0 to 40 km has been obtained from radio occultation techniques (Ando et al., 2012; Creasey et al., 2006; Tellmann et al., 2013), temperature profiles retrieved from the Mars Climate Sounder radiometer onboard Mars Reconnaissance Orbiter (MRO/ MCS) (Heavens et al., 2020), and airglow observations by the Observatoire pour la Minéralogie, l'Eau, les Glaces et l'Activité onboard Mars Express (MEX/OMEGA) (Altieri et al., 2012). They found a horizontal wavelength of 50–150 km in the airglow. Creasey, Forbes, and Keating (2006) showed an enhancement of wave energy associated with small‐scale disturbances over the tropics and mountains in the lower atmo-sphere (10–30 km). Recently, a high‐resolution (gravity wave‐resolving) Martian general circulation model (MGCM) has been applied for investigation of gravity wave activity in the troposphere and vertical propaga-tion of gravity waves in the middle atmosphere (Kuroda et al., 2015, 2016, 2019). The simulated distribupropaga-tions of gravity wave energy in the lower atmosphere support the observational evidence of wave enhancement in the equatorial zone (Ando et al., 2012; Creasey, Forbes, & Keating, 2006). However, previous radio occulta-tion observaocculta-tions have been restricted to a certain local‐time. Therefore, local‐time dependence of wave per-turbations in the lower atmosphere has remained unexplored. Heavens et al. (2020) presented the most comprehensive evaluation of gravity wave activity of lower atmosphere and suggest the contributions from convective processes in addition to those associated with topographic features.
In the upper atmosphere, wave perturbations were quantified using aerobraking measurements. Aerobraking of Mars Global Surveyor (MGS) at 100–130 km showed relative density perturbations of ~5– 50% with dominant horizontal wavelengths of 20 to 300 km (Creasey et al., 2006; Forbes et al., 2006; Fritts et al., 2006). In contrast to the lower atmosphere, no difference between tropical and extratropical density perturbations in the thermosphere has been found in observations (Creasey, Forbes, & Hinson, 2006). Since previous studies did not establish a correlation between wave activity in the lower and the upper atmo-sphere, questions about sources of waves in the thermosphere and their possible links with those in the tro-posphere still remain to be addressed. The most extensive body of observations in the Martian middle atmosphere has been obtained using the Spectroscopy for Investigation of Characteristics of the Atmosphere of Mars (SPICAM) onboard MEX (Forget et al., 2009; González‐Galindo et al., 2011; McDunn et al., 2006; Montmessin et al., 2006, 2017; Quémerais et al., 2006). These observations revealed the density and thermal structures in the Martian mesosphere and lower thermosphere, and have refined our under-standing of the Martian upper atmosphere. Withers et al. (2011) performed interesting work on large‐scale wave characterization, such as zonal wavenumber 2 and 3 (henceforth wave‐2 and wave‐3, etc.), with SPICAM data at 70–120 km altitudes. However, small‐scale perturbations in this altitude region have not been addressed in detail.
Since October 2014, NASA's Mars Atmosphere and Volatile EvolutioN (MAVEN) mission has performed a comprehensive study of the Martian atmosphere (Jakosky et al., 2015, 2018). In situ measurements of the upper atmosphere, from 300 km down to 130 km, revealed that wave perturbations ubiquitously exist in the populations of ions and neutrals in the upper thermosphere (Bougher et al., 2015; England et al., 2017; Siddle et al., 2019; Terada et al., 2017; Vals et al., 2019; Yiğit et al., 2015). Wave perturbations have also been detected by remote sensing with the Imaging Ultraviolet Spectrograph (IUVS) onboard MAVEN at altitudes between 20 and 140 km (Gröller et al., 2015, 2018). These IUVS measurements provide opportunities for investigating possible links between waves in the Martian troposphere and thermosphere.
In order to improve our knowledge of the global characteristic of waves, we use a set of IUVS stellar occulta-tion measurements to obtain temperature perturbaocculta-tions in the middle atmosphere during the period from 24 March 2015 to 12 April 2018, which spans two Martian Years. Sections 2 and 3 describe the IUVS stellar
occultation data, derived temperature profiles, and the wave amplitudes as a function of the solar zenith angle, local‐time, and background temperature throughout the period. The global distribution of waves and seasonal variations are presented in section 4. The observed vertical wavenumber spectral densities are presented in section 5. Discussion and conclusions are given in sections 6 and 7.
2. MAVEN/IUVS Stellar Occultation Measurements
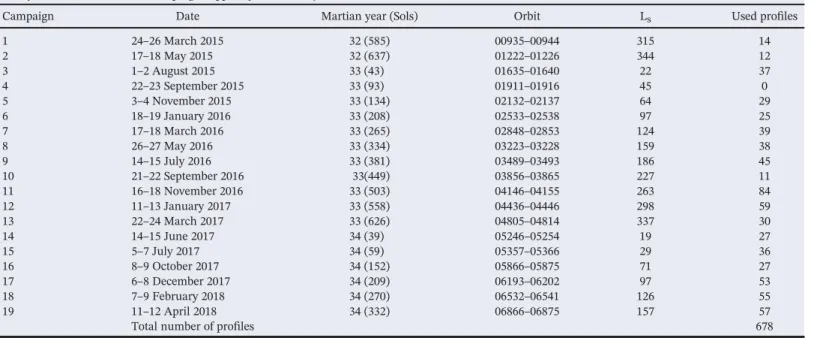
The IUVS instrument measures electromagnetic radiation in two spectral channels: the Far‐UV (110– 190 nm) and Mid‐UV (170–350 nm). During a stellar occultation, the two channels allow remote sounding measurements to be taken in the 20 to 140 km altitude range. The well‐controlled Articulated Payload Platform (APP) on the MAVEN spacecraft enables the specific pointing of the instrument (McClintock et al., 2014) to star, thus permitting IUVS stellar occultation measurements to obtain good spatial coverage for latitude, longitude, local‐time, and season. Occultations are executed in campaigns lasting 1–2 days. The MAVEN/IUVS stellar occultation campaigns have been performed every 2 months since 24 March 2015. In this study, we apply the data set between March 2015 and April 2018 almost two Martian Years. The vertical resolution of the retrieved temperature profiles varies from 2 to 10 km (Gröller et al., 2015). The 678 tempera-ture profiles are adopted, that have altitude sampling better than 6 km and an altitude coverage large enough (>20 km) to detect wave signatures between 20 and 140 km during thefirst half of the year (423 profiles in solar longitude, Ls¼ 0–180°), and the latter half of the year (255 profiles in Ls¼ 180–360°). The list of the
stellar occultation campaigns from #1 to #19 presented in this study are summarized in Table 1.
Figure 1 shows the distributions of the tangential footprints (as the coordinates of the closest approach dis-tance along the line of sight) of the IUVS stellar occultation measurements. The color code represents each occultation campaign. A campaign of observations in consecutive orbits roughly covers the whole latitudinal circle. The targeted UV bright stars were selected for optimizing a specific latitude coverage at a certain sea-son. The IUVS measurements presented in this study cover the latitude ranges between 70°N and 80°S. The geometrical parameters of the tangential footprint of the occultation evolved throughout the mission. Thus, we have to note that the results shown here represent a combination of these geometrical variations and real atmospheric variations. An altitude range between 20 and 140 km was fully covered on the nightside. In con-trast, profiles on the dayside were obtained for altitudes above 100 km due to the stray light below. First, CO2number densities were retrieved from the transmission spectra of stellar signal in the atmosphere
at each orbit (Gröller et al., 2015). Next, temperatures were derived from densities under the assumption of hydrostatic equilibrium (e.g., see the works of Gröller et al., 2015; Medvedev et al., 2016). All temperature profiles used in this study correspond to Level 2, version 13, revision 01 data provided by the Planetary Data System (PDS) (https://atmos.nmsu.edu/data_and_services/atmospheres_data/MAVEN/stellar.html) (Schneider, N. et al., MAVEN IUVS Derived‐level Data Product Bundle, urn:nasa:pds:maven.iuvs.processed 2015). The line contains both transmission spectrum data (level 1c) and derived data (level 2, temperature and densities). Thefilename in the PDS contains the keywords, occultation, level 2, version 13, which enables to identify the data set. Temperature disturbance stellar occultation data are available (https://doi.org/ 10.25810/cjvy-vv76), which are custom products which are primarily level 2 data, but the primary extension has been replaced with derived mean component and disturbance component of temperature profiles along with the second‐order polynomial fit, and the isolated spectral components of the disturbances, as mentioned below. Gröller et al. (2018) presented a detailed argument to establish the presence of wave perturbations in the profiles, excluding the possibility that such features could arise from an instrumental or data reduction artifact. Gröller et al. (2018) have carefully investigated the possible effects of the Tikhonov regularization smoothing in inversion process, the possible sources of artifacts in the data reduction algorithm, and the per-iodic motions in spacecraft pointing (see Figures 9 and 10 in Gröller et al., 2018). They concluded that wave perturbations in the derived local densities are a real characteristic of the observed Martian atmosphere.
3. Temperature Profiles and Wave Signature
An atmospheric temperature profile T(z) is assumed to consist of a background (mean) component ⟨T(z)⟩ and a disturbance (deviation from the mean) T′ (z). To extract T ′ (z) from a single profile, we applied a second‐order polynomial fit between 20 and 140 km in order to exclude large‐scale features, as was similarly done in the analysis of radio occultation data (Ando et al., 2012; Creasey, Forbes, & Keating, 2006).
Figures 2b and 2f show a typical example of extracting disturbances T ′ (z) from a single profile of temperature T(z) (2a and 2e) by a polynomialfit derived from Orbit#2132 on 3rd November 2015 in both the northern (upper panels) and southern (lower panels) hemispheres at Ls ¼ 63°. The tangential
footprints of the occultation are located at (322°E, 51°S) and (314°E, 8°N) in geographical coordinate, respectively. As seen in Figure 2f, the observed temperature profiles exhibit wave perturbations with peak amplitudes which sometimes exceed 20% of the mean background values in the 20–140 km altitude range. This is notably larger than those in Earth's mesosphere/thermosphere (~5–13%) (e.g., Fritts & Alexander, 2003; Miyoshi & Fujiwara, 2008; Suzuki et al., 2007; Yamashita et al., 2013). Comparing Figures 2c and 2g, the Brunt‐Väisälä frequency, N2, is often close to zero in Figure 2g, which indicates convective instability and possible breakdown of waves in the Martian mesosphere. The presence of
Table 1
List of the Stellar Occultation Campaigns Applied for This Study
Campaign Date Martian year (Sols) Orbit Ls Used profiles
1 24–26 March 2015 32 (585) 00935–00944 315 14 2 17–18 May 2015 32 (637) 01222–01226 344 12 3 1–2 August 2015 33 (43) 01635–01640 22 37 4 22–23 September 2015 33 (93) 01911–01916 45 0 5 3–4 November 2015 33 (134) 02132–02137 64 29 6 18–19 January 2016 33 (208) 02533–02538 97 25 7 17–18 March 2016 33 (265) 02848–02853 124 39 8 26–27 May 2016 33 (334) 03223–03228 159 38 9 14–15 July 2016 33 (381) 03489–03493 186 45 10 21–22 September 2016 33(449) 03856–03865 227 11 11 16–18 November 2016 33 (503) 04146–04155 263 84 12 11–13 January 2017 33 (558) 04436–04446 298 59 13 22–24 March 2017 33 (626) 04805–04814 337 30 14 14–15 June 2017 34 (39) 05246–05254 19 27 15 5–7 July 2017 34 (59) 05357–05366 29 36 16 8–9 October 2017 34 (152) 05866–05875 71 27 17 6–8 December 2017 34 (209) 06193–06202 97 53 18 7–9 February 2018 34 (270) 06532–06541 126 55 19 11–12 April 2018 34 (332) 06866–06875 157 57
Total number of profiles 678
Figure 1. Distributions of the tangential footprints of the IUVS stellar occultation measurements in the coordinates of latitude vs. longitude (a), local‐time (b), and solar longitude (d), and in the coordinates of altitude vs. local‐time (c). The color code represents each occultation campaign.
small‐scale waves clearly contributes to convective instabilities in the middle atmosphere, as seen in Earth's mesosphere (A. Z. Liu et al., 2004; Collins & Smith, 2004; Williams et al., 2006).
The present study also obtains vertical wavenumber spectra of waves in the Martian middle atmosphere, as can be seen in Figures 2d and 2h. The spectra are calculated from the normalized temperature perturbations. The minimum vertical wavelength in this study is ~4–12 km due to the limited vertical resolution (~2–6 km) of the profile. The Fast Fourier Transform (FFT) can be used to isolate the spectral components of the per-turbations. Temperature perturbations in the altitude range of 20–140 km are analyzed with the FFT includ-ing a Hanninclud-ing window. Because of possible influence from the finite Fourier length, the maximum wavelength analyzed is ~60 km. The extracted waves with the vertical wavelength between 4–12 and 60 km applied in this study include both gravity waves and thermal tides. A mesoscale model of convective generation of gravity waves (Imamura et al., 2016) suggests that such long‐vertical wavelength as long as
Figure 2. Example of perturbation extractions using an individual polynomialfit derived from Orbit#2132 on 3rd November 2015 at Ls¼ 63°. The tangential footprints of the occultation are located at (322°E, 51°S) and (314°E, 8°N ) in geographical coordinate, respectively. Vertical profiles of temperature (a, e), normalized perturbations (residuals from thefit curve) of temperature (b, f), squared buoyancy frequency (c, g), and vertical spectral power density (d, h) are shown. The solid red line shows thefit. The semiempirical saturation curve is shown for comparison as a dotted line, calculated from Equation 1.
20–50 km waves can be generated and the waves retain their amplitudes up to 150–200 km altitudes. In Figure 2h, the vertical wavenumber spectrum divided by N4indicates large spectral density which is close to the semiempirical curve developed for saturated gravity waves in the Earth's atmosphere (Smith et al., 1987; Tsuda et al., 1991):
FT′=T0 ¼ 1 4π2 N4 10g2k3 z ; (1)
where kzis the vertical wavenumber with units of cycles per meter, T0is the background temperature, N is
the Brunt‐Väisälä frequency, and g is the gravitational acceleration. The present study assumes pure ver-tical propagation, which may, in some instances, be invalid, but without any theorever-tical expectation or observational evidence of this not happening at Mars, we think this assumption is reasonable. This then necessarily excludes waves that are propagating close to horizontal such as inertia‐gravity waves. Figure 3 shows the dependences of normalized temperature perturbations, |T′ (z)/T(z)|, on the solar‐zenith‐ angle (SZA) (3a–3d) and background temperature (3e–3h) at each altitude range of 20–50, 50–80, 80–110, and 110–140 km, respectively. The individual amplitude of the waves is averaged over the altitude range. The color code represents the local‐time tangential point of the occultations. Note that the dayside profiles were not available at altitudes below 80 km. The averaged amplitudes of each are summarized in Table 2. As seen in Figures 3a–3d, wave amplitudes on the nightside grow with height, reaching 40–50% at 110– 140 km. This fact is expected. In contrast, amplitudes of waves on the dayside mostly show less than 10% at 110–140 km. Consequently, above 80 km, larger amplitudes on the nightside are more than double those found on the dayside. Our result agrees with the in situ measurements in the upper thermosphere obtained during the same time‐frame (Siddle et al., 2019; Terada et al., 2017). It is noteworthy that the correlation coefficient increases with height from −0.08 in 20–50 km to −0.41 in 110–140 km. We find a moderate antic-orrelation with background temperature at 110–140 km altitudes. No correlation at 20–50 km altitudes may imply a mix of saturation, critical levels, and sources (Vals et al., 2019). Meanwhile, anticorrelation at 100–140 km altitudes may suggest saturation due to convective instability (Terada et al., 2017).
Since the nightside profiles fully cover the altitude range from 20 to 140 km, the nightside profiles are used to obtain the latitude‐altitude cross‐section and spectral power density, in order to elucidate the upward propa-gation of waves as detailed hereafter.
4. Latitudinal‐Altitude Cross‐Section of Waves
Based on the nightside profile data set, a latitude‐altitude cross‐section of the zonally averaged values of |
T(z)| and |T′ (z)/T(z)| are presented for the first half of the year (Ls¼ 0–180°) and the latter half of the year
(Ls¼ 180–360°) as shown in Figure 4. Here the absolute values of normalized temperature perturbations
were calculated by averaging over the altitude bin (3 km range) and latitudinal bin (3° width). In Figure 4b, distinct enhancements around 70–100 km altitudes have been observed at the equator and north-ern low latitudes (labeled as A), and southnorth-ern polar region (labeled as B) at Ls¼ 0–180°. Strong perturbations
are also identified above these structures. These regions correspond to the warm atmospheric portions seen in Figure 4a. The observed enhancement of temperature in the middle atmosphere of the southern polar region could be explained by polar warming (McClees et al., 2008). Meanwhile, the observed enhancement at low latitudes in the northern summer hemisphere was not expected, because the nightside of the Martian mesosphere is presumably cold. This is associated with a strong temperature inversion due to the unexpected warm layer which was recently discovered by Nakagawa et al. (2020). This also can be considered as an unstable layer in the mesosphere. Upward propagating waves from below potentially break and deposit their horizontal momentum onto the background mean winds and also create turbulent layer when they encoun-ter the convective instabilities related to the strong temperature inversion due to the warm areas. Strong temperature gradient would produce the convective instabilities which enhance the turbulentflow activities to eliminate the temperature gradient. The dynamical friction effects caused by wave breaking might decele-rate the background mean zonal winds in the middle atmosphere, as revealed in the terrestrial atmosphere. The vertical mixing induced by the turbulent layer can influence the homopause and thereby the thermo-spheric composition. Although we do not have an explanation for such a distinct layer of warm air in the
mesosphere in the summer night, Nakagawa et al. (2020) suggests evidence of wave‐3 structures of warm layer with significant amplitudes that have been interpreted as a signature of diurnal, semidiurnal, and/or stationary planetary waves. This requires future work.
Although the data coverage is limited for the Ls¼ 180–360° period, it
was found that wave activity was quite small in the northern low‐latitude region as seen in Figure 4d. The large wave activity in the northern low‐latitude region for the Ls¼ 0–180° period is not
Figure 3. Averaged wave amplitudes as a function of (a–d) solar‐zenith‐angle (SZA) and (e–h) background temperature. Points are color‐coded by local‐time at the tangential point of occultations.
Table 2
Averaged Amplitudes of Waves (K) in Figure 3
SZA/altitude 20–50 km 50–80 km 80–110 km 110–140 km
0–45° ‐ ‐ 3.58 2.86
45–90° ‐ ‐ 3.80 3.76
90–135° 7.40 8.38 6.19 7.62
present for the rest of the year. This suggests that the global distribution of temperature perturbations in the middle atmosphere has a strong seasonal dependence. Relatively large amplitudes appeared in the southern low‐latitude region above 80 km altitude (labeled as C) in the second half of the year. It is interesting that seasonal variation of gravity wave activity is also visible in the lower atmosphere around 20–30 km altitudes (Heavens et al., 2020). They reported higher activity in northern tropics during thefirst half of the year than the second half of the year, meanwhile the reverse is true for the southern tropics. Our result also suggests that the seasonal variation of waves implies an enhancement of perturbations in summer low‐latitude regions in the mesosphere and lower thermosphere. In contrast, we did not have a chance to address the seasonal variation of the waves at high latitudes due to limited latitudinal coverage.
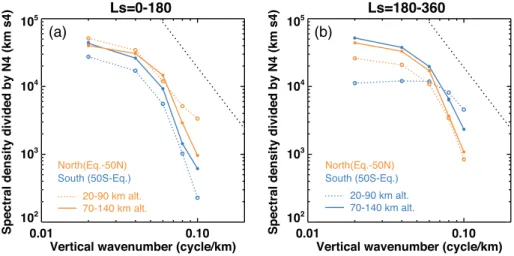
5. Vertical Wavenumber Spectral Density of Waves
By sorting the nightside profiles into two altitudes ranges, 20–90 and 70–140 km, we are able to examine wave propagation as a function of altitude in the middle atmosphere. Temperature perturbations in the alti-tude range from 20–90 and 70–140 km are analyzed with the FFT including a Hanning window for each alti-tude range. Figure 5 shows the averaged vertical wavenumber spectra in the altialti-tude range from 20–90 (dotted lines) and 70–140 km (solid lines) for each season. The color codes correspond to latitudinal range in 50 to 0°S (blue), and 0 to 50°N (yellow). The number of profiles used in the analysis are summarized in Table 3. We confined our spectral analysis to the low‐ to middle‐latitude region because of the limitation of data coverage for high‐latitude region. The obtained spectra show a decline in the spectral density with wavenumber which is similar to those obtained in the terrestrial stratosphere, mesosphere, and thermo-sphere. The spectral index is typically around−3 at the low wavenumbers. However, the spectra do not com-pare well with the theoretical spectrum for saturated gravity waves developed for Earth's atmosphere (black‐ dotted line). This seems to contradict with the fact that the convective instabilities were found in individual
Figure 4. Latitude‐altitude cross‐section of zonally averaged temperature (a, b) and zonally averaged normalized temperature perturbations (c, d) on the nightside at Ls¼ 0–180° and 180–360°.
profiles, as shown in Figure 2. This may indicate a larger statistical weight of unsaturated waves in the averaged spectrum. On the other hand, the spectral density in the Martian lower atmosphere (<30 km) almost coincides with the saturation curve (Ando et al., 2012). The difference between lower atmosphere and middle atmosphere may indicate that the radiative damping reduces the amplitudes during the vertical propagation from below on Mars.
For thefirst half of the year, the waves appear to be greater amplitude in the northern hemisphere. During the second half of the year, an increase of waves emerges in the spectral density and is found in the southern hemisphere from 20–90 and 70–140 km. The spectral power density in summer low‐latitude regions suggests slightly larger values than in winter in the 70–140 km region. This is consistent with the conclusions drawn from Figure 4. The spectral density at high wavenumbers (~0.10 km−1) in the southern hemisphere increases in the latter half of the year more than in thefirst half of the year for altitudes in the range 20–90 km. The higher activity in the latter half of the year might suggest that the small‐scale waves are intensified by con-vective processes in the lower atmosphere because perihelion occurs during this period and hence solar heat-ing peaks. The change in the spectral slope at a wavenumber of 0.06 km−1 might suggest that the low‐wavenumber region (vertical wavelengths longer than ~17 km) is unsaturated and the energy density can potentially increase with altitude. In fact, the spectral power density at low wavenumbers suggests the amplitudes grow with height toward the lower thermosphere in both seasons, except in the northern sum-mer. Considerable wave occurs in the southern summer (Ls¼ 180–360°). Meanwhile, we find that the
spec-tral power density at higher wavenumbers >0.06 km−1(vertical wavelengths <~17 km) at 70–140 km is mostly equivalent to or lower than that at 20–90 km, except in the southern winter. This means that shorter waves declined while propagating upward. This could be the result of the strong radiative damping by the CO215‐micron band cooling on Mars (20 times than Earth) which could effectively dissipate shorter waves
(Eckermann et al., 2011; Imamura & Ogawa, 1995). However, propagation between 20–90 and 70–140 km is not the same for each season and hemisphere. Different behavior of propagation processes might be explained by refraction andfiltering of upward propagating waves dominated by the background winds (Forbes, 2002). Seasonal difference of CO2density at high altitudes
could also influence the change in radiative damping.
6. Discussion
The observed wave amplitudes agree well with the amplitudes of den-sity perturbations in the Martian mesosphere and lower thermo-sphere reported earlier by in situ measurements (3–30%) (Creasey,
Table 3
Number of Temperature Profiles on the Nightside Applied in Figure 5
Ls Latitude Profiles at 20–90 km Profiles at 70–140 km 0–180° Equator–50°N 57 117 50°S–Equator 67 99 180–360° Equator–50°N 67 81 50°S–Equator 18 39
Figure 5. Averaged vertical wavenumber spectra of the temperature perturbations on the nightside normalized by N4in the altitude range of 20–90 km (dotted lines) and 70–140 km (solid lines) at Ls¼ 0–180° (a) and Ls¼ 180–360°
(b). The semiempirical saturation curve is shown for comparison as the black dotted line. The color lines correspond to latitudinal range in 50 to 0°S (blue), and 0 to 50°N (yellow).
Forbes, & Hinson, 2006). On the other hand, we note that waves with short horizontal scales are not resolved in the remote‐sensing occultation measurements due to their integration along the line‐of‐sight and therefore do not contribute to the disturbances discussed in this paper (e.g., Ando et al., 2015; Chamberlain, 1963; Kursinski et al., 1997). If H is the constant density scale height, R is the distance from the center of Mars at the tangential point (H/R≪ 1), the integration along a tangential line of sight is equal to pffiffiffiffiffiffiffiffiffiffiffiffiffi2πRH (Ando et al., 2015). For Mars, using H ¼ 6–12 km, R ¼ 3,520 km, the expression yields 364–515 km. Thus, harmonics with horizontal scales shorter than ~500 km are possibly not resolved by the instrument due to horizontal averaging. Note that Fritts et al. (2006) and Yiğit, England, et al. (2015) found density perturbations with larger magnitudes (up to 50%) in the upper thermosphere from in situ mea-surements with higher horizontal resolution.
A complete understanding of the seasonal and latitudinal variations is prevented by the insufficient data cov-erage; the IUVS data used in this study do not cover the northern high‐latitude region (>50°N) at
Ls¼ 0–180°. It is also obvious that the number of profiles for the period Ls¼ 180–360° are much smaller than
those at Ls¼ 0–180° as seen in Table 1. We need additional data coverage for a more reliable evaluation of
seasonal and latitudinal variations of wave perturbations, especially at high latitudes. In the case of Earth, Tsuda and Nishida (2000) and Miyoshi et al. (2014) demonstrated that the gravity wave energy at high lati-tudes is much stronger than that at lower latilati-tudes in the mesosphere/thermosphere, while the gravity wave energy is larger at low latitudes in the stratosphere. The poleward propagation of gravity waves is explained by the fact that the westward jet core in the northern hemisphere moves to higher latitudes with height (Sato et al., 2009). General Circulation Models (GCM) also suggest a strong vertical damping of orographically generated gravity wave harmonics due to preferentialfiltering by the background winds at low latitudes on Mars and Earth (Kuroda et al., 2015; Medvedev et al., 2011; Yiğit et al., 2012, 2015). A single gravity wave harmonic breaks or dissipates due to a variety of mechanisms when its intrinsic phase speed approaches zero with respect to the background wind. Creasey, Forbes, and Hinson (2006) reported significant density fluc-tuations in both hemispheres in winter at high latitudes in the upper thermosphere using MGS acceler-ometer data. An enhancement at low latitudes in the middle atmosphere as seen in this study was not presented in Creasey, Forbes, and Hinson (2006).
On the other hand, our result also suggests occurrence of strong waves at the equator and summer low‐latitudes in the middle atmosphere. The expected strong solar heating at the equator and summer low‐latitudes in the tenuous atmosphere of Mars induces not only notable tidal waves but also strong convection (Michaels & Rafkin, 2004; Odaka et al., 1998), which can generate strong, fast gravity waves, which can effectively propagate upward into the upper atmosphere (Imamura et al., 2016). Our result supports the recent study by Heavens et al. (2020) which suggests the gravity waves originated by con-vective processes. The localized heating by absorption of incoming sunlight on dayside via suspended dust particles is also expected to contribute to localized heating and generate waves in the summer hemisphere. The enhanced region of the waves at low latitudes in the middle atmosphere during a glo-bal dust storm could originate from below when the waves have no critical level to encounter and can continue to propagate upward into the mesosphere, as seen in Earth's mesosphere (Miyoshi & Fujiwara, 2009).
Eckermann et al. (2011) theoretically investigated infrared radiative damping rates and their role in the upward propagation of gravity waves. They demonstrated that infrared radiative damping rates increase with decreasing vertical wavelength in the middle atmosphere and peak at ~50–80 km altitudes. The results from this model indicate that infrared radiative damping is the dominant process in dissipating gravity waves at altitudes from ~0–50 km altitudes, and is the dominant process for waves with vertical wavelengths <10–15 km. Our results given by the comparison of spectral power density between 20–90 and 70–140 km agree well with their theoretical predictions. The thermal damping rate due to CO2cooling
in the Martian atmosphere is overall about 20 times faster than on Earth, primarily due to the much larger CO2mixing ratio on Mars. The radiative damping rates show a strong dependence on background
tem-perature, as seen in Equation 13 in Eckermann et al. (2011). The impact is particularly large at 70– 120 km due to the low background temperatures at these altitudes. For example, a uniform 10 K warmer atmosphere causes a doubling of the radiative damping rate at these altitudes (Eckermann et al., 2011). The unexpected warm layer at altitudes from 60–80 km reported by Nakagawa et al. (2020) may have an impact on the rates.
In the upper atmosphere, these waves appear to be large enough to distort the background wind velocity and the thermal structure significantly. Effects of waves propagating from the lower atmosphere on the upper thermosphere dynamics and composition at the exobase are still not fully understood. Wavelike perturba-tions in the Martian upper thermosphere have been studied with the Neutral Gas Ion Mass Spectrometer (NGIMS) onboard MAVEN (Yiğit, England, et al., 2015). They were found to produce large relative density perturbations of 20–35% between 160 and 220 km. Most recently, Terada et al. (2017) found using NGIMS data that gravity wave activity is distributed relatively uniformly at the exobase when it is normalized with respect to the background temperature. England et al. (2017) showed that gravity waves with relatively long vertical wavelengths exceeding 100 km are likely the source of the waves seen by NGIMS in the upper ther-mosphere. Longer vertical wavelength waves are also seen in our analysis (Figures 2 and 3), although the vertical extent of the data restricts detection of waves with mesoscale wavelengths of >100 km; Imamura et al. (2016) suggested that fast mesoscale processes can generate long‐vertical wavelength waves. Spiga et al. (2012) also suggested that mesoscale processes are of topographic origin.
MAVEN observations provide further evidence that wave‐induced variability is a ubiquitous feature of the planetary middle‐to‐upper atmospheres, as was predicted by GCM modeling (Miyoshi et al., 2014; Yiğit et al., 2009, 2012) and recently supported by observations in the terrestrial thermosphere (Forbes et al., 2016).
7. Conclusions
We have investigated global characteristics of wave perturbations in the Martian middle atmosphere at alti-tudes 20–140 km using MAVEN/IUVS stellar occultation measurements. The main results of this study are summarized as follows.
1. The observed temperature profiles demonstrate wave perturbations with peak amplitudes exceeding 20% of the mean background values for altitudes above 80 km on the nightside. This is larger than those in Earth's mesosphere and thermosphere (~5–13%).
2. Large wave activity has been observed in the northern low‐latitude region and southern polar region at
Ls¼ 0–180°. We found that the enhancement in northern hemisphere disappears at Ls¼ 180–360°. In
contrast, the wave perturbations are significant in southern low‐latitudes. These wave perturbations gen-erate an instability layer around 70–100 km.
3. Vertical wavenumber spectral power density in the Martian middle atmosphere shows a power‐law dependence with a logarithmic spectral slope of−3. This is similar to the Earth's atmosphere.
4. Our work shows differences in the spectral power density between altitudes 20–90 and 70–140 km. This result suggests that the strong CO215‐micron band cooling dissipates shorter waves, whereas the spectral
power density of longer waves suggests that the amplitudes of unsaturated waves grow with height as they move toward the lower thermosphere. Our estimates basically support previous model‐based findings (Eckermann et al., 2011).
Our result highlighted the distinctive behavior of Martian atmosphere. The strong solar heating in the ten-uous atmosphere of Mars, in particular at perihelion in southern hemisphere (Ls¼ 180–360°), can induce
notable tidal waves and convective‐induced gravity waves in the troposphere. The strong convection flow in the boundary layer may drive fast‐propagating waves which propagate upward into the mesosphere and thermosphere. In the upper atmosphere, these waves become large enough to distort the background wind velocity and thermal structure significantly.
Data Availability Statement
All temperature profiles used in this study correspond to Level 2, version 13, revision 1 data provided by the Planetary Data System (PDS) (https://atmos.nmsu.edu/data_and_services/atmospheres_data/MAVEN/ stellar.html) (Schneider, N. et al., MAVEN IUVS Derived‐level Data Product Bundle, urn:nasa:pds:maven. iuvs.processed 2015). Temperature disturbance stellar occultation data are available (https://doi.org/ 10.25810/cjvy-vv76), which are custom products which are primarily level 2 data, but the primary extension has been replaced with derived mean component and disturbance component of temperature profiles.
References
Altieri, F., Spiga, A., Zasova, L., Bellucci, G., & Bibring, J. P. (2012). Gravity waves mapped by the OMEGA/MEX instrument through O2
dayglow at 1.27 micron: Data analysis and atmospheric modeling. Journal of Geophysical Research, 117, E00J08. https://doi.org/10.1029/ 2012JE004065
Ando, H., Imamura, T., & Tsuda, T. (2012). Vertical wavenumber spectra of gravity waves in the Martian atmosphere obtained from Mars Global Surveyor radio occultation data. Journal of the Atmospheric Sciences, 69(9), 2906–2912. https://doi.org/10.1175/JAS-D-11-0339.1 Ando, H., Imamura, T., Tsuda, T., Tellmann, S., Pätzold, M., & Häusler, B. (2015). Vertical wavenumber spectra of gravity waves in the
Venus atmosphere obtained from Venus Express radio occultation data: Evidence for saturation. Journal of the Atmospheric Sciences, 72(6), 2318–2329. https://doi.org/10.1175/JAS-D-14-0315.1
Barnes, J. R. (1900). Possible effects of breaking gravity waves on the circulation of the middle atmosphere of Mars. Journal of Geophysical Research, 95(B2), 1401–1421. https://doi.org/10.1029/jb095ib02p01401
Bougher, S. W., Jakosky, B., Halekas, J., Grebowsky, J., Luhmann, J., Mahaffy, P., et al. (2015). Early MAVEN Deep Dip campaign reveals thermosphere and ionosphere variability. Science, 350(6261), aad0459. https://doi.org/10.1126/science.aad0459
Bruinsma, S. L., & Forbes, J. M. (2008). Medium‐ to large‐scale density variability as observed by CHAMP. Space Weather, 6, S08002. https://doi.org/10.1029/2008SW000411
Chamberlain, J. W. (1963). Planetary coronae and atmospheric evaporation. Planetary and Space Science, 11(8), 901–960. https://doi.org/ 10.1016/0032-0633(63)90122-3
Collins, M., & Smith, R. W. (2004). Evidence of damping and overturning of gravity waves in the arctic mesosphere: Na lidar and OH temperature observations. Journal of Atmospheric and Solar‐ Terrestrial Physics, 66(10), 867–879. https://doi.org/10.1016/j. jastp.2004.01.038
Creasey, J. E., Forbes, J. M., & Hinson, D. P. (2006). Global and seasonal distribution of gravity wave activity in Mars' lower atmosphere derived from MGS radio occultation data. Geophysical Research Letters, 33, L01803. https://doi.org/10.1029/2005GL024037
Creasey, J. E., Forbes, J. M., & Keating, G. M. (2006). Density variability at scales typical of gravity waves observed in Mars' thermosphere by the MGS accelerometer. Geophysical Research Letters, 33, L22814. https://doi.org/10.1029/GL027583
Eckermann, S. D., Ma, J., & Zhu, X. (2011). Scale‐dependent infrared radiative damping rates on Mars and their role in the deposition of gravity‐wave momentum flux. Icarus, 211(1), 429–442. https://doi.org/10.1016/j.icarus.2010.10.029
England, S. L., Liu, G., Kumar, A., Mahaffy, P. R., Elrod, M., Benna, M., et al. (2019). Atmospheric tides at high latitudes in the Martian upper atmosphere observed by MAVEN and MRO. Journal of Geophysical Research: Space Physics, 124, 2943–2953. https://doi.org/ 10.1029/2019JA026601
England, S. L., Liu, G., Withers, P., Yiğit, E., Lo, D., Jain, S., et al. (2016). Simultaneous observations of atmospheric tides from combined in situ and remote observations at Mars from the MAVEN spacecraft. Journal of Geophysical Research, 121, 594–607. https://doi.org/ 10.1002/2016JE004997
England, S. L., Liu, G., Yiğit, E., Mahaffy, P. R., Elrod, M., Benna, M., et al. (2017). MAVEN NGIMS observations of atmospheric gravity waves in the Martian thermosphere. Journal of Geophysical Research, 122, 2310–2335. https://doi.org/10.1002/2016JA023475 Forbes (2002). Wave coupling in terrestrial atmospheres. In Atmospheres in the solar system: Comparative aeronomy (Vol. 130, pp. 171–190).
American Geophysical Union. https://www.wiley.com/en-us/Atmospheres%in%the%Solar%System%3A%Comparative%Aeronomy-p-9780875909899
Forbes, M. F., Bruinsma, S., & Lemoine, F. G. (2006). Solar rotation effects on the thermospheres of Mars and Earth. Science, 312(5778), 1366–1368. https://doi.org/10.1126/science.1126389
Forbes, M. F., Bruinsma, S. L., Doornbas, E., & Zhang, X. (2016). Gravity wave‐induced variability of the middle thermosphere. Journal of Geophysical Research: Space Physics, 121, 6914–6923. https://doi.org/10.1002/2016JA022923
Forget, F., Montmessin, F., Bertaux, J. L., González‐Galindo, F., Lebonnois, S., Quémerais, E., et al. (2009). Density and temperatures of the upper Martian atmosphere measured by stellar occultations with Mars Express SPICAM. Journal of Geophysical Research, 114, E01004. https://doi.org/10.1029/2008JE003086
Fritts, D. C. (2011). Gravity wave influences in the thermosphere and ionosphere: Observations and recent modeling. Aeronomy of the Earth Atmosphere and Ionosphere, 109–130. https://doi.org/10.1007/978-94-007-0326-1_8
Fritts, D. C., & Alexander, M. J. (2003). Gravity wave dynamics and effects in the middle atmosphere. Reviews of Geophysics, 41(1), 1003. https://doi.org/10.1029/2001RG000106
Fritts, D. C., Wang, L., & Tolson, R. H. (2006). Mean and gravity wave structures and variability in the Mars upper atmosphere inferred from Mars Global Surveyor and Mars Odyssey aerobraking densities. Journal of Geophysical Research, 111, A12304. https://doi.org/ 10.1029/2006JA011897
González‐Galindo, F., Määttänen, A., Forget, F., & Spiga, A. (2011). The Martian mesosphere as revealed by CO2cloud observations and
General Circulation Modeling. Icarus, 216(1), 10–22. https://doi.org/10.1016/j.icarus.2011.08.006
Gröller, H., Montmessin, F., Yelle, R. V., Lefèvre, F., Forget, F., Schneider, N. M., et al. (2018). MAVEN/IUVS stellar occultation mea-surements of Mars atmospheric structure and composition. Journal of Geophysical Research, 123, 1449–1483. https://doi.org/10.1029/ 2017JE005466
Gröller, H., Yelle, R. V., Koskinen, T. T., Montmessin, F., Lacombe, G., Schneider, N. M., et al. (2015). Probing the Martian atmosphere with MAVEN/IUVS stellar occultations. Geophysical Research Letters, 42, 9064–9070. https://doi.org/10.1002/2015GL065294
Heavens, N. G., Kass, D. M., Kleinböhl, A., & Schofield, J. T. (2020). A multiannual record of gravity wave activity in Mars's lower atmo-sphere from on‐planet observations by the Mars Climate Sounder. Icarus, 341, 113630. https://doi.org/10.1016/j.icarus.2020.113630 Heavens, N. G., Richardson, M. I., Lawson, W. G., Lee, C., McCleese, D. J., Kass, D. M., et al. (2010). Convective instability in the Martian
middle atmosphere. Icarus, 208(2), 574–589. https://doi.org/10.1016/j.icarus.2010.03.023
Hocke, H., & Schlegel, K. (1996). A review of atmospheric gravity waves and travelling ionospheric disturbances: 1982‐1995. Annales Geophysicae, 14, 917–940. https://doi.org/10.1007/s00585-996-0917-6
Imamura, T., & Ogawa, T. (1995). Radiative damping of gravity waves in the terrestrial planetary atmospheres. Geophysical Research Letters, 22(3), 267–270. https://doi.org/10.1029/94GL02998
Imamura, T., Watanabe, A., & Maejima, Y. (2016). Convective generation and vertical propagation of fast gravity waves on Mars: One‐ and two‐dimensional modeling. Icarus, 267, 51–63. https://doi.org/10.1016/j.icarus.2015.12.005
Jakosky, B. M., Brain, D., Chaffin, M., Curry, S., Deighan, J., Grebowsky, J., et al. (2018). Loss of the Martian atmosphere to space: Present‐day loss rates determined from MAVEN observations and integrated loss through time. Icarus, 315, 146–157. https://doi.org/ 10.1016/j.icarus.2018.05.030
Acknowledgments
This work was supported by Grant‐in‐ Aid for Scientific Research (B) 15H03731, Scientific Research (A) 16H0229, Scientific Research (C) for Nos. 16K05566 and 19K03934 from JSPS, and Grant‐in‐Aid for Scientific Research on Innovative Areas for Nos. 18H04453 and 20H04605 from JSPS. The MAVEN project is supported by NASA through the Mars Exploration Program. This work was conducted under NASA's MAVEN Participating Scientist Program (proposal #12‐ MAVENPS12‐0017, PI: K. Seki). HN is supported by the Astrobiology Center Program of National Institutes of Natural Science (NINS) (grant AB291015). HN would like to acknowledge Alexander S. Medvedev, Erdal Yiğit, Ben Johnston, and Zachariah Milby for their assistance in evaluating this paper.
Jakosky, B. M., Grebowsky, J. M., Luhmann, J. G., Connerney, J., Eparvier, F., Ergun, R., et al. (2015). MAVEN observations of the response of Mars to an interplanetary coronal mass ejection. Science, 350(6261), aad0210. https://doi.org/10.1126/science.aad0210
John, S. R., & Kumar, K. K. (2012). TIMED/SABER observations of global gravity wave climatology and their interannual variability from stratosphere to mesosphere lower thermosphere. Climate Dynamics, 39(6), 1489–1505. https://doi.org/10.1007/s00382-012-1329-9 Joshi, M. M., Lawrence, B. N., & Lewis, S. R. (1995). Gravity wave drag in three‐dimensional atmospheric models of Mars. Journal of
Geophysical Research, 100(E10), 21,235–21,245. https://doi.org/10.1029/95JE02486
Kuroda, T., Medvedev, A. S., Yiğit, E., & Hartogh, P. (2015). A global view of gravity waves in the Martian atmosphere inferred from a high‐resolution general circulation model. Geophysical Research Letters, 42, 9213–9222. https://doi.org/10.1002/2015GL066332 Kuroda, T., Medvedev, A. S., Yiğit, E., & Hartogh, P. (2016). Global distribution of gravity wave sources and fields in the Martian
atmo-sphere during equinox and solstice inferred from a high‐resolution general circulation model. Journal of the Atmospheric Sciences, 73(12), 4895–4909. https://doi.org/10.1175/JAS-D-16-0142.1
Kuroda, T., Yiğit, E., & Medvedev, A. S. (2019). Annual cycle of gravity waves activity derived from a high‐resolution Martian general circulation model. Journal of Geophysical Research, 124, 1618–1632. https://doi.org/10.1029/2018JE005847
Kursinski, E. R., Haji, G. A., Schofiled, J. T., Linfield, R. P., & Hardy, K. R. (1997). Observing Earth's atmosphere with radio occultation measurements using the Global Positioning System. Journal of Geophysical Research, 102(D19), 23429–23465. https://doi.org/10.1029/ 97JD01569
Liu, A. Z., Roble, R. G., Hecht, J. H., Larsen, M. F., & Gardner, C. S. (2004). Unstable layers in the mesopause region observed with Na lidar during the Turbulent Oxygen Mixing Experiment (TOMEX) campaign. Journal of Geophysical Research, 109, D02S02. https://doi.org/ 10.1029/2002JD003056
Liu, X., Yue, J., Xu, J., Garcia, R. R., Russell, J. M. III, Mlynczak, M., et al. (2017). Variations of global gravity waves derived from 14 years of SABER temperature observations. Journal of Geophysical Research, 122, 6231–6249. https://doi.org/10.1002/2017/JD026604 Magalhaes, J. A., Schofield, J. T., & Seiff, A. (1999). Results of the Mars Pathfinder atmospheric structure investigation. Journal of
Geophysical Research, 104(E4), 8943–8955. https://doi.org/10.1029/1998JE900041
McClees, D. J., Schofield, J. T., Taylor, F. W., Abdou, W. A., Aharonson, O., Bandfield, D., et al. (2008). Intense polar temperature inversion in the middle atmosphere on Mars. Nature Geoscience, 1(11), 745–749. https://doi.org/10.1038/ngeo332
McClintock, W. E., Schneider, N. M., Holsclaw, G. M., Clarke, J. T., Hoskins, A. C., Stewart, I., et al. (2014). The Imaging Ultraviolet Spectrograph (IUVS) for the MAVEN mission. Space Science Reviews, 195(1–4), 75–124. https://doi.org/10.1007/s11214-014-0098-7 McDunn, T. L., Bougher, S. W., Murphy, J., Smith, M. D., Forget, F., Bertaux, J.‐L., & Montmessin, F. (2006). Simulating the density and
thermal structure of the middle atmosphere (∼80–130 km) of Mars using the MGCM‐MTGCM: A comparison with MEX/SPICAM observations. Icarus, 206(1), 5–17. https://doi.org/10.1016/j.icarus.2009.06.034
Medvedev, A. S., González‐Galindo, F., Yiğit, E., Feofilov, A. G., Forget, F., & Hartogh, P. (2015). Cooling of the Martian thermosphere by CO2radiation and gravity waves: An intercomparison study with two general circulation models. Journal of Geophysical Research:
Planets, 120, 913–927. https://doi.org/10.1002/2015JE004802
Medvedev, A. S., Nakagawa, H., Mockel, C., Yiğit, E., Kuroda, T., Hartogh, P., et al. (2016). Comparison of the Martian thermospheric density and temperature from IUVS/MAVEN data and general circulation modeling. Geophysical Research Letters, 43, 3095–3104. https://doi.org/10.1002/2016GL068388
Medvedev, A. S., Yiğit, E., & Hartogh, P. (2011). Estimates of gravity wave drag on Mars: Indication of a possible lower thermospheric wind reversal. Icarus, 211, 909–912. https://doi.org/10.1016/j.icarus2010.10.013
Medvedev, A. S., Yiğit, E., Hartogh, P., & Becker, E. (2011). Influence of gravity waves on the Martian atmosphere: General circulation modeling. Journal of Geophysical Research, 116, E10004. https://doi.org/10.1029/2011JE003848
Michaels, T., & Rafkin, S. C. (2004). Large‐eddy simulation of atmospheric convection on Mars. Quarterly Journal of the Royal Meteorological Society, 130(599), 1251–1274. https://doi.org/10.1256/qj.02.169
Miyoshi, Y., & Fujiwara, H. (2008). Gravity waves in the thermosphere simulated by a general circulation model. Journal of Geophysical Research, 113, D01101. https://doi.org/10.1029/2007JD008874
Miyoshi, Y., & Fujiwara, H. (2009). Gravity waves in the equatorial thermosphere and their relation to lower atmospheric variability. Earth, Planets and Space, 61(4), 471–478. https://doi.org/10.1186/BF03353164
Miyoshi, Y., Fujiwara, H., Jin, H., & Shinagawa, H. (2014). A global view of gravity waves in the thermosphere simulated by a general circulation model. Journal of Geophysical Research, 119, 5807–5820. https://doi.org/10.1002/2014JA019848
Montmessin, F., Korablev, O., Lefèvre, F., Bertaux, J. L., Fedorova, A., Trokhimovskiy, A., et al. (2017). SPICAM on Mars Express: A 10 year in‐depth survey of the Martian atmosphere. Icarus, 297, 195–216. https://doi.org/10.1016/j.icarus.2017.06.022
Montmessin, F., Quémerais, E., Bertaux, J. L., Korablev, O., Rannou, P., & Lebonnois, S. (2006). Stellar occultations at UV wavelengths by the SPICAM instrument: Retrieval and analysis of Martian haze profiles. Journal of Geophysical Research, 111, E09S09. https://doi.org/ 10.1029/2005JE002662
Nakagawa, H., Jain, S. K., Schneider, N. M., Montmessin, F., Yelle, R. V., Jiang, F., et al. (2020). A warm layer in the nightside mesosphere of Mars. Geophysical Research Letters, 47, e2019GL085646. https://doi.org/10.1029/2019GL085646
Odaka, M., Nakajima, M., Takehiro, S., Ishiwatari, M., & Hayashi, Y. (1998). A numerical study of the Martian atmospheric convection with a two‐dimensional anelastic model, Earth. Planets and Space, 50(5), 431–437. https://doi.org/10.1186/BF03352130
Quémerais, E., Bertaux, J. L., Korablev, O., Dimarellis, E., Cot, C., Sandel, B. R., & Fussen, D. (2006). Stellar occultations observed by SPICAM on Mars Express. Journal of Geophysical Research, 111, E09S04. https://doi.org/10.1029/2005je002604
Sato, K., Watanabe, S., Kawatani, Y., Tomikawa, Y., Miyazaki, K., & Takahashi, M. (2009). On the origins of mesospheric gravity waves. Geophysical Research Letters, 36, L19801. https://doi.org/10.1029/2009GL039908
Seiff, A., & Kirk, D. B. (1976). Structure of Mars' atmosphere up to 100 kilometers from the entry measurements of Viking 2. Science, 194(4271), 1300–1303. https://doi.org/10.1126/science.194.4271.1300
Siddle, A. G., Mueller‐Wodarg, I. C. F., Stone, S. W., & Yelle, R. V. (2019). Global characteristics of gravity waves in the upper atmosphere of Mars as measured by MAVEN/NGIMS. Icarus, 333, 12–21. https://doi.org/10.1016/j.icarus.2019.05.021
Smith, S. A., Fritts, D. C., & Vanzandt, T. E. (1987). Evidence for a saturated spectrum of atmospheric gravity waves. Journal of the Atmospheric Sciences, 44(10), 1404–1410. https://doi.org/10.1175/1520-0469(1987)044<1404:EFASSO>2.0.CO;2
Spiga, A., González‐Galindo, F., López‐Valverde, M. A., & Forget, F. (2012). Gravity waves, cold pockets and CO2clouds in the Martian
mesosphere. Geophysical Research Letters, 39, L02201. https://doi.org/10.1029/2011GL050343
Suzuki, S., Shiokawa, K., Otsuka, Y., Ogawa, T., Kubota, M., Tsutsumi, M., et al. (2007). Gravity wave momentumflux in the upper mesosphere derived from OH airglow imaging measurements. Earth, Planets and Space, 59(5), 421–428. https://doi.org/10.1186/ BF03352703
Tellmann, S., Pätzold, M., Häusler, B., Hinson, D. P., & Tyler, G. L. (2013). The structure of Mars lower atmosphere from Mars Express Radio Science (MARS) occultation measurements. Journal of Geophysical Research, 118, 306–320. https://doi.org/10.1002/jgre.20058 Terada, N., Leblanc, F., Nakagawa, H., Medvedev, A. S., Yiğit, E., Kuroda, T., et al. (2017). Global distribution and parameter dependences
of gravity wave activity in the Martian upper thermosphere derived from MAVEN/NGIMS observations. Journal of Geophysical Research: Space Physics, 122, 2374–2397. https://doi.org/10.1002/2016JA023476
Tsuda, T., & Nishida, M. (2000). A global morphology of gravity wave activity in the stratosphere revealed by the GPS occultation data (GPS/MET). Journal of Geophysical Research, 105(D6), 7257–7273. https://doi.org/10.1029/1999JD901005
Tsuda, T., Vanzandt, T. E., Mizumoto, M., Kato, S., & Fukao, S. (1991). Spectral analysis of temperature and Brunt‐Väisälä frequency fluctuations observed by radiosondes. Journal of Geophysical Research, 96(D9), 17265–17278. https://doi.org/10.1029/91JD01944 Vals, M., Spiga, A., Forget, F., Millour, E., Montabone, L., & Lott, F. (2019). Study of gravity waves distribution and propagation in the
thermosphere of Mars based on MGS, MRO and MAVEN density measurements. Planetary and Space Science, 178, 104708. https://doi. org/10.1016/j.pss.2019.104708
Williams, B. P., Fritts, D. C., She, C. Y., & Goldberg, R. A. (2006). Gravity wave propagation through a large semidiurnal tide and instabilities in the mesosphere and lower thermosphere during the winter 2003 MaCWAVE rocket campaign. Annales de Geophysique, 24(4), 1199–1208. https://doi.org/10.5194/angeo-24-1199-2006
Wilson, R. J. (1997). A general circulation model simulation of the Martian polar warming. Geophysical Research Letters, 24(2), 123–126. https://doi.org/10.1029/96GL03814
Withers, P., Pratt, R., Bertaux, J.‐L., & Montmessin, F. (2011). Observations of thermal tides in the middle atmosphere of Mars by the SPICAM instrument. Journal of Geophysical Research, 116, E1105. https://doi.org/10.1029/2011JE003847
Yamashita, C., England, S. L., Immel, T. J., & Chang, L. C. (2013). Gravity wave variations during elevated stratopause events using SABER observations. Journal of Geophysical Research, 118, 5287–5303. https://doi.org/10.1002/jgrd.50474
Yiğit, E., England, S. L., Liu, G., Medvedev, A. S., Mahaffy, P. R., Kuroda, T., & Jakosky, B. M. (2015). High‐altitude gravity waves in the Martian thermosphere observed by MAVEN/NGIMS and modeled by a gravity wave scheme. Geophysical Research Letters, 42, 8993–9000. https://doi.org/10.1002/2015GL065307
Yiğit, E., Knízôvá, P. K., Georgieva, K., & Ward, W. (2016). A review of vertical coupling in the Atmosphere‐Ionosphere system: Effects of waves, sudden stratospheric warmings, space weather, and of solar activity. Journal of Atmospheric and Solar‐ Terrestrial Physics, 141, 1–12. https://doi.org/10.1016/j.jastp.2016.02.011
Yiğit, E., Medvedev, A. S., Aylward, A. D., Hartogh, P., & Harris, M. J. (2009). Modeling the effects of gravity wave momentum deposition on the general circulation above the turbopause. Journal of Geophysical Research, 114, D07101. https://doi.org/10.1029/2008JD011132 Yiğit, E., Medvedev, A. S., Aylward, A. D., Ridley, A. J., Harris, M. J., Moldwin, M. B., & Hartogh, P. (2012). Dynamical effects of internal gravity waves in the equinoctial thermosphere. Journal of Atmospheric and Solar‐ Terrestrial Physics, 90‐91, 104–116. https://doi.org/ 10.1016/j.jastp.2011.11.014
Yiğit, E., Medvedev, A. S., & Hartogh, P. (2015). Gravity waves and high‐altitude CO2 ice cloud formation in the Martian atmosphere. Geophysical Research Letters, 42, 4294–4300. https://doi.org/10.1002/2015GL064275