HAL Id: hal-02321740
https://hal.umontpellier.fr/hal-02321740
Submitted on 15 Jul 2020
HAL is a multi-disciplinary open access
archive for the deposit and dissemination of
sci-entific research documents, whether they are
pub-lished or not. The documents may come from
teaching and research institutions in France or
abroad, or from public or private research centers.
L’archive ouverte pluridisciplinaire HAL, est
destinée au dépôt et à la diffusion de documents
scientifiques de niveau recherche, publiés ou non,
émanant des établissements d’enseignement et de
recherche français ou étrangers, des laboratoires
publics ou privés.
Distributed under a Creative Commons Attribution - NonCommercial - NoDerivatives| 4.0
Crust-mantle coupling during continental convergence
and break-up: Constraints from peridotite xenoliths
from the Borborema Province, northeast Brazil
Shiran Liu, Andrea Tommasi, Alain Vauchez, Maurizio Mazzucchelli
To cite this version:
Shiran Liu, Andrea Tommasi, Alain Vauchez, Maurizio Mazzucchelli.
Crust-mantle
cou-pling during continental convergence and break-up: Constraints from peridotite xenoliths from
the Borborema Province, northeast Brazil.
Tectonophysics, Elsevier, 2019, 766, pp.249-269.
Crust-mantle coupling during continental convergence and break-up:
Constraints from peridotite xenoliths from the Borborema Province,
northeast Brazil
Shiran Liu
a,b, Andréa Tommasi
b,⁎, Alain Vauchez
b, Maurizio Mazzucchelli
c aKey Laboratory of Orogenic Belts and Crustal Evolution, School of Earth and Space Sciences, Peking University, Beijing, China bGéosciences Montpellier, CNRS & Université de Montpellier, Montpellier, FrancecDipartimento di Scienze Chimiche e Geologiche, Università di Modena e Reggio Emilia, Modena, Italy
A R T I C L E I N F O
Keywords:
Subcontinental mantle lithosphere Crust-mantle coupling
Melt-rock interaction
Olivine crystal preferred orientation Seismic anisotropy
A B S T R A C T
We studied a suite of mantle xenoliths carried by Cenozoic volcanism in the Borborema Province, NE Brazil. These xenoliths sample a subcontinental lithospheric mantle affected by multiple continental convergence and rifting events since the Archean. Equilibrium temperatures indicate a rather hot geotherm, implying a ca. 80 km thick lithosphere. Most xenoliths have coarse-granular and coarse-porphyroclastic microstructures, recording variable degrees of annealing following deformation. The high annealing degree and equilibrated pyroxene shapes in coarse-granular peridotites equilibrated at ~900 °C indicate that the last deformation event that af-fected these peridotites is several hundreds of Ma old. Coarse-porphyroclastic peridotites equilibrated at 950–1100 °C probably record younger (Cretaceous?) deformation in the deep lithospheric mantle. In addition, a few xenoliths show fine-porphyroclastic microstructures and equilibrium temperatures ≥1200 °C, which imply recent deformation, probably related to the dykes that fed the Cenozoic volcanism. Chemical and microstructural evidence for reactive percolation of melts is widespread. Variation in textural and chemical equilibrium among samples implies multiple melt percolation events well spaced in time (from Neoproterozoic or older to Cenozoic). Crystal preferred orientations of olivine and pyroxenes point to deformation controlled by dislocation creep with dominant activation of the [100](010) and [001]{0kl} slip systems in olivine and pyroxenes, re-spectively, for all microstructures. Comparison of xenoliths' seismic properties to SKS splitting data in the nearby RCBR station together with the equilibrated microstructures in the low-temperature xenoliths point to coupled crust-mantle deformation in the Neoproterozoic (Brasiliano) continental-scale shear zones, which is still pre-served in the shallow lithospheric mantle. This implies limited reworking of the lithospheric mantle in response to extension during the opening of the Equatorial Atlantic in the Cretaceous, which in the present sampling is restricted to the base of the lithosphere.
1. Introduction
Continental plates have long-lived histories. They are usually com-posed by crustal domains with varied tectonic ages and tectonic re-working is a common feature in crustal exposures. Yet, major tectonic events such as convergence, collision, and rifting involve the entire plate, not only the crust. By consequence, large volumes of the sub-continental lithospheric mantle must have been affected by a succession of tectono-thermal events (cf. reviews inTommasi and Vauchez, 2015;
Vauchez et al., 2012). In addition, during orogenic events, the strain regime frequently changes across the belt, with contiguous crustal do-mains recording transcurrent motions and thrusting for instance.
However, the level of coupling between crust and mantle deformations during major tectonic episodes is still matter of debate.
Comparison between SKS splitting data and crustal structures points to coherent kinematics, implying at least partial coupling between the crust and the mantle in many orogenic belts (Tikoff et al., 2004). As recognized since the early times of seismic anisotropy measurements (e.g.,Vauchez and Nicolas, 1991), crust-mantle coupling is well docu-mented beneath large-scale strike slip faults and transpressional belts, such as the San Andreas fault (Bonnin et al., 2012) or the Pyrenees, the Appalachians, and the neoproterozoic Ribeira-Aracuai belt of SE Brazil (cf. review inVauchez et al., 2012). In contrast, in collisional domains submitted to large amounts of thickening, like the Alps and the
⁎Corresponding author.
E-mail address:andrea.tommasi@umontpellier.fr(A. Tommasi).
Author copy of the final (peer-reviewed) version
Article published in Tectonophysics in June 2019
Please, reference to:
Liu, S., Tommasi, A., Vauchez, A., Mazzucchelli, M. (2019) Crust-mantle coupling during
continental convergence and break-up: Constraints from peridotite xenoliths from the Borborema
Province, northeast Brazil. Tectonophysics , 766: 249-269
https://doi.org/10.1016/j.tecto.2019.05.017
Southern Tibet, or in active continental rifts, such as the East African rift system, polarization directions of fast split SKS or SKKS waves are usually parallel to the trend of the belts or rifts, but at high angle to the lineations marking flow directions in the ductile crust and to the slip directions in active faults (e.g.,Barruol et al., 2011; Wu et al., 2015;
Hammond et al., 2014). This suggests at least partial decoupling be-tween the crust and lithospheric mantle (Tommasi et al., 1999).
However, seismic anisotropy data only offer indirect information on the present-day structure of the upper mantle. Moreover, unless a variety of methods based on waves with different incidence angles and propagation directions are employed, localizing vertically the source of the anisotropy remains difficult. Analysis of mantle xenoliths, which are mantle fragments carried to the surface by volcanic episodes, allows for direct sampling of the lithospheric mantle. This sampling is imperfect: it is discontinuous, non-oriented, and focused along the magmatic con-duits. Nevertheless, the characterization of the xenoliths' micro-structures and associated crystal preferred orientations, as well as of their chemical compositions and mineralogy, allows determining the relative deformation, annealing, and petrological (partial melting, re-active melt transport, solid-state reequilibration) history, even if no absolute dating is possible. Coupling petrophysical analyses on mantle xenoliths to seismological data may therefore allow constraining the deformation history of the lithospheric mantle and hence discussing crust-mantle coupling during major tectonic events.
In this article, we present a petrostructural study of peridotite xe-noliths entrained by Cenozoic volcanism in NE Brazil. Based on these data and on published SKS splitting measurements (Assumpção et al., 2011; Bastow et al., 2015), we try to unravel the tectono-thermal evolution of the continental lithospheric mantle in this region, which has been affected by multiple collisional and extensional episodes since the Archean. Analysis of the presently outcropping crustal structures highlights a series of tectono-magmatic episodes, among which the most important and recent ones are: (i) extensive intraplate deforma-tion in a convergent setting, which produced a continental-scale system of strike-slip shear zones and transpressional belts accommodating lateral escape of this domain during the formation of the Gondwana and (ii) extension, localized in a series of intracontinental basins, during the early stages of the opening of the Equatorial Atlantic.
2. Geological and geophysical background
2.1. Evolution of the Northern Borborema Province (NBP)
The analysis of the crustal rocks outcropping in the Northern Borborema Province (NBP) points to a complex tectonic evolution, which probably started in the Archean, as indicated by U-Pb ages ranging from 3.4 to 2.7 Ga recorded in the São José Massif (Souza et al., 2016), ca. 100 km to the east of the study area, and in smaller nuclei elsewhere in the province. Between 2.1 and 2.4 Ga, a major crust for-mation event produced ca. 50% of the present-day outcropping rocks (Hollanda et al., 2011;Souza et al., 2016). The tectonic setting for this extensive magmatic activity is discussed, but isotopic data indicates significant recycling of pre-existing crustal material (Hollanda et al., 2011).
The Meso- to Neoproterozoic evolution of the Borborema Province is characterized by a series of failed intracontinental rifting episodes. At 1.8–1.9 Ga, the Orós and Jaguaribe volcano-sedimentary basins formed to the west of the study area (Fig. 1). This localized extension was ac-companied by intrusion of small volumes of alkaline granites and an-orthosites elsewhere in the province, which lasted until 1.75 Ga (Sa et al., 1995;Hollanda et al., 2011). At 1–0.9 Ga, extension affected the central Borborema Province (Santos et al., 2010; van Schmus et al., 2008). A last extensional episode in the Neoproterzoic affected most of the province. I, formed the Seridó basin within the study area (Fig. 1). The youngest sedimentation in this basin occurred at ~630–615 Ma, but early sedimentation may be as old as 1.8 Ga (Hollanda et al., 2015),
suggesting an early rifting episode simultaneous with the formation of the Orós and Jaguaribe basins.
The major tectono-magmatic episode that affected the Borborema Province, shaping its present-day geology, is, however, the compres-sional Brasiliano event between 595 and 540 Ma (e.g.,Neves, 2003;
Archanjo et al., 2008, 2013;Viegas et al., 2014). This event resulted in extensive tectono-thermal reworking of the province through the for-mation of a continental-scale transcurrent shear zone system (the Bor-borema shear zone system,Vauchez et al., 1995), transpressional in-version of the Proterozoic metasedimentary basins, and widespread emplacement of granitoids (Fig. 1). The granitoids geochemistry in-dicates a dominant component of crustal reworking (Neves, 2003;
Souza et al., 2016), implying an intraplate setting for the Brasiliano deformation, with a possible convergent plate boundary > 500 km to the NW from the study area (e.g.,Caby et al., 1991;Ancelmi et al., 2015). The complex network of anastomosing E-W and NE-SW trending ductile dextral strike-slip shear zones, some up to 25 km wide, and transpressional belts deformed under high temperature, low pressure conditions, which compose the Borborema shear zone system, is therefore the expression of strain localization in an intraplate setting controlled by large-scale intraplate rheological heterogeneities (the basins) in response to the convergence between São Francisco, Ama-zonian, and West African cratons during the construction of the Gondwana (Tommasi et al., 1995). This shear zone system allowed for tectonic extrusion of the Borborema Province towards the NE (Ganade de Araujo et al., 2014, 2016), that is, towards the Saharan province, which, like the Borborema, had been weakened by tectono-magmatic activity during the Meso- and Neoproterozoic.
In the early Cretaceous, the Borborema province experienced re-gional extension before rifting localized at the present location of the equatorial Atlantic Ocean (Darros de Matos, 1999). Structures asso-ciated with these early stages of rifting in the northern Borborema Province include several intracontinental basins or aborted rifts and a large tholeiitic dyke swarm. The basins formed as NW-SE trending asymmetric grabens (e.g., Potiguar, Rio do Peixe, Araripe inFig. 1) controlled by reactivation of the Brasiliano shear zones (Darros de Matos, 1999; Castro et al., 2007, 2012; Marques et al., 2014). They contain dominantly continental sediments of fluviatile and lacustrine origin, which attain thicknesses of 2000 m, deposited between 145 and 125 Ma. The Potiguar basin is the best developed among these basins; its offshore domain is the only one involved in the final opening of the Atlantic. The Ceará-Mirim dyke swarm is a > 350-km-long tholeiitic dyke swarm with a dominantly E-W trend that rotates to NE-SW at the southern termination of the Potiguar basin (Fig. 1). The dykes have ages between 135 Ma and 120 Ma (Hollanda et al., 2018 and references therein). Their emplacement is therefore synchronous to the formation of the intracontinental basins. Geochemical data points to primary magmas formed by melting of an enriched mantle (EMI ± FOZO iso-topic signatures) at shallow depths (< 90 km;Ngonge et al., 2016a).
The Cenozoic is characterized by a long-lived, but small-volume alkaline volcanism (both onshore and offshore), tectonic inversion of the Mesozoic intracontinental basins, and uplift of the Borborema Plateau. The entire Borborema Province sits nowadays on average at ~800 m above the sea level and the Araripe basin is topo-graphically > 500 m above the Precambrian basement. Analysis of river profiles implies that most uplift occurred within the last 30 Ma (Tribaldos et al., 2017), but earlier events may have occurred (Marques et al., 2014;Nogueira et al., 2015). The present day crustal thickness of 30–35 km implies some degree of sub-lithospheric support for the up-lift. The offshore Cenozoic volcanism forms an E-W volcanic alignment that extends from the Ceará coast in northeast Brazil (the Mecejana volcanic field) to the Fernando de Noronha archipelago. The Mecejana volcanics yield K-Ar ages between 26 and 44 Ma (Mizusaki et al., 2002), whereas volcanism in Fernando de Noronha has Ar-Ar ages between 12.5 and 6 Ma (Perlingeiro et al., 2013). The onshore Cenozoic vol-canism is distributed along a N-S trend, forming the Macau–Queimadas
-5 00m -3500m -2500m -1500 m Sampling sites: 1: Cabugi 2:Serra Aguda 3: Bodó 4: Faz.Gerôncio 5: Serra Verde
?
?
3.5 0.9Ga 640 540Ma Magmatism Deformation TimeArchean & Mesoproterozoic Neoproterozoic MesozoicCenozoic
0Ma 150
Potiguar
Araripe
RP
Cenozoic alkaline volcanism (Macau suite) Cenozoic sediments
Cretaceous dyke swarm (Ceara Mirim) Cretaceous rift basins
Neoproterozoic (Brasiliano) plutons Neoproterozoic (Brasiliano) shear zones Meso- and Neoproterozoic supracrustal belts Mesoproterozoic gneisses with Archean relicts
N
0 50km SKS splittingMQA
Se
Patos
Se
O
J
38°W 37°W 36°W 0.15 0 nT/m -0.25 6°S 7°S1 2
3
4
5
RCBR
4°S
8°S
6°S
34°W
36°W
38°W
2
1
3
4
5
RCBR
a
b
c
d
Alignment (MQA,Fig. 1). Emplacement ages range between 52 Ma and 7 Ma, with two peaks around 26–29 Ma and 7–9 Ma and no clear age progression along the MQA (Souza et al., 2003;Silveira, 2006;Knesel et al., 2011).
The Macau volcanics that entrained the studied mantle xenoliths (Fig. 1) erupted onto metasediments from the Neoproterozoic Seridó belt or Mesoproterozoic gneisses that form their basement. In the study area, the Brasiliano event is recorded by multiple NE-SW shear zones, which branch off from the E-W Patos shear zone in the south, by transpressional structures in the Seridó belt, and by intrusion of gran-itoids. The Cretaceous Ceará-Mirim dyke swarm crosscuts the study area with an E-W trend and the Potiguar basin outcrops north of it (Fig. 1).
2.2. Geophysical data
P-wave receiver functions, deep seismic refraction experiments, and surface-wave dispersion data indicate that the crust thickness varies from 30–32 km in the northern Borborema Province to 36–38 km in the southern part of the province (Oliveira and Medeiros, 2012;Almeida et al., 2015;Lima et al., 2015;Luz et al., 2015). This variation in crustal thickness is consistent with gravity data (Oliveira and Medeiros, 2018) and correlated with topography: elevated regions show thicker crust. Receiver function data also imply an intra-crustal discontinuity at 9–18 depth, most often observed in domains with thinner crust, such as the area sampled by the studied xenoliths (Almeida et al., 2015).
Gravity and magnetic data illuminate the structuration of the deep crust in the Borborema province (Oliveira and Medeiros, 2018). These data establish the Patos, Pernambuco, and Jaguaribe shear zones as major structures, which splay off from the Transbrasiliano Lineament, separating four crustal blocks with different geophysical characteristics: the Southern, the Transversal, the Ceará, and the Rio Grande do Norte domains. The studied xenoliths sample the mantle beneath the Rio Grande do Norte domain, which is delimited by the Jaguaribe and Patos shear zones to the west and south, and by the Atlantic Ocean to the north and east. This domain is characterized by strong magnetic con-trasts with E-W or NNE trends, correlated with the outcropping Brasi-liano structures (Fig. 1c). Magnetic anomalies also clearly define the Ceará-Mirim dykes (Fig. 1c). In addition, analysis of the Bouguer gravity anomaly shows that most of the Rio Grande do Norte domain is characterized by weak long wavelength positive anomalies, which follow the trend of the coastline (cf. Fig. 7 ofOliveira and Medeiros, 2018), suggesting that crustal thinning related to the Atlantic opening affected most of the domain.
The first kilometers of the lithospheric mantle structure may be probed by the analysis of Pn velocities, which decrease from 8.1 km/s to 7.9 km/s in a NW-SE refraction profile across the Borborema Province to the south of the study area (Lima et al., 2015). In the vicinity of the study area, Pn velocities are ~8.0 km/s, which for an isotropic mantle with a spinel-lherzolite composition would correspond to sub-Moho temperatures of 700–750 °C (Schutt et al., 2018).
No seismic velocity data is available for the deeper sections of the lithospheric mantle, but a recent P-wave regional travel-time tomo-graphy model (Simões Neto et al., 2019) imaged slower than average velocities at depths < 150 km in the northeastern Borborema province, just east of the study area (Fig. 1d). This low velocity anomaly coincides with a local geoid anomaly of +10 m (Ussami et al., 1999). Slower than average P-wave velocities in the shallow mantle beneath the study area are coherent with a rather shallow Lithosphere Asthenosphere
boundary (LAB), estimated at 80 km depth based on S receiver function data from the station RCBR (Heit et al., 2007). The results of the re-gional P-wave tomography for the northeastern Borborema Province are also consistent with global finite-frequency tomography models, which image lower than average S-wave velocities in the mantle at 250-km depth in this region (French et al., 2013).
SKS splitting data in the Borborema Province (Bastow et al., 2015) show a complex pattern, with highly variable delay times and fast po-larization directions, which in some places closely follow the Neopro-terozoic crustal fabric, but are oblique to it in others (Fig. 1a, c). The station closest to the xenolith sampling sites - RCBR (Fig. 1a, c) - shows a NNE-oriented fast S-wave polarization subparallel to the Brasiliano transpressive structures in the northern Seridó belt and its gneissic basement and a high delay time (1.9 ± 0.2 s) based on 9 individual measurements (Assumpção et al., 2011).
2.3. Previous studies of Macau peridotite xenoliths
The petrology and the geochemistry of Macau mantle xenoliths were studied by Comin-Chiaramonti et al. (1986), Princivalle et al. (1994),Fodor et al. (2002),Rivalenti et al. (2000, 2007). These studies identified two microstructural groups: protogranular (the dominant type) and (rare) porphyroclastic (partially recrystallized) peridotites. Protogranular microstructures are mainly observed in lherzolites, whereas porphyroclastic microstructures are usually observed in harz-burgites. Protogranular peridotites also yield lower two-pyroxene equilibrium temperatures (825 ± 116 °C) than porphyroclastic ones (> 1150 °C). Trace-element patterns and isotopic compositions of the peridotites indicate variable degrees of metasomatism by alkali-basaltic melts with EMI and minor EMII isotopic signatures, probably during multiple metasomatic events (Rivalenti et al., 2000, 2007).
3. Methods
3.1. Sampling
We have studied 22 xenoliths from 5 different Macau volcanic sites, which extend in a rough N-S trend, from the limit of the Potiguar basin to ~70 km south of it (Fig. 1). Most xenoliths analyzed in the present study come from the Pico do Cabugi basaltic neck (5°42.3′S, 36°19.4′W). The Pico do Cabugi basalts yield Ar-Ar ages 24.6 ± 0.8 Ma (Souza et al., 2003and references therein). Among the 16 xenoliths of the Pico do Cabugi in this study, 14 (marked as CA) have been collected by the authors in a field campaign in 2016 and two (marked as PC) were previously studied byRivalenti et al. (2000).
We also analyzed 6 xenoliths previously studied byRivalenti et al. (2007): two from the Serra Aguda neck (AG, 5°31′S, 36°17′W), ~30 km north of the Pico do Cabugi, at the border of the Potiguar basin (Fig. 1), one from the Serra Preta do Bodó dykes (BO, 5°58′S, 36°22′W), ~20 km south of Pico do Cabugi, and four from Fazenda Geroncio (GR, 5°58′S, 36°14′W) and Serra Verde localities (SV, 6°06′S, 36°12′W), located ~30 and ~50 km south of Pico do Cabugi (Fig. 1). There are no ages for the Fazenda Geroncio and Serra Verde volcanics, but the Serra Aguda ba-salts were dated at 26 Ma (Silveira, 2006) and those at Serra Preta do Bodó, at 7.1 Ma (Knesel et al., 2011).
Most xenoliths are small (on average 3 cm of diameter), but they are very fresh. The samples display no macroscopic evidence for major interaction with the host lava. However, small pockets and films of fine-grained clinopyroxene, spinel, and olivine along grain boundaries were
Fig. 1. (a) Simplified geological map (afterVauchez et al., 1995andOliveira and Medeiros, 2018) displaying xenolith sampling locations (stars). (b) Time line of the major tectono-magmatic events in the Borborema Province. (c) Aeromagnetic anomaly map (1st vertical derivative;Costa et al., 2016) imaging middle crust structures in and around the Seridó belt. (d) P-wave tomography model for the Borborema Province at 100 km depth (Simões Neto et al., 2019) showing a marked low velocity anomaly east of the Macau-Queimadas volcanic alignment (MQA) and north of the Patos shear zone. SKS splitting data in (a) and (c) fromAssumpção et al. (2011)andBastow et al. (2015). RP: Rio do Peixe Cretaceous basin. Se: Seridó, O:Orós, and J: Jaguaribe supracrustal belts.
observed under the microscope, in particular close to the borders, in many samples. In addition, some xenoliths have pyroxenes with spongy borders, indicative of limited partial melting during extraction. These domains were carefully avoided during microprobe analyses. They were sometimes included in the EBSD analyses, but affect weakly the results because of their small area.
3.2. Electron-backscattered diffraction (EBSD) data acquisition and treatment
Petrostructural analyses were performed on all samples. Crystallographic preferred orientations (CPOs) of olivine, pyroxenes, and spinel were measured by indexing of electron-backscattered dif-fraction patterns in the SEM-EBSD facility at Geosciences Montpellier, France. Data acquisition was performed using a JEOL JSM 5600 scan-ning electron microscope with 17 kV acceleration voltage and 24 mm
working distance. We performed EBSD mapping over the entire thin section (areas ≥ 2 × 3 cm2) with step sizes between 14 μm and 35 μm,
depending on grain size. Indexation rates varied between 84% and 97%. Non-indexed points correspond mainly to fractures. During post-acquisition data treatment, we eliminated inaccurate indexing points (MAD > 1.3° and wild spikes), corrected for rare olivine pseudo-sym-metry misindexing, and filled up non-indexed pixels with at least 6 coherent neighboring measurements with the average of the neighbors' orientations.
The CPO data analysis, that is, the calculation of the orientation distribution functions (ODF) and of the misorientations, the computa-tion of the strength and symmetry of the olivine CPO, the plotting of pole figures, and the quantification of the microstructure (grains' size, shape, and orientation), was performed using the MTEX toolbox in Matlab (http://mtex-toolbox.github.io/;Hielscher and Schaeben, 2008;
Bachmann et al., 2010; Bachmann et al., 2011). The ODFs were
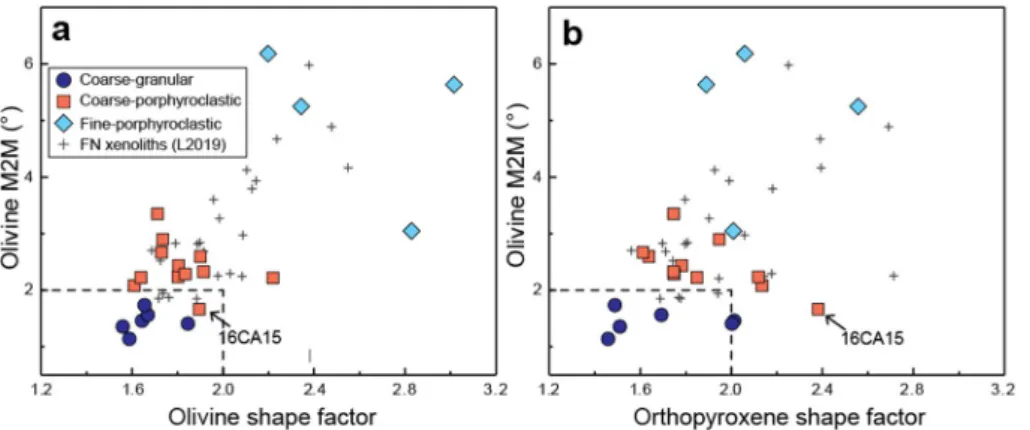
Fig. 2. Microstructural parameters calculated from
EBSD data: (a) Olivine shape factor vs. intragranular misorientation relative to the mean orientation of the grain (M2M); (b) Orthopyroxene shape factor vs. olivine M2M. All quantities are average values at the sample scale weighted by the grains' area (cf. Table 2). Similar data for Fernando de Noronha (FN) xenoliths, which sample an old domain of the equa-torial Atlantic (Liu et al., 2019), are presented for comparison.
Table 1
Microstructures, modal compositions, thermometry, and bulk rock Mg# of Macau volcanics peridotite xenoliths.
Sample Location Rock type Microstructure Modal compositions (%) Thermometry (°C) Bulk rock Mg#c
Two-pyroxene Ca-in-opx
ol opx cpx sp Rim sd Core sd Rim sd Core sd
16CA07 Pico Cabugi Lz Coarse-granular 61 22 15 2 816 52 834 9 903 22 878 11 89.0
16CA08 Pico Cabugi Lz 58 26 15 1 834 21 830 27 905 13 869 6 89.0
16CA09 Pico Cabugi Lz 70 23 7 1 923 17 920 18 970 5 958 7 90.3
16CA12 Pico Cabugi Lz 69 19 10 2
16CA14 Pico Cabugi Lz 58 28 12 2 627 38 592 51 836 148 790 16 89.4
BO9b Bodó Lz 63 22 15 < 1 946 914 899 893 90.6
16CA01 Pico Cabugi Hz Coarse-porphyroclastic 79 18 3 1 985 72 1026 180 955 3 970 41 90.9
16CA02 Pico Cabugi Hz 82 13 5 1
16CA03 Pico Cabugi Hz 87 10 3 < 1 1024 8 1111 87 1119 148 1028 149 90.7
16CA04 Pico Cabugi Lz 59 23 15 4
16CA05 Pico Cabugi Lz 71 15 14 < 1
16CA06 Pico Cabugi Lz 67 21 11 1 703 5 710 16 778 9 846 46 90.2
16CA11 Pico Cabugi Lz 72 8 18 2 693 8 691 25 813 21 809 18 89.5
16CA15 Pico Cabugi Lz 67 19 13 1 887 152 730 112 856 29 785 76 89.5
16CA18 Pico Cabugi Hz 82 16 2 1 1036 121 952 110 1005 106 942 8 90.9
GR1b Fazenda Geroncio Lz 76 16 7 1 1202 14 1183 36 1178 6 1180 7 90.0
SV8b Serra Verde Lz 77 13 9 1 1026 1008 1038 1034 90.6
SV14b Serra Verde We 53 0 45 1 91.0
AG6b Serra Aguda Lz Fine-porphyroclastic 61 24 13 1 1186 1 1192 10 89.4
AG7b Serra Aguda Hz 76 20 3 < 1 1215 6 1220 3 90.7
Pc105a Pico Cabugi Hz 72 25 4 < 1 1210 1220 91.3
Pc109a Pico Cabugi Hz 74 21 4 < 1 1225 1233 90.4
Hz: harzburgite; Lz: lherzolite; We: wehrlite. a Samples fromRivalenti et al. (2000). b Samples fromRivalenti et al. (2007).
c Estimated from the average chemical composition and the modal contents (area.%) of each mineral, except Pc105, Pc109, AG6, BO9, and SV8 for which whole rock chemical data were available.
calculated using a “de la Vallée Poussin” kernel function with a half-width of 10°. The CPO is presented as one crystallographic orientation per pixel in pole figures (lower hemispheric stereographic projections). Thin sections were cut in random orientations, because of the small size of the xenoliths. To facilitate comparison between samples, we rotated the CPO of all samples into a common reference frame, in which the maximum concentration of [100] of olivine is parallel to the E-W di-rection and the maximum concentration of [010] axis of olivine is parallel to the N-S direction of the pole figure. The choice of this re-ference frame can be justified a-posteriori by the analysis of the CPO, which indicates that this reference frame probably corresponds to the lineation and normal to the foliation directions (cf.Discussion).
The strength of the CPO was quantified using the dimensionless J-index (Bunge, 1982). The J-index for a random CPO is 1; it can reach up to 20 in natural peridotites, with a peak at 3–5 (Tommasi and Vauchez, 2015). We use the dimensionless BA-index, based on the eigenvalues of the [100] and [010] axes orientation distributions (Mainprice et al., 2014), to characterize the olivine CPO symmetry. This index allows classifying the olivine CPO into three types: (i) fiber-[010], character-ized by a [010] point maxima and girdle distributions of [100] and [001] (BA-index < 0.35), (ii) orthorhombic, characterized by point maxima of [100], [010], and [001] (0.35 < BA-index < 0.65) and (iii) fiber-[100], characterized by a point maxima of [010] and girdle distributions of [010] and [001] (BA-index > 0.65). J- and BA-indexes do not depend on the reference frame.
To analyze quantitatively the microstructure, we used the grain detection method in MTEX (Bachmann et al., 2011) defining grains boundaries by misorientation angles between adjacent pixels higher than 15°. Grains composed by < 10 pixels were not considered in the microstructural analysis. The misorientation of each pixel relative to the mean orientation of the grain (M2M) and the grain orientation spread (GOS) were calculated to quantify the intracrystalline orienta-tion gradients, which are a proxy for the dislocaorienta-tion density. In addi-tion, we characterized the sinuosity of the grain boundaries by the shape factor, which is the ratio of the perimeter of the grain over the perimeter of a circle with the same area. Both the intra-granular
misorientation (M2M and GOS) and the sinuosity of grain boundaries (shape factor) should decrease in response to recrystallization.
3.3. Mineral compositions and equilibrium temperatures
Mineral compositions of olivine, orthopyroxene, clinopyroxene, and spinel were analyzed in ten samples, selected based on their micro-structure, so that all microstructural types were represented. Measurements were performed in a Cameca SX100 electron microprobe at the Microsonde Sud facility at the University of Montpellier, France at a 20 kV accelerating voltage and a 10 nA current. For each sample, we analyzed both rim and core composition in 3 to 4 grains for olivine, orthopyroxene, clinopyroxene, and spinel.
We calculated equilibrium temperatures based on the clinopyr-oxene-orthopyroxene geothermometer (Taylor, 1998) and on the Ca-in-opx geothermometer (Brey and Kohler, 1990; revised byNimis and Grutter, 2010). Average rim and core equilibrium temperatures were calculated by averaging the temperatures calculated using 3–4 rim or core compositions of individual opx grains or opx-cpx pairs for each sample. Since no reliable barometers are available for spinel-facies peridotites, we chose arbitrarily 1.5 GPa (~46 km depth) as the sure to calculate the two thermometers. Changes in the assumed pres-sure produce a variation of ~10 °C per 0.5 GPa (~11 km).
3.4. Seismic properties
Seismic properties of each sample were computed using the MTEX toolbox (Mainprice et al., 2011), using Voigt-Reuss-Hill averaging based on the CPOs and modal content of olivine, orthopyroxene, and clinopyroxene derived from the EBSD maps and on the single crystal elastic constant tensors of the three minerals and their temperature and pressure derivatives (Abramson et al., 1997;Anderson et al., 1992;Chai et al., 1997; Isaak et al., 2006;Jackson et al., 2007;Sang and Bass, 2014). Average seismic properties for the lithospheric mantle beneath the study area were estimated by averaging the elastic constant tensors of all samples with all CPO data rotated into a common reference frame.
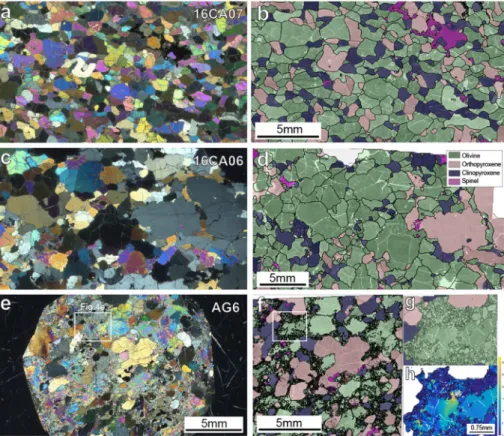
Fig. 3. Typical microstructures of Macau peridotite
xenoliths: (a–b) coarse-granular, (c–d) coarse-por-phyroclastic, and (e–f) fine-porphyroclastic. (a, c, e) Photomicrographs in cross-polarized light; scale bar is the same in all photomicrographs. (b, d, f, g) EBSD phase maps, which better illustrate the variation in shape of olivine and pyroxenes between the three microstructures. (g) Detail of a partially re-crystallized domain in fine-porphyroclastic lherzolite AG6 indicated by the white square in (f). (h) Misorientation relative to the mean orientation of the grain (M2M) map illustrating the difference in in-tragranular misorientation in olivine between por-phyroclasts (high M2M) and neoblasts (low M2M) in the same domain.
The assumption is that the orientation of the lineation and foliation is constant both laterally and vertically. The average seismic properties provide therefore an estimate of the maximum seismic anisotropy that could be produced, if the xenolith sampling is representative of the variability of compositions and CPO in the lithospheric mantle beneath the studied area.
4. Data
4.1. Microstructures
Previous studies (Fodor et al., 2002;Rivalenti et al., 2000;Rivalenti et al., 2007) have correlated optical observations of the microstructures with chemical compositions and equilibrium temperatures to divide the Macau peridotite xenoliths into two groups: protogranular and por-phyroclastic. In the present study, we added to the optical observations the quantitative analysis of the microstructural data derived from EBSD mapping. Based on these data, in particular the intragranular mis-orientation of olivine and the olivine and orthopyroxene grain shapes (Fig. 2), we classify the Macau peridotites into three microstructural groups (Table 1): coarse-granular (6), coarse-porphyroclastic (12), and fine-porphyroclastic (4). The coarse-granular and coarse-porphyr-oclastic groups correspond to a continuous variation in microstructure (Figs. 2 and 3). They were described as protogranular in the previous studies. The fine-porphyroclastic group is clearly different from the other two groups (Figs. 2 and 3); it was described as porphyroclastic in
the previous studies.
There is no relation between microstructure and sampling site. All three microstructures are represented among the Pico do Cabugi peri-dotites, which is the best-sampled site in the present study, and in at least one of the other sampling localities (Table 1). This observation is corroborated by the previous studies, which analyzed a larger number of peridotite xenoliths from other Macau volcanic centers (Fodor et al., 2002; Rivalenti et al., 2007). Coarse granular and coarse porphyr-oclastic microstructures predominate in all sites. Fine-porphyrporphyr-oclastic peridotites are always minor. They were only recovered in three sites, which are nevertheless > 60 km apart (Fig. 1): Serra Aguda, Cabugi, and Serrote Preto (a small plug ca. 30 km to the SSE of Pico do Cabugi,
Fodor et al., 2002).
Coarse-granular peridotites are characterized by roughly equi-granular microstructures (Fig. 3a–b). Olivine and orthopyroxene pyr-oxene grains are on average 1–3 mm, clinopyrpyr-oxene slightly smaller: 0.8–1 mm (Table 2). Both olivine and pyroxenes have curvilinear to straight grain boundaries, evolving locally into polygonal shapes with 120° triple junctions (Fig. 4a), and very low densities of intracrystalline deformation features, such as undulose extinction, subgrains, or kinks (Figs. 3a and4a). Quantitatively, these observations translate into low shape factors ≤ 1.85 for olivine and ≤2 for orthopyroxene and into low M2M values ≤ 2° for olivine (Fig. 2). Lherzolite 16CA14 has an inter-mediate microstructure characterized by polygonal olivine grains, but pyroxenes with irregular shapes (Figs. 2 and 4b). Most coarse-granular peridotites display a weak olivine shape-preferred orientation (SPO)
Table 2
Quantitative texture and microstructure parameters derived from EBSD mapping for olivine, orthopyroxene, and clinopyroxene.
Sample Microstructure/domain analyzed Olivine Orthopyroxene Clinopyroxene
J-index BA-index M2M (°) GOS (°) Shape factora Grainsizea
(μm)
Aspect
ratioa Shapefactora Grainsizea
(μm)
Aspect ratioa Grainsizea
(μm)
Aspect ratioa
16CA07 Coarse-granular Bulk-rock 5.8 0.34 1.56 1.27 1.67 1381 1.81 1.69 1126 1.61 827 1.61
16CA08 Bulk-rock 6.6 0.35 1.36 0.74 1.56 1493 1.69 1.51 1322 1.57 936 1.62 16CA09 Bulk-rock 6.4 0.46 1.14 1.61 1.59 2233 1.55 1.46 1401 1.53 872 1.60 16CA12 Bulk-rock 6.3 0.62 1.73 1.33 1.65 2134 1.59 1.49 1190 1.51 926 1.67 16CA14 Bulk-rock 4.7 0.33 1.46 1.06 1.64 1899 1.55 2.01 2688 1.57 1007 1.61 BO9^^ Bulk-rock 6.5 0.84 1.41 0.88 1.85 1577 2.04 2.00 1669 1.80 1008 1.80 16CA01 Coarse-porphyroclastic Bulk-rock 6.6 0.77 2.60 1.27 1.90 2428 1.86 1.64 1088 1.83 799 1.61 16CA02 Bulk-rock 6.2 0.81 2.67 1.52 1.73 2001 1.66 1.61 1194 1.62 636 1.70 16CA03 Bulk-rock 6.8 0.73 2.90 1.34 1.74 2140 1.78 1.95 894 1.94 248 1.86 16CA04 Bulk-rock 4.8 0.45 2.08 1.90 1.61 1813 1.56 2.14 2678 1.54 1124 1.63 16CA05 Bulk-rock 3.8 0.47 2.22 1.39 1.64 1856 1.62 1.85 2503 1.96 1074 1.61 16CA06 Bulk-rock 7.3 0.27 2.23 1.17 1.80 2192 1.64 2.12 3376 1.82 925 1.59 16CA11 Bulk-rock 5.8 0.31 3.35 1.48 1.71 2281 1.63 1.75 3298 1.58 1131 1.70 16CA15 Bulk-rock 5.1 0.48 1.66 0.78 1.90 1837 1.66 2.38 3279 1.76 947 1.69 16CA18 Bulk-rock 8.0 0.82 2.44 1.36 1.80 2416 1.93 1.78 1197 2.02 459 1.89 GR1 Bulk-rock 8.5 0.45 2.28 1.37 1.83 2507 1.87 1.75 1378 1.62 1048 1.52 SV8 Bulk-rock 9.0b 0.27 2.33 2.26 1.91 1589 2.04 1.75 1337 1.85 775 1.56 SV14 Bulk-rock 6.8 0.37 2.22 1.38 2.22 1655 1.68 1713 1.56 AG6
Fine-porphyroclastic PorphyroclastsBulk-rock 9.54.6b 0.550.44 5.648.07 5.661.96 4.043.02 12212143 1.691.74 1.891.89 16461672 1.451.45 920965 1.731.73
Neoblasts (30%) 2.2 0.27 2.51 1.50 1.77 117 1.61 1.69 157 1.59 175 1.72 AG7 Bulk-rock 16.6b 0.40 3.05 0.89 2.83 3062 1.67 2.01 1301 1.62 729 1.63 Porphyroclasts 24.6b 0.41 3.67 4.05 3.17 3814 1.67 2.06 1511 1.56 906 1.61 Neoblasts (22%) 2.8 0.38 0.57 0.49 1.60 365 1.65 1.82 540 1.82 418 1.66 Pc105 Bulk-rock 6.4 0.25 6.18 1.47 2.20 2133 1.68 2.06 2772 1.75 748 1.52 Porphyroclasts 8.2 0.26 7.22 5.30 2.36 2538 1.70 2.10 2919 1.74 865 1.48 Neoblasts (15%) 2.1 0.26 0.54 0.56 1.49 311 1.57 1.48 464 1.91 435 1.61 Pc109 Bulk-rock 7.5 0.18 5.25 1.48 2.34 2330 1.74 2.56 1881 2.04 1082 1.95 Porphyroclasts 9.2b 0.18 5.96 4.86 2.48 2682 1.78 2.63 2046 2.04 1231 2.01 Neoblasts (14%) 2.6 0.20 0.61 0.59 1.55 358 1.52 1.90 476 2.09 358 1.65
All values are averages over the entire EBSD map, weighted by the grain area.
M2M: misorientation relative to mean orientation of the grain; GOS: grain orientation spread; Rex: recrystallized.
a Grain sizes, aspect ratios, and shape factors are apparent 2D values. Aspect ratios may be underestimated since many sections were not cut on the XY structural plane.
(Fig. 3a), but BO09 has higher olivine aspect ratios (Table 2) and a clear olivine SPO, which results in a tabular microstructure. Pyroxene grains usually show no exsolutions (Figs. 3a and4a–b). Spinel grains have holy-leaf or interstitial shapes. Coarse holy-leaf spinels may contain rounded inclusions of olivine or pyroxenes (Fig. 3b).
Coarse-porphyroclastic microstructures are characterized by vari-able grain sizes. In most cases, the grain size variation is continuous and it is difficult to discriminate between porphyroclasts and neoblasts (Fig. 3c–d). Olivine has more irregular grain shapes and clear evidence for intracrystalline plastic deformation (Figs. 3c–d and 4c). Olivine grains have shape factors between 1.6 and 2.2, consistently with the more sinuous grain boundaries, and higher M2M values ranging from 2° to 3.4° (except 16CA15), consistent with the higher frequency of un-dulose extinction and subgrain boundaries (Fig. 2). Orthopyroxene grains also have irregular shapes (Figs. 3c–d and4c–d), which are as-sociated with shape factors from 1.6 to 2.4 (Fig. 2b). Orthopyroxene grain boundaries often show embayments or cuspate shapes at the contact with olivine grains (Fig. 4c–d). Clinopyroxene grains also show irregular or interstitial shapes (Fig. 3c–d). In some samples, orthopyr-oxene grains display exsolutions (Fig. 3c). Undulose extinction and kinks are observed locally. Spinel usually has irregular shapes and oc-curs in association with ortho- or clinopyroxene (Fig. 3d).
Fine-porphyroclastic peridotites show a well-developed bimodal olivine grain size distribution, characterized by coexistence of coarse porphyroclasts with serrated grain boundaries, undulose extinction, and closely-spaced subgrain boundaries with a recrystallized matrix
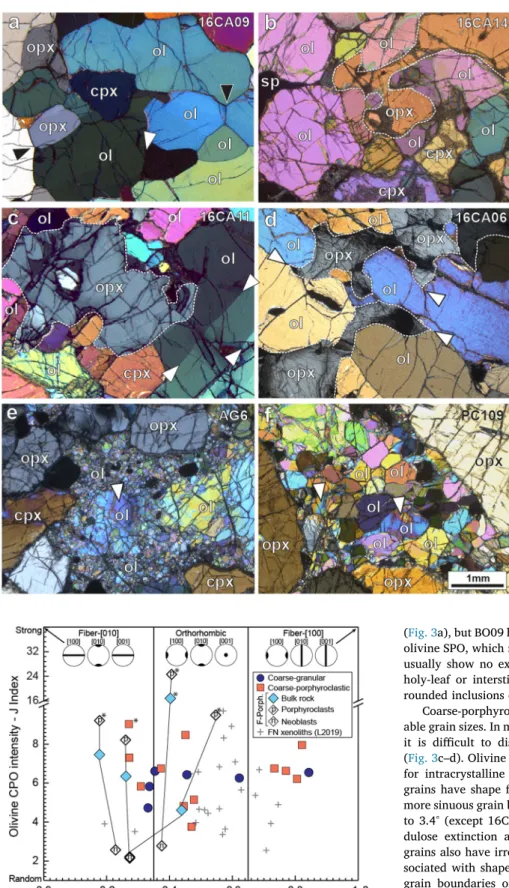
Fig. 4. Photomicrographs in cross-polarized light
displaying typical features for the three micro-structural groups. (a) Coarse granular lherzolite dis-playing polygonal grains (black arrow marks a 120° triple junction) almost free of intracrystalline de-formation features, white arrow indicates a relict subgrain boundary in olivine (ol). (b) Coarse gran-ular lherzolite 16CA14 displaying polygonal strain-free olivine grains, but irregularly-shaped orthopyr-oxene (opx) grains (highlighted by dashed line). (c–d) Coarse porphyroclastic lherzolites 16CA11 and 16CA06 showing irregularly shaped olivine, ortho-pyroxene (highlighted by dashed line), and clin-opyroxene (cpx) grains with interpenetrating inter-phase boundaries, white arrows indicate subgrain boundaries in ol in (c) and mark cusp shaped opx in contact with ol in (d). (e) Fine-porphyroclastic lher-zolite AG6 showing a matrix of very fine re-crystallized olivine neoblasts surrounding a coarse olivine porphyroclast with undulose extinction and subgrains (white arrow). (f) Fine-porphyroclastic harzburgite PC109 showing tabular, strain-free oli-vine neoblasts as well as relicts of olioli-vine porphyr-oclasts with undulose extinction (white arrow) within a strongly recrystallized domain between opx porphyroclasts. Scale bar is the same in all photo-micrographs.
Fig. 5. Olivine CPO symmetry (BA-index) vs. CPO strength (J-index). The
variation in olivine CPO pattern as a function of BA-index is illustrated at the top of the diagram. For fine-porphyroclastic peridotites, we present data for the bulk rock and for porphyroclasts and neoblasts separately. Values are presented inTable 2. * indicates J-indexes that are probably overestimated, because < 100 grains could be analyzed in the thin section. CPO data for Fernando de Noronha (FN) xenoliths (Liu et al., 2019) are displayed for comparison.
composed by polygonal olivine neoblasts free of intracrystalline de-formation (Figs. 3e–h and4e–f). The average size of the recrystallized grains varies between samples (Table 2): it is ~100 μm in AG6 (Fig. 4e), but > 300 μm in the other fine-porphyroclastic peridotites (Fig. 4f,
Table 2). It is noteworthy that the recrystallized olivine grains are not
organized in a planar mode, marking a foliation, but either form irre-gular pockets or vein-like structures (Fig. 3e–f). Orthopyroxene is usually coarser than clinopyroxene (Fig. 3f). Exsolutions were not ob-served in this group. Shape factors of orthopyroxene vary between 1.89 and 2.56 (Fig. 2). In AG6 and AG7, pyroxenes have rounded shapes
Fig. 6. Crystal preferred orientations (CPO) of olivine, orthopyroxene, and clinopyroxene for all studied fine-porphyroclastic, granular peridotites, and
coarse-porphyroclastic peridotites. Lower hemisphere stereographic projections with contours at 1 multiple of a uniform distribution intervals. The three pole figures for each mineral are plotted using the same scale. For the fine-porphyroclastic peridotites, the CPO of olivine porphyroclasts is presented as points (in red) and the CPO of olivine neoblasts is presented as contours. Black arrows indicate pyroxene CPO that are well correlated with the olivine CPO and gray arrows indicate those partially correlated. When the sample shows a olivine shape preferred orientation marking a foliation, the latter is displayed as a dashed line in the olivine [010] pole figure. (For interpretation of the references to color in this figure, the reader is referred to the web version of this article.)
(Fig. 3f), whereas in PC105 and PC109 fine-porphyroclastic samples, pyroxenes have irregular shapes, with cusp-like terminations when in contact with olivine, similarly to pyroxenes in coarse-porphyroclastic peridotites. Spinel occurs as fine rounded grains (Fig. 3f).
4.2. Crystallographic preferred orientations (CPO)
Quantitative data on the intensity and symmetry of the olivine CPO (J- and BA-indexes) as well as pole figures of the olivine, orthopyr-oxene, and clinopyroxene CPOs for all studied samples are presented in
Figs. 5 and 6andTable 2. For the samples in which a foliation was observed, the latter is displayed on the pole figures (Fig. 6). In these samples, the olivine [010] maximum is normal to the foliation.
Olivine has moderate to strong CPO (Figs. 5 and 6). With exception of harzburgite AG7, which has a very high J-index of 16.6 due to a few coarse olivine porphyroclasts that occupy most of the thin section, and lherzolite SV8 (small sample), the J-index varies between 3.8 and 8.5, with a mean of 6.4. The CPO symmetry varies between fiber-[010], orthorhombic, and fiber-[100] patterns. Fine-porphyroclastic perido-tites display olivine CPO patterns intermediate between fiber-[010] and orthorhombic and the neoblasts have systematically weaker olivine CPO (Figs. 5 and 6). There is no systematic variation of J-index or BA-index within the two other microstructural groups. Most coarse-gran-ular samples display orthorhombic olivine CPO patterns with J-indexes around 6 (Figs. 5 and 6). Coarse-porphyroclastic samples have more variable olivine CPO patterns and intensities (Fig. 5). Four coarse-porphyroclastic harzburgites (16CA01, 16CA02, 16CA03, and 16CA18) have strong CPO with fiber-[100] patterns (Fig. 6). The remainder coarse-porphyroclastic peridotites display olivine CPO of variable in-tensity and orthorhombic patterns with a tendency towards fiber-[010], expressed as girdle of [100] with a maximum within it and a point maximum of [010] (Fig. 6).
Orthopyroxene CPO is consistent with the olivine CPO in the ma-jority of the studied peridotites. It is characterized by [001]opx and
[100]opx (or [010]opx) maxima parallel to the [100]ol and [010]ol
maxima, respectively, suggesting a common deformation history (ar-rows inFig. 6). However, coarse-porphyroclastic harzburgites 16CA01, 16CA02, 16CA03, 16CA18 and coarse-granular lherzolite 16CA09 show weak orthopyroxene CPO that are not consistent with the olivine CPO, characterized by a weak [001]opxmaximum at high angle to a
well-developed [100]olmaximum.
Clinopyroxene shows more dispersed CPO, but which are, in many samples, consistent with both olivine and orthopyroxene CPO patterns, characterized by [001]cpxand [010]cpxmaxima subparallel to [100]ol
and [010]olmaxima (arrows in Fig. 6). However, in most
fine-por-phyroclastic peridotites and in coarse-granular lherzolite 16CA12, al-though the orthopyroxene CPO is consistent with the olivine CPO, the clinopyroxene CPO is not. In coarse-porphyroclastic harzburgites (16CA01, 16CA02, 16CA03, 16CA18) neither the orthopyroxene nor the clinopyroxene CPO are correlated with the olivine CPO.
4.3. Modal compositions
All samples are spinel-facies peridotites. Lherzolites predominate (14/22), but the sampling also includes 7 harzburgites and 1 wehrlite (Fig. 7 andTable 1). Predominance of fertile peridotites with no de-pendence on sampling site was also observed in previous sampling of Macau xenoliths byRivalenti et al. (2000, 2007;Fig. 7).
The compositions of the two microstructural groups overlap, but coarse-granular peridotites are on average more fertile (ol contents of 57–70%) than coarse-porphyroclastic peridotites (ol contents be-tween 67 and 87%, with one outlier, 16CA04, which has 59% of olivine and an intermediate microstructure). Fine-porphyroclastic peridotites display variable olivine contents overlapping with the two other groups.
Comparison of the modal compositions to those predicted by var-ious partial melting models highlights that roughly half of the studied Macau xenoliths are enriched in clinopyroxene or olivine relatively to the models' predictions (Fig. 7). Even for those samples plotting along the partial melting trends, a large variability in partial melting degrees, from 1 to 20% melting, has to be invoked to explain the full range of observed modal compositions. Such a variation in partial melting is difficult to reconcile within the limited volume of the mantle sampled by the volcanic eruptions. This suggests reactive melt percolation leading to either crystallization of clinopyroxene and/or orthopyroxene at the expenses of olivine (refertilization processes, e.g.Le Roux et al., 2007; represented by gray arrows inFig. 7) or crystallization of olivine at the expense of pyroxenes (dunitization processes, e.g.,Berger and Vannier, 1984;Kelemen, 1990; black arrows inFig. 7). The observed deviations in modal compositions relatively to partial melting trends are consistent with microstructural evidence for reactive melt perco-lation, such as the sinuous olivine-pyroxene boundaries and the cusp-like shapes of pyroxenes when in contact with two olivine grains (cf.
Figs. 3 and 4).
4.4. Mineral compositions
The chemical compositions of main mineral phases in the studied Macau peridotite xenoliths are listed in Supplementary material Table S1. Representative results are displayed inFig. 8together with previous data for Macau peridotite xenoliths (Supplementary material Table S2). Comparison between the present and previous datasets indicates that our sampling is representative of the variability in composition for these localities. Analysis of the present dataset indicates that there is no simple correlation between microstructural types and chemical com-positions (Fig. 8). There is also no relation between mineral chemistry and sampling locality.
The Mg# number [Mg# = 100 × Mg / (Fe + Mg), atomic ratio] of olivine, orthopyroxene, and clinopyroxene ranges between 89.1 and 91.6 (average 90.0), 89.1–91.7 (average 90.4), and 87.9–92 (average 90.9), respectively (Fig. 8a, b). Core-rim variations in Mg# are weak for all three minerals in most samples. Olivine and orthopyroxene Mg# within each sample show low dispersion and are positively correlated, with the orthopyroxene being slightly enriched in Mg relatively to olivine (all data points, except fine-porphyroclastic peridotites AG6 and AG7, plot slightly above the 1:1 line inFig. 8b). Clinopyroxene Mg# shows much higher variability at the sample scale, in particular within coarse-porphyroclastic harzburgites, indicating chemical dis-equilibrium at the mm-scale. Moreover, average clinopyroxene Mg# in
Fig. 7. Modal compositions of the studied peridotites presented as
clinopyr-oxene/orthopyroxene ratio vs. olivine modal content and as the traditional ol-opx-cpx ternary diagram (inset). Modal compositions of Cabugi and other Macau volcanics peridotite xenoliths studied byRivalenti et al. (2000, 2007) are plotted for comparison. Black and gray curves represent the evolution of the modal composition predicted by different partial melting models for an initial fertile modal composition of 55% ol, 28.5% opx, and 16.5% cpx (Baker and Stolper, 1994;Kostopoulos, 1991;Niu, 1997;Walter et al., 1995). Gray arrows indicate evolution trends associated with cpx and/or opx crystallization at the expense of ol (refertilization reactions). Black arrows indicate evolution trends associated with ol crystallization at the expense of pyroxenes (dunitization reactions).
neither cores nor rims display any simple correlation with the olivine Mg# (Fig. 8a). Most measured Mg# spread between the 1:1 and the Fe-Mg partition trend between olivine, clinopyroxene, and melt in oceanic troctolites (Lissenberg and Dick, 2008), but fine-porphyroclastic peri-dotites AG6 and AG7 have clinopyroxenes enriched in Fe relatively to olivine.
Olivine cores show low Ca contents with a weak positive correlation with Mg# (Fig. 8c), except for the fine-porphyroclastic peridotites and the coarse-porphyroclastic lherzolite GR1, which have high Ca con-tents. Olivine rims in all studied peridotites are enriched in Ca and show a high variability at the thin section (mm-cm) scale.
Clinopyroxene TiO2contents (wt%) do not show the simple positive
correlation with cpx modal content (%) expected if partial melting controlled the chemistry of the peridotites (Fig. 8d). Among the harz-burgites, four have Ti-poor clinopyroxene (TiO2 contents < 0.2%),
while the other two have clinopyroxene with TiO2contents of 0.55%.
All harzburgites show marked variability in the Ti-content of clin-opyroxene at the sample scale, indicating disequilibrium. Half of the lherzolites have clinopyroxenes with almost constant TiO2 contents
between 0.55 and 0.65%, independently of the clinopyroxene modal content. The remaining lherzolites have rather Ti-poor clinopyroxene grains.
Spinel Cr# [Cr# = 100 × Cr / (Cr + Al)] and Mg# contents corre-late with the modal composition. Harzburgites have spinel with Cr# ranging between 40 and 57.5 and Mg# ranging between 61 and 72, whereas lherzolites have spinel with Cr# between 8 and 20 and Mg# between 73 and 84 (Supplementary material Fig. S1a). Yet, the lher-zolites show a clear enrichment in Mg in spinel relatively to a typical depleted mantle composition. Fine-porphyroclastic lherzolite AG6 has the highest spinel Mg# (83) and lowest Cr# (11). TiO2contents (wt%)
in spinel are low (≤0.18%) in most lherzolites (Supplementary mate-rial Fig. S1b). In contrast, spinel in coarse-porphyroclastic harzburgites and lherzolite GR1 has a wide range of average TiO2contents, which
may reach 1.03%, with strong variations within each sample, indicating disequilibrium. Spinel in fine-porphyroclastic lherzolite AG6 also has a fairly high TiO2content of 0.45%.
4.5. Equilibrium temperatures and geotherm estimation
Most equilibrium temperatures determined using two-pyroxenes geothermometer ofTaylor (1998; TTA98)and the Ca in orthopyroxene (Ca-in-opx) ofBrey and Kohler (1990)revised byNimis and Grutter (2010)agree within ± 70 °C (gray dashed lines inFig. 9). This suggests that they are reliable. However, peridotites with cpx-opx
Fig. 8. Chemical compositions for major rock-forming minerals: (a–c) Clinopyroxene Mg#, orthopyroxene Mg#, and olivine Ca content (ppm) vs. olivine Mg#, (d)
Clinopyroxene TiO2 content (wt%) vs. modal content (%). Minerals chemical compositions for Macau peridotite xenoliths previously studied byRivalenti et al. (2000, 2007), andFodor et al. (2002)are plotted for comparison. The value of the depleted mantle (DM) fromWorkman and Hart (2005)is displayed in (a) and (b). Fe-Mg partition between olivine and clinopyroxenes in troctolites (Lissenberg and Dick, 2008) is plotted in (a). Partial melting and refertilization trends proposed by Le Roux et al. (2007)are plotted in (d). Hollow symbols represent rim compositions and solid symbols represent core ones. Error bars represent the chemical variation at the sample scale. Data is presented in Supplementary material Table S1.
temperatures < 800 °C show larger discrepancies (> 90 °C), with sys-tematically higher Ca-in-opx equilibrium temperatures. This incon-sistency between the predictions of the two thermometers is observed for both core and rim temperatures and is not correlated with the mi-crostructure. It affects two coarse-porphyroclastic peridotites (16CA06, 16CA11) and one coarse-granular lherzolite (16CA14). The latter has the lowest temperature among all samples with strong inconsistency between the predictions of the two thermometers (592 °C and 790 °C,
Table 1).
FollowingNimis and Grutter (2010), we use the temperature pre-dictions of TTA98 thermometer as the equilibrium temperatures. All fine-porphyroclastic peridotites and the coarse-porphyroclastic perido-tite GR1 have high equilibrium temperatures over 1200 °C. Coarse-porphyroclastic peridotites have two ranges of equilibrium tempera-tures: harzburgites (16CA01, 16CA03, 16CA18) as well as clinopyr-oxene-poor lherzolite SV8 have equilibrium temperatures between 900 and 1100 °C, whereas the clinopyroxene-rich coarse-porphyroclastic lherzolites (16CA06, 16CA11, 16CA15) have lower equilibrium tem-peratures between 600 and 700 °C. Coarse-porphyroclastic peridotites 16CA03, 16CA15, and 16CA18 display core-rim variations in equili-brium temperature. In most cases, rim Ca-in-opx temperatures are higher than core ones, but there is no systematic trend. All samples that display core-rim variations also show significant dispersion in both core and rim temperatures at the sample scale (bars in Fig. 10). Coarse-granular peridotites 16CA07, 16CA08, 16CA09, and BO9 have inter-mediate equilibrium temperatures between 800 and 900 °C and less variations at sample scale as well as between cores and rims. Com-parison with previous thermometry data on Macau peridotite xenoliths indicates that the present sampling is representative of the variability in this suite (Fig. 9). Analysis of the full dataset also highlights that there is no relation between equilibrium temperatures and sampling site. The full range of equilibrium temperatures is observed both among Pico do Cabugi xenoliths, which is the best sampled site, and among xenoliths from other Macau volcanics.
To estimate the Cenozoic geotherm in the northern Borborema Province, we plotted the TTA98 equilibrium temperatures of the stu-died xenoliths against the peridotite phase diagram in the upper mantle (spinel-out, plagioclase-out, and garnet-in curves for different Cr con-tents fromO'Neill, 1981 andKlemme, 2004), as well as equilibrium geotherms for different surface and reduced heat flows (Fig. 11). The geotherms are calculated assuming a surface heat flow of 60 or 70 mW/ m2(Hamza et al., 2018), a Moho depth of 32 km (Almeida et al., 2015),
an exponential decrease of the radiogenic heat production with depth, with a characteristic depth of 10 km, and a reduced heat flow of either 30 or 45 mW/m2. For comparison, we also indicate the depth of the
lithosphere-asthenosphere boundary determined by S receiver func-tions for seismic station RCBR (Heit et al., 2007) and the partial melting conditions estimated based on the compositions of the most primitive melts of the Cenozoic Macau and Mesozoic Ceará-Mirim suites (Ngonge et al., 2016a,b).
P-T equilibrium conditions of the peridotites are displayed as a fixed temperature corresponding to the TTA98 thermometry prediction, but as a pressure range, because there are no reliable barometers for spinel-facies peridotites. The range of equilibrium pressure conditions is de-fined by the occurrence of spinel in absence of plagioclase or garnet for the actual Cr content of each peridotite (O'Neill, 1981;Klemme, 2004). The wide range of equilibrium temperatures suggests that the stu-died peridotites represent a complete sampling of the subcontinental lithospheric mantle. The absence of garnet in the entire suite, which is largely composed of peridotites with Cr# < 15, constrains a maximum equilibrium depth of the studied peridotites shallower than 75 km (Fig. 10). By consequence, the equilibrium conditions of the Macau peridotite xenoliths, except 16CA14 that has the lowest and likely un-reliable equilibrium temperature, are better fitted by the hotter geo-therm (green line inFig. 10).
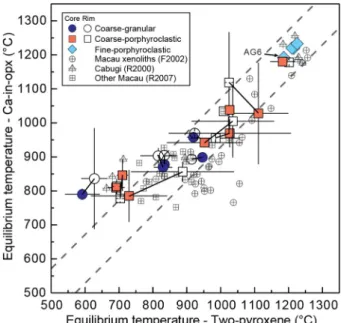
Fig. 9. Average core and rim equilibrium temperatures calculated using the
cpx-opx thermometer (TTA98,Taylor, 1998) and the Ca-in-opx thermometer (Ca-in-opx,Brey and Kohler, 1990, revised byNimis and Grutter, 2010). Che-mical compositions fromRivalenti et al. (2000, 2007)andFodor et al. (2002) were used to recalculate the equilibrium temperatures for their samples using the same thermometers (data is presented in Supplementary material Tables S2 and S3). Error bars represent data spread within each sample. Gray dashed lines outline a ± 70 °C variation between the two thermometers.
Fig. 10. P-T diagram comparing the equilibration conditions estimated for the
studied Macau xenoliths to two possible steady-state geotherms for the north Borborema province (surface/reduced heat flows indicated in parenthesis). Xenolith data is better fitted by the hotter geotherm (surface and reduced heat flows of 75 and 45 mW/m2, respectively). Since no barometers are available for spinel peridotites, equilibrium pressure ranges are presented as bars, based on the absence of plagioclase and of garnet in the studied peridotites, considering their Cr# (Supplementary information Table S1) and the effect of Cr on the spinel-garnet phase transition (Klemme, 2004; O'Neill, 1981). Dry and wet solidus with variable H2O contents afterRingwood (1975). Moho and Litho-spheAsthenosphere Boundary (LAB) depths derived from S-P and P-S re-ceiver function analyses (Almeida et al., 2015,Heit et al., 2007) as well as partial melting conditions derived from the primitive melt compositions of the Cretaceous Ceará-Mirim dyke system (CMDS) and Cenozoic Macau volcanics (Ngonge et al., 2016a,b) are displayed for comparison. (For interpretation of the references to color in this figure, the reader is referred to the web version of this article.)
4.6. Seismic properties
For calculating seismic properties, we divided the xenoliths into two groups as a function of their TTA98 equilibrium temperature: low (T < 1000 °C) and high-temperature (T > 1000 °C). Then, we esti-mated the elastic tensors of the individual samples (Supplementary material Table S3) for the pressure and temperature conditions pre-dicted at 50 km (1.46 GPa and 916 °C) and 70 km depth (2.12 GPa and 1189 °C) for the geotherm that best fits the xenolith data (Qs = 70 mW/ m2and Qm = 45 mW/m2, green line inFig. 10).
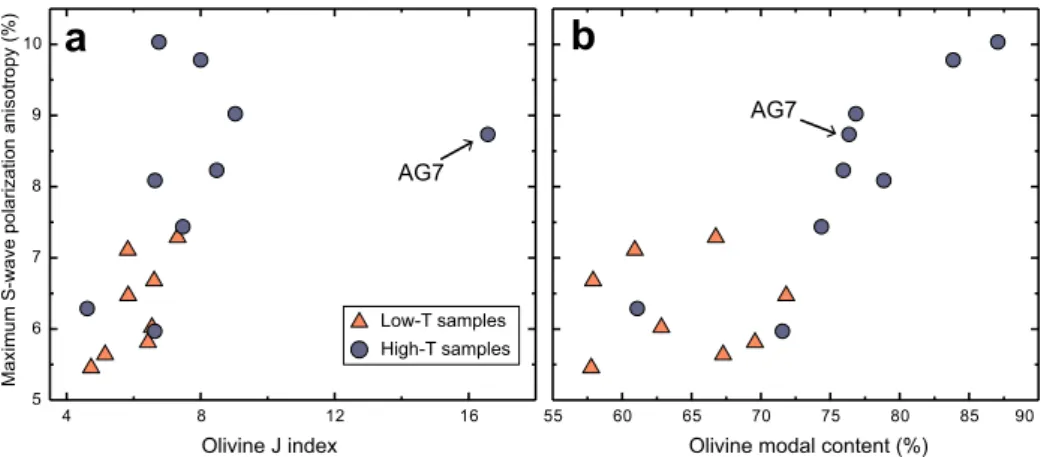
Seismic anisotropy patterns of the individual samples vary slightly as a function of the olivine CPO symmetry. As usual, the seismic ani-sotropy intensity correlates positively with both the olivine CPO strength and olivine modal content (Fig. 11). On average, the perido-tites equilibrated at temperatures < 1000 °C tend to display lower an-isotropy, due to both more dispersed olivine CPO and lower olivine contents. However, seismic anisotropy intensity does not increase lin-early with increasing J-index. By consequence, overestimation of the olivine CPO intensity for fine-porphyroclastic harzburgite AG7 does not
result in similar overestimation of its seismic anisotropy. The maximum S-wave polarization anisotropy varies from 5.5 to 7.3% in the low-temperature peridotites and from 5.9 to 10% in the high-low-temperature ones (Fig. 11andTable 3). Similarly, the maximum P-wave propagation anisotropy varies from 7.4 to 10% and from 7.7 to 14.2% (Table 3). The maximum fast (S1) wave propagation anisotropy varies from 3.0 to 5.9% in low-temperature samples and from 4.1 to 7.2% in high-tem-perature ones, whereas the maximum slow (S2) wave propagation an-isotropy varies from 3.4 to 5.2% and from 1.9 to 7.3%, respectively (Table 3).
Since seismic waves average elastic properties over large volumes, we calculated average elastic tensors for the low-temperature and high-temperature groups by assuming a coherent orientation of the past flow directions and planes (assumed as parallel to the [100] and [010] maxima of the olivine CPO, respectively; this assumption is justified by the analysis of the CPO as discussed in the next section) over the entire lithosphere. These average seismic anisotropy patterns (Fig. 12) re-present the maximum possible seismic anisotropy in the shallow (low-temperature group) and deep (high-(low-temperature samples) sections of
4 8 12 16 Low-T samples High-T samples
a
Olivine J index Ma ximum S-wave po larizatio n anisotro py ( % ) AG7 5 6 7 8 9 10Olivine modal content (%)
55 60 65 70 75 80 85 90 AG7
b
Fig. 11. Maximum S-wave polarization anisotropy (%) vs. (a) olivine CPO intensity (J index) and (b) olivine modal content (%) for all studied xenoliths. Seismic
anisotropy data for individual samples are listed inTable 3.
Table 3
Calculated seismic properties for the individual and for the average low- and high-temperature Macau peridotites. Sample Rock type Microstructures Seismic properties (velocity in km/s and anisotropy in %)
Vp max Vp min Avp AVs Vs1 max Vs1 min AVs1 Vs2 max Vs2 min AVs2 Vp/ Vs1 max Vp/ Vs1 min AVp/Vs1 Low-temperature samples (< 1000 °C) P = 1.46 GPa; T = 916 °C 16CA07 Lz Coarse-granular 8.2 7.4 10.0 7.1 4.7 4.4 5.2 4.5 4.3 4.4 1.8 1.7 6.3 16CA08 Lz Coarse-granular 8.2 7.5 9.2 6.7 4.7 4.5 4.2 4.5 4.3 4.1 1.8 1.7 5.7 16CA09 Lz Coarse-granular 8.2 7.6 7.8 5.8 4.7 4.5 3.5 4.5 4.4 4.0 1.8 1.7 7.7 16CA14 Lz Coarse-granular 8.1 7.5 7.8 5.5 4.7 4.5 4.2 4.5 4.4 3.4 1.8 1.7 5.4 BO9 Lz Coarse-granular 8.3 7.6 9.3 6.0 4.7 4.5 3.0 4.6 4.3 5.2 1.8 1.7 9.2 16CA06 Lz Coarse-porph 8.2 7.5 9.1 7.3 4.7 4.4 5.9 4.6 4.3 4.6 1.8 1.7 5.5 16CA11 Lz Coarse-porph 8.2 7.6 7.7 6.5 4.7 4.5 3.8 4.5 4.4 3.2 1.8 1.7 5.5 16CA15 Lz Coarse-porph 8.2 7.6 7.4 5.6 4.6 4.5 3.4 4.5 4.4 4.3 1.8 1.7 5.3 Average – – 8.2 7.6 7.9 5.2 4.7 4.5 3.6 4.6 4.4 3.7 1.8 1.7 5.5 High-temperature samples (> 1000 °C) P = 2.12 GPa; T = 1189 °C 16CA01 Hz Coarse-porph 8.4 7.4 12.3 8.1 4.6 4.4 4.1 4.5 4.2 7.1 1.9 1.7 10.9 16CA03 Hz Coarse-porph 8.5 7.4 14.0 10.0 4.7 4.4 6.3 4.5 4.2 7.3 1.9 1.6 13.5 16CA18 Hz Coarse-porph 8.6 7.4 14.2 9.7 4.7 4.4 5.7 4.5 4.2 7.2 1.9 1.6 14.7 GR1 Lz Coarse-porph 8.2 7.4 10.4 8.2 4.6 4.4 5.9 4.5 4.2 5.4 1.8 1.7 7.3 SV8 Lz Coarse-porph 8.2 7.4 11.3 9.0 4.7 4.3 7.2 4.5 4.2 5.8 1.8 1.7 6.6 AG6 Lz Fine-porph 8.0 7.4 8.2 6.3 4.6 4.4 5.0 4.4 4.3 3.6 1.8 1.7 5.9 PC105 Hz Fine-porph 8.0 7.4 7.7 5.9 4.6 4.3 5.7 4.4 4.3 1.9 1.8 1.7 3.5 PC109 Hz Fine-porph 8.1 7.4 9.1 7.4 4.6 4.3 6.4 4.4 4.3 3.0 1.8 1.7 4.3 AG7 Hz Fine-porph 8.2 7.4 10.4 8.7 4.7 4.4 6.3 4.5 4.2 5.8 1.8 1.7 9.3 Average – – 8.3 7.4 10.5 7.7 4.7 4.4 5.8 4.5 4.3 4.9 1.8 1.7 7.4
Coarse-porph: coarse-porphyroclastic; Fine-porph: fine-porphyroclastic; Hz: harzburgite; Lz: lherzolite.
AVp: maximum P-wave propagation anisotropy; AVs: maximum S-wave polarization anisotropy; AVs1: maximum fast S-wave propagation anisotropy; AVs2: maximum slow S-wave propagation anisotropy; AVs1/Vp: maximum anisotropy of Vp/Vs1 ratio.
the lithospheric mantle, if the present sampling is representative of the volumes of the different microstructures and compositions in the li-thospheric mantle in this region.
Seismic anisotropy patterns for the shallow and deep lithospheric mantle are similar, but as already discussed, the lower part of the li-thosphere is more anisotropic (Fig. 12). The average maximum P-wave propagation anisotropy is 10.5% with velocities ranging between 7.4 and 8.3 km/s, compared to 7.9% in the shallow lithospheric mantle, where P-wave velocities vary between 7.6 km/s normal to the flow plane and 8.2 km/s parallel to the flow direction frozen in the litho-spheric mantle (Table 3). The average maximum S-wave polarization anisotropy in the lower lithospheric mantle is 7.7% compared to 5.2% in the shallower levels; in both cases it is observed for S-waves propa-gating within the flow plane but at < 45° of the flow direction. Low S-wave polarization anisotropy is observed for all S-waves propagating at low angle to the XZ plane, that is, the plane that contains both the flow direction and the normal to the flow plane. For all propagation direc-tions in which a significant polarization anisotropy is observed, the fast S-wave is polarized in the plane containing the flow direction. The average maximum S1-wave propagation anisotropy increases from 3.6% to 5.8% from the shallow to the deep mantle lithosphere. S1 ve-locity is maximum within the flow plane and minimum normal to it. S1-waves propagating within this plane show a 90° periodicity in the ve-locity variation. S2-waves average maximum propagation anisotropy increases from 3.7% to 4.9% with depth. High S2 velocities are asso-ciated with propagation within the XZ plane at ca. 45° to the flow di-rection (X) and low velocities are observed for all propagation direc-tions at high angle to X. The maximum Vp/Vs1 ratio anisotropy increases from 5.5% to 7.4% with depth. Highest Vp/Vs1 ratios (1.78–1.8) are observed for waves propagating parallel to the flow di-rection and the lowest Vp/Vs1 ratios for waves propagating normal to the flow plane.
5. Discussion
5.1. Deformation, annealing, and reactive melt percolation
Coarse-granular peridotites show polygonal grain shapes for both olivine and pyroxenes and low intragranular misorientations (olivine M2M values < 2°,Fig. 2). However, they have well-developed olivine CPO (Figs. 5 and 6). This association supports that the deformation that
produced the CPO was followed by annealing (static recrystallization), which effectively reduced dislocation densities and re-equilibrated grain shapes. The analysis of the relative intensity of the orientation of
[100], [010], and [001] of olivine, of the relations between olivine and pyroxene CPOs, and of the relations between olivine CPO and SPO (when a SPO was observed) points to deformation by dislocation creep with dominant activation of the [100](010) slip system in olivine, [001](100) in orthopyroxene, and [001](0kl) in clinopyroxene (Tommasi et al., 2000;Bascou et al., 2002). Coarse-granular peridotites have roughly constant olivine CPO intensities, but variable symmetry, covering the entire range from fiber-[100] to fiber-[010]. Fiber-[100] and orthorhombic olivine CPO are the usual patterns produced by simple shear under dry, high to moderate temperatures, and low pres-sure in the upper mantle (Tommasi et al., 1999, 2000;Hansen et al., 2014). Fiber-[010] patterns, on the other hand, require particular conditions, which may be: transpression (Tommasi et al., 1999), pre-sence of melts during the deformation (Higgie and Tommasi, 2012, 2014;Qi et al., 2018), changes in the olivine CPO by oriented growth during recrystallization (e.g.,Tommasi et al., 2008), or deformation under high stress or high pressure conditions, which would lead to increased activation of [001] glide (Durham and Goetze, 1977;
Mainprice et al., 2005; Demouchy et al., 2013). The mineralogy and microstructures and CPO of the coarse-grained peridotites falsify the last hypothesis. However, the present data does not allow for dis-criminating among the other hypotheses. The different olivine CPO symmetry may therefore result from variations in deformation regime, with fiber-[010] CPO recording transpression (which is the dominant deformation regime in the Seridó belt during the Brasiliano event), presence or not of melts during the deformation (all deformation events were accompanied by magmatism), or different CPO evolution during recrystallization.
Analysis of the bulk rock Mg# vs. olivine modal content relation (Fig. 13) shows that the compositions of most coarse-granular perido-tites deviate from partial melting trends, suggesting the occurrence of refertilization processes. Yet, most coarse-granular peridotites have coherent olivine and pyroxene CPOs (Fig. 6), which indicate co-de-formation of the two phases. Thus, if melt-rock reactions leading to refertilization occurred, they predated or were concomitant to the de-formation. Refertilization reactions produce sutured pyroxene-olivine boundaries and irregular shapes for both minerals. The equilibrated pyroxenes grain shapes in most coarse-granular peridotites indicate
Fig. 12. Average seismic properties for shallow and deep sections of the lithospheric mantle beneath the study area calculated by averaging the elastic constant
tensors of the eight low-temperature samples calculated for 916 °C, 1.46GPa and of the nine high-temperature samples calculated for 1189 °C, 2.12GPa. Lower hemisphere stereographic projections presenting the variation of the property as a function of the propagation direction relatively to the structural reference frame (flow direction (X) and normal to the flow plane (Z) shown by the inset). Black squares mark the highest values and white circles mark the lowest ones. Seismic properties data are listed inTable 3and the elastic tensors, in Supplementary material Table S4.