HAL Id: hal-02332076
https://hal.univ-lille.fr/hal-02332076
Submitted on 24 Oct 2019
HAL is a multi-disciplinary open access archive for the deposit and dissemination of sci-entific research documents, whether they are pub-lished or not. The documents may come from teaching and research institutions in France or abroad, or from public or private research centers.
L’archive ouverte pluridisciplinaire HAL, est destinée au dépôt et à la diffusion de documents scientifiques de niveau recherche, publiés ou non, émanant des établissements d’enseignement et de recherche français ou étrangers, des laboratoires publics ou privés.
Metasomatism in the sub-continental lithospheric mantle
beneath the south French Massif Central: Constraints
from trace elements, Li and H in peridotite minerals
Xiaoyan Gu, Jannick Ingrin, Etienne Deloule, Lyderic France, Qun-Ke Xia
To cite this version:
Xiaoyan Gu, Jannick Ingrin, Etienne Deloule, Lyderic France, Qun-Ke Xia. Metasomatism in the sub-continental lithospheric mantle beneath the south French Massif Central: Constraints from trace elements, Li and H in peridotite minerals. Chemical Geology, Elsevier, 2018, Chemical Geology, 478, pp.2-17. �10.1016/j.chemgeo.2017.08.006�. �hal-02332076�
Mantle metasomatism in the sub-continental lithospheric mantle
beneath the South French Massif Central: Constraints from trace
elements, Li and H in peridotite minerals
Xiaoyan GUa,b, Jannick INGRINc, Etienne DELOULEa, Lydéric FRANCEa, Qunke XIAb
a CRPG, UMR 7358 CNRS - Université de Lorraine, 54501 Vandoeuvre les Nancy, France
b School of Earth Sciences, Zhejiang University, Hangzhou, China
c Univ.Lille, CNRS, INRA, ENSCL, UMR 8207, UMET, Unité Matériaux et Transformations, F 59 000
Lille, France
Keywords: French Massif Central; Mantle metasomatism; Peridotite xenoliths; Li concentrations; δ7Li; Water contents
Abstract
Mantle metasomatism by percolating melts/fluids can significantly modify the geochemical and mineralogical compositions of the sub-continental lithospheric mantle (SCLM). We present a detailed study of these modifications in Li concentrations, δ7Li and water contents in mantle minerals from a suite of peridotite xenoliths entrained by a Cenozoic strombolian volcano in the south of the French Massif Central (FMC). The trace element compositions in clinopyroxenes and amphiboles were first investigated to track metasomatism. The wide spectrum of trace element distribution in clinopyroxenes (e.g., (La/Yb)N from 0.25 to 22.21; Ti/Eu
ratios from 453 to 4892) suggests that the SCLM have undergone metasomatism by carbonatitic melts/fluids or melts/fluids related to subducted materials. But two amphibole-bearing samples exhibit equilibrated trace element partitioning between clinopyroxenes and coexisting amphiboles, with depletion of LREE ((La/Yb)N=0.26
and 0.30), indicating that amphiboles have grown in another modally metasomatic process predating to the cryptic metasomatism accounting for LREE enrichment and HFSE negative anomalies in other samples. Li concentrations in minerals are similar to those in the normal mantle, with inter-mineral Li partitioning nearly equilibrated and intragranular Li distribution nearly homogeneous. However, the negative δ7Li values of clinopyroxenes and orthopyroxenes in some samples (as low as -8.8 ‰ in clinopyroxene of sample MC38) can be attributed to exchange with a small-volume melt of moderate Li concentration and light Li isotopic compositions, originally associated with a recycled component. The preservation of currently observed inter-mineral large Li isotopic difference indicates that the percolation of the melt should have occurred shortly before the entrainment of peridotite xenoliths by the host magma. Water contents in minerals vary from 41 to 428 ppm in clinopyroxenes, from 28 to 152 ppm in orthopyroxenes, and their roughly negative co-variation with Fo contents in coexisting olivines implies that partial melting has mainly controlled their variations among most samples. The different behaviors of OH in different metasomatized samples with LREE enrichment point to the involvement of metasomatic agents of different origins. The aqueous agent responsible for generation
of amphiboles in two samples has not lead to a notable increase of water content. 1. Introduction
Peridotite xenoliths, commonly entrained by alkali basalts or kimberlites, can provide direct informations of the sub-continental lithospheric mantle (SCLM; e.g., Pearson et al., 2014). Studies on them have demonstrated that the SCLM, depleted by partial melting in various degrees, frequently experiences modal or cryptical metasomatic modifications by melts/fluids (known as mantle metasomatism; e.g., Menzies and Hawkesworth, 1987; O’Reilly and Griffin, 2013).The latter processes are the source of significant mineralogical and geochemical variations of the SCLM (e.g., Frey and Green, 1974; Frey and Prinz, 1978; O’Reilly and Griffin, 1988; Rudnick et al., 1993, 2004; Coltorti et al., 1999; Ionov et al., 2002).
The fact that hydrogen can be incorporated into crystal lattices of mantle nominally anhydrous minerals (NAMs) has been largely recognized (e.g., Bell and Rossman, 1992; Ingrin and Skogby, 2000; Hirschmann, 2006; Demouchy and Bolfan-Casanova, 2016). As a trace element in NAMs, hydrogen also behaves incompatibly during partial melting and fractional crystallization, with the incompatibility usually compared to Ce (Michael, 1995). Meanwhile, since water is a common component of metasomatic agents at mantle depths, hydrogen contents in mantle NAMs (conventionally measured in ppm wt. H2O) is potentially an effective tracer of mantle
metasomatism (Peslier et al., 2012; Doucet et al., 2014; Demouchy et al., 2015; Denis et al., 2015).
Li incorporates into silicate mantle minerals by substituting Mg and Fe (Seitz and Woodland, 2000; Zhang and Wright, 2012) and it has an intermediate incompatibility similar to Yb during partial melting processes (Ryan and Langmuir, 1987; Brenan et al., 1998; Ottolini et al., 2009). The large mass difference between 6Li and 7Li (〜~16%)
results in significant isotopic fractionation during various geochemical processes and produces large Li isotopic variations (see Tomascak et al. (2016) for a review). Melt/fluid-rock interactions strongly affect both Li contents and Li isotopic compositions of mantle minerals (e.g., Seitz and Woodland, 2000; Seitz et al., 2004; Woodland et al., 2004; Tang et al., 2007, 2011; Albach and Rudnick, 2009; Zhang et al., 2009; Su et al., 2012, 2014; Gu et al., 2016).
The basement of the French Massif Central (FMC) was mainly formed during the Variscan orogeny (e.g., Matte, 1986). Based on petrological and geochemical observations on large quantities of peridotite xenoliths, it was proposed that the underlying SCLM is composed of two distinct domains to the north and south of the boundary at ~45°30’N (Fig. 1; Lenoire et al., 2000). The northern domain is more refractory than the southern domain. The Sr-Nd isotopic compositions of the former overlaps the compositional field of the European Asthenospheric Reservoir and those of the latter are more similar to MORB (Granet et al., 1995; Lenoir et al., 2000; Downes et al., 2003). Several studies have documented that remarkable negative anomalies of HFSE were mainly observed in xenoliths from the northern domain but less common in xenoliths from the southern domain. Thus, the northern and southern domains of the FMC were considered to be metasomatized by different types of agents, fluids/carbonatitic melts and silicate melts, respectively (Lenoir et al., 2000; Downes et al., 2003; Witting et al., 2007). Some other studies pointed out the imprints of melts/fluids likely related to recycled materials during Variscan subduction in some peridotites and pyroxenites (Downes and Dupuy, 1987; Deloule et al., 1991; Touron et al., 2008; Yoshikawa et al., 2010; Gu et al., 2016).
In this study, the major and trace element compositions, water contents, and Li concentrations and isotopic compositions of minerals in peridotite xenoliths transported by a Cenozoic volcano in the FMC were analyzed to deeply investigate the evolution of the SCLM beneath the FMC, and the behaviors of volatiles like H and Li during mantle metasomatism.
2. Geological background
Extensive magmatic activities occurred across the FMC since the early Cenozoic. They have been sub-divided into three magmatic phases: pre-rift volcanism due to lithospheric bending, rift-related volcanism due to crustal thinning, and a later (15 Ma ~ 6.9 ka ago) magmatic event resulting from asthenospheric upwelling (Michon and Merle, 2001). They spatially distribute in a few regions (Fig. 1). Large amounts of mantle xenoliths have been transported to the surface by these volcanoes (Lenoire et al., 2000). Low-velocity anomalies beneath the FMC have been observed by seismic tomography (Granet et al., 1995; Goes et al., 1999; Fichtner and Villaseñor, 2015).
They have been attributed to either a mantle plume (Granet et al., 1995; Goes et al., 1999), or a shallow thermal anomaly related to the Alpine Orogeny (Fichtner and Villaseñor, 2015).
The sampling locality was the Razas Grand quarry in Mont Coupet, situated in the Devès in the southern FMC domain (Fig. 1). The volcano erupted in strombolian mode 2 Ma ago.
3. Analytical methods 3.1 Sample preparations
More than twenty peridotite xenoliths with diameters of 3~12 cm wrapped in volcanic bombs were collected in the Razas Grand quarry. The outer basaltic shells were sawed off and the cores were cut into billets for polishing thin sections. Then, detailed petrographic observations were performed on thin sections under microscope. According to modal compositions, textures, the colors of spinel (Spl), eight representative fresh samples, free of visible intrusive veins and of any weathering feature, were selected for electron micro-probe analysis. After that analysis, a subset of six samples, covering the total major element composition range, was used for trace elements, Li, Li isotopic composition and water content measurements.
3.2 Electron micro-probe analysis
Mineral major element compositions were measured on thin sections using a Cameca SX100 electron microprobe at the Service CAMPARIS, in the Pierre and Marie Curie University (France). The operating conditions were set at an accelerating voltage of 15 kV and a beam current of 10 nA with a focused beam. Na and K were analyzed first with counting times of 10s on peak and 5s for backgrounds to minimize errors due to element migration. For other elements, counting times were 20s on peak and 10s for backgrounds. A series of natural and synthetic minerals was used as standards. At least three grains were analyzed for each mineral phase in a single thin section; at least three points were analyzed on the core and rims of each crystal.
3.3 Laser ablation inductively coupled plasma mass spectrometry (LA-ICP-MS) Trace element compositions in clinopyroxene (Cpx) and amphibole (Amp) were determined using LA-ICP-MS at GeoRessources Laboratory, University of Lorraine (France). Double-polished thick sections (~0.15 mm thick) or thin sections were
ablated in-situ using a nanosecond excimer laser (GEOLAS Pro; 193 nm wavelength). The spot size was 44 µm, the ablation frequency 5 Hz and the energy density 10 J/cm2
per pulse. The ablation products were transported in a helium flow, mixed with argon gas, and then analyzed with an Agilent 7500 ICP-MS. A complete analysis comprises 30s for background acquisition, and 50s for sample acquisition. The raw intensities of ions were recorded as a function of time. SiO2 contents obtained from electron
micro-probe analysis were used as an internal standard; NIST 612 and 614, analyzed at the beginning and end of the analytical session, were used as external standards. The concentrations of some minor elements in olivine (Ol), such as Al, Ca, Ti, Cr and Ni, were also analyzed following the same procedure.
3.4 Secondary ion mass spectrometry (SIMS)
Li concentrations and isotopic compositions were measured with a Cameca IMS1270 ion microprobe at the Centre de Recherches Pétrographiques et Géochimiques (CRPG) in France; thin sections were gold-coated before analysis. At least three points (the number of analyses depending on grain size) were measured from core to rim on each grain, in areas devoid of cracks and inclusions.
To sputter the secondary positive ions (7Li+ and 6Li+), a primary 16O- beam was used at intensity ranging from 8 to 15nA, with spot diameters of 20-40 µm, slightly varying with the different instrumental settings in individual analytical sessions. The 10kV secondary positive ions were counted without energy offset at a mass resolution of 1100 (M/ΔM) to separate the 6LiH from 7Li, in mono-collection mode. Counting rates for 7Li ranged from 1×10⁴ to 1×10⁵cps, depending on the Li content and the primary beam intensity. After a 120s pre-sputtering, twenty-five to forty cycles were accumulated with counting times of 4s, 12s and 4s for background at mass 5.7, 6Li and 7Li, respectively. Prior to every analytical session, the deadtime of the counting system was calculated according to Deloule et al. (1992). The Li isotopic ratios are expressed as δ7Li (δ7Li = [(7Li/6Li)sample/(7Li/6Li)L-SVEC-1]×1000, with /(7Li/6Li)L-SVEC
= 12.0192 (Flesch et al., 1973)). A series of mineral standards established by Su et al. (2015) was applied to calibrate the instrumental mass fractionation, defined as Δi =
δ7LiSIMS-δ7Liknown (Decitre et al., 2002). These reference minerals are from mantle
xenoliths, with Mg# comparable to the equivalent mineral phases in our samples (Supplementary table 1). Throughout the whole analytical session, the standards were analyzed to monitor the fluctuation of Δi with temporal variations of instrumental
parameters, including the primary beam intensity (Fitzsimons et al., 2000). Unlike previous studies using an IMS 3f ion probe (e.g., Decitre et al., 2002; Beck et al., 2004), reference pyroxenes and Ol do not produce the same Δi; pyroxenes and Ol have
co-variations of -0.39 and -0.52 δ unit per Mg#, respectively (Fig. 2a).Thus, due to the narrow and similar range of Mg# in our samples relative to the standards, no large inaccuracy (±1‰) is introduced when applying an averaged Δi of individual standard
minerals to calculate the δ7Li values of the corresponding sample minerals. The absence of significant compositional variation across the analyzed grains, as well as the limited compositional range of the samples, dictate that variations in our results are not the consequence of matrix effects.
The lithium ionization yield ([Li ion counts / primary beam intensity] / Li concentration)) was determined on the reference minerals (Fig. 2b), and Li concentrations of samples were calculated using average ionization yields of the standards. The estimated precision of this procedure is better than 20%. Li concentrations and isotopic composition in Amp in samples MC36 and MC53 were also measured. Because of the similar crystalline structure of Amp and Cpx, the instrumental fractionation for measuring Li isotopic compositions of Amp was calibrated with Cpx standards.
3.5 Fourier Transform Infrared (FTIR) Spectrometer 3.5.1 Spectrum collection
Infrared spectra were acquired on double polished wafers of 0.1 mm to 0.2 mm in thickness, using a Bruker Hyperion 3000 FTIR-microscope attached to a Bruker Vertex 70 spectrometer equipped with a liquid nitrogen cooled MCT detector and a KBr beam splitter in the laboratory of Infrared and Raman spectrochemistry (LASIR, Université Lille 1). The entire instrument was continuously flushed with dry air during analysis. More than twenty non-oriented grains of each mineral phase (Ol, Opx and Cpx) in a single sample were analyzed under unpolarized light in the transmission mode, with the exception of sample MC38, which is too depleted to contain enough available Cpx grains for measurement. The spectra were collected close to the cores of the grains, through optically clean pathway, void of inclusion and crack. 256 scans were accumulated at a resolution of 4 cm-1. A squared aperture (30×30 to 100×100
check the intragranular water distribution homogeneity, several large Ol and Opx grains were chosen to make profile measurements with a step size of 60 µm.
FTIR analyses by polarized light were also performed on Ol grains, the unpolarized spectra of which display hydroxyl absorption bands. The orientation of Ol crystals are identified through their Si-O overtone vibrations (1200-2200 cm-1; Lemaire et al.,
2004). The crystals with at least one principal axis in the plane of the thin sections were selected and the polarized spectrum was acquired for this particular orientation. The polarized light was obtained using a ZnSe grid polarizer. In every sample, two or three spectra were obtained on different grains for light parallel to each principle axis.
3.5.2 Calculation from infrared spectra to water contents
Water contents in minerals have been calculated from FTIR spectra based on the modified Beer-Lambert law:
2 =A/εtγ
(1)
in which, 2 is OH concentrations (H2O in wt. ppm), A is the integral absorbance
which is represented here by the integrated area beneath the hydroxyl absorption bands (cm-2), ε is the molar absorption coefficient (ppm-1cm-2), t is the thickness of
the sample (cm). The protocol followed to calculate A is to integrate the area beneath the OH absorption bands of the IR spectra averaged from more than 10 grains; this approach is reliable when linear unpolarized absorbance is below 0.3 (deviation < 10%; Kovács et al., 2008; Withers et al., 2013). Given that OH spectra in Ol are remarkably more anisotropic and have much lower absorbance than those in coexisting pyroxenes, FTIR measurements under polarized light on Ol grains were also made to compare and confirm the reliability of results from unpolarized absorbance. The bands located at wavenumbers between 3700 and 2800 cm-1 for Opx,
at wavenumbers between 3700 and 3000 cm-1 for Cpx were considered when
integrating. The absorption coefficients determined by Bell et al. (1995) are the most generally used for pyroxenes and it is the ones we used here: 14.84 ppm-1cm-2 for Opx
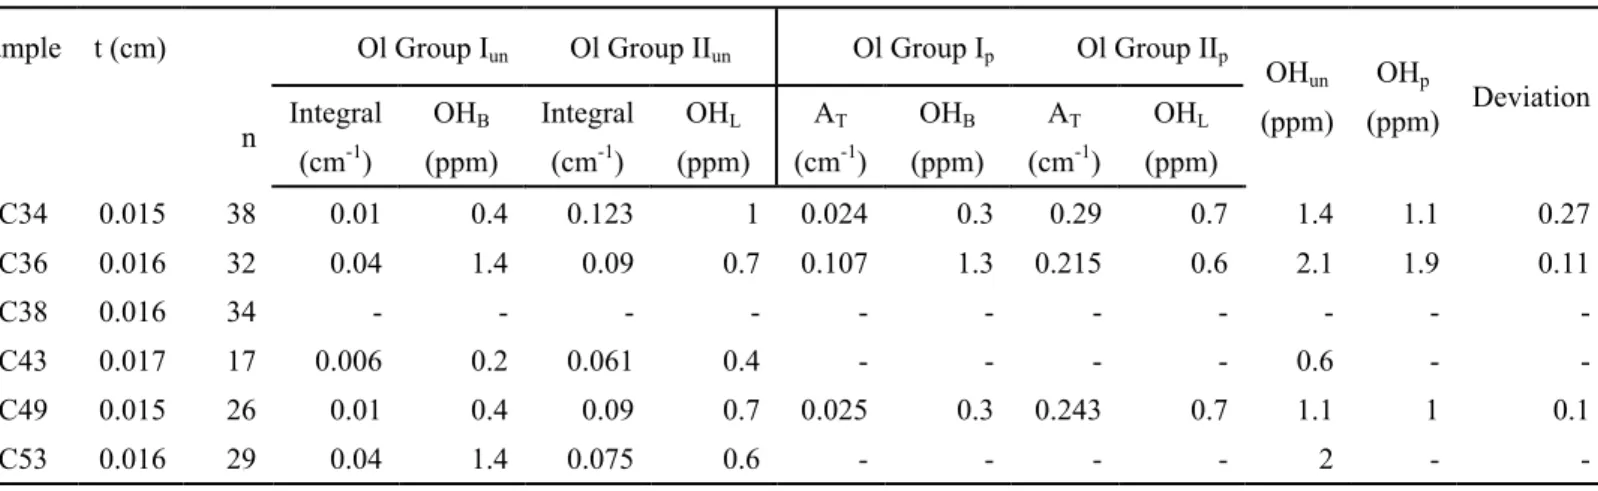
and 7.09 ppm-1cm-2 for Cpx. In our samples, OH in Ol from mantle xenoliths is
characterized by bands related to three types of defects located in three different wavenumber parts of OH absorption spectra: the group I located at wavenumbers
between the two bands related to the Ti-H defectes at 3572 and 3525 cm-1, the OH
bands related to substitution of trivalent cations in the octahedral site in the range of 3300-3400 cm-1, and the OH bands associated with octahedral vacancies in the range
of 3100-3300 cm-1 (Berry et al., 2005, 2007; Kovács et al., 2010; Blanchard et al.,
2016). The spectra of Ol to estimate the absorption coefficient in Bell et al. (2003) solely have bands related to Ti-H defects. Thus, when calculating the water contents in Ol, the bands will be integrated separately and equation 1 was applied along with the absorption coefficient (0.188 ppm-1cm-2) from Bell et al. (2003) for bands at 3572
and 3525 cm-1, whereas for the bands at lower wavenumbers associated witg trivalent
substitution and octahedral vacancies the calculation method established by Libowitzky and Rossman (1997) was used:
2 =18000×3A/εitD (2)
εi=246.6×(3753-ν) (3)
where εi is the integrated molar absorption coefficient (Lcm-2mol-1) varying on the
hydrogen bond strength (i.e., the wavenumbers (ν in equation 3; cm-1)), D is the
density of concerned mineral (gcm-3; here 3.3 gcm-3 for Ol). Here, for unpolarized
average spectra the integrated polarized absorbance (requested in the initial formula of Libowitzky and Rossman (1997)) is replaced by three times the average integrated absorbance (3×A). The thickness of samples was measured using a digital micrometer. The baseline was fitted by a 3rd order polynomial using KaleidaGraph software.
As for the polarized spectra, the integrated absorbances when E is parallel to three principle axes (x ([100]), y ([010]) and z ([001]); Fig. 4) were added together to take place of A in equation 1 and 3A in equation 2. The estimated errors from unpolarized measurements are less than 30% and those from polarized measurements are less than 10%.
4. Petrological description
According to the petrographical observations, the eight samples can be divided into two groups based on the Cpx modal proportions, spinel lherzolite (Cpx up to 15%) and spinel harzburgite (Cpx < 5%; Supplementary table 2). Two samples (MC36 and MC53) contain amphibole (Amp) in small modal proportions (less than 1%).
textures. The protogranular texture, more common in our samples, is regarded as an original texture that evolved (through plastic flow and recrystallization) to porphyroclastic (Mercier and Nicolas, 1975; Downes and Dupuy, 1987). In protogranular samples, Ol and Opx are coarse-grained and have similar grain sizes (1.5-2.5mm), whereas Cpx scattered interstitially with similar-sized or larger coexisting Ol and Opx (Fig. 3a). In samples with the porphyroclastic texture (Fig. 3b), large Ol and Opx porphyroclasts (up to 4mm across) are embedded in smaller Ol, Opx, Cpx and Spl granuloblasts (<1mm; Fig.3b). Some Ol grains have kink-banded texture (Fig. 3c). Many Opx grain boundaries are cribriform-shaped (Fig. 3d) and fine Cpx exsolutions have been observed in large Opx grains under polarized light (Fig. 3b). Amp grains in samples MC36 and MC53 are small with diameter of <1mm distributed in interstitial positions, usually adjacent to Cpx and Spl.
5. Results
5.1 Mineral major element compositions
The major element compositions of minerals in Mont Coupet samples are reported in Table 1. All the values are the averages from all the measured points on the same phase in a single sample. No significant core-rim variation was observed in any sample.
Ol forsterite (Fo) content (or Mg# = 100×molarMg/(Mg+Fe)) in samples from Mont Coupet varies from 89.6 to 91.3, falling in the range of Fo content in off-craton peridotites worldwide (Rudnick et al., 2004). No large inter-grain variation has been observed in individual samples (e.g., the standard deviation of MgO contents within every sample is less than 0.48). The Al, Ti, Cr and Ni concentrations in Ol have the range of 13.5-92.5 ppm, 3.7-14.0 ppm, 3.7-46.8 ppm and 3085-3267 ppm, respectively (Supplementary table 3). Most of these values fall in the mantle peridotite Ol ranges (De Hoog et al., 2010; Foley et al., 2013).
Opx Mg# varies from 89.8 to 91.5, and co-existing Opx and Ol have similarMg#(Table 1), which suggests a chemical equilibrium between Ol and Opx after partial melting in individual samples (Lee and Rudnick, 1999; Ottoloni et al., 2004). Al2O3 and CaO contents range from 1.72 to 3.91 wt. % and from 0.31 to 0.50
peridotites worldwide, but similar low TiO2 contents have been reported in peridotites
metasomatized by subduction-related melts (e.g., Zanetti et al., 1999; Grégoire et al., 2009; Woo et al., 2014).
Cpx are Cr-diopsides with Cr2O3 contents ranging from 0.57 to 1.34 wt. %. Mg# of
Cpx (90.2 to 93.5) is higher and shows larger variations than Fo content of coexisting Ol and Mg# of coexisting Opx (Table 3). Al2O3 and CaO contents in Cpx range from
1.88 to 6.74 wt. % and from 20.72 to 23.21wt. %, respectively.
Spl Cr# (=100×molarCr/(Cr+Al)) varies from 8.3 to 45.2, which falls in the Cr# range of Spl from subcontinental peridotite xenoliths (Arai, 1994). The ratio of Fe3+/ΣFe, as an indicator of the redox state, has been calculated from 0.07 to 0.24 in
studied samples. Some of these values are much lower than the range of the Spl in the FMC (0.16 to 0.46, Uenver-Thiele et al., 2014).
Eight Amp grains (four for each sample) were analyzed using electron microprobe. According to Leake et al. (1997), Amp in both samples are pargasite. Most major elements have similar contents in the two samples, with the exception of TiO2, 2.76
and 3.46 wt. % in MC36 and MC53, respectively (Table 3). Compared with compositions of Amp documented in previous studies (Touron et al., 2008; Uenve-Thiele et al., 2014), no obvious distinction occurs in samples from Mont Coupet.
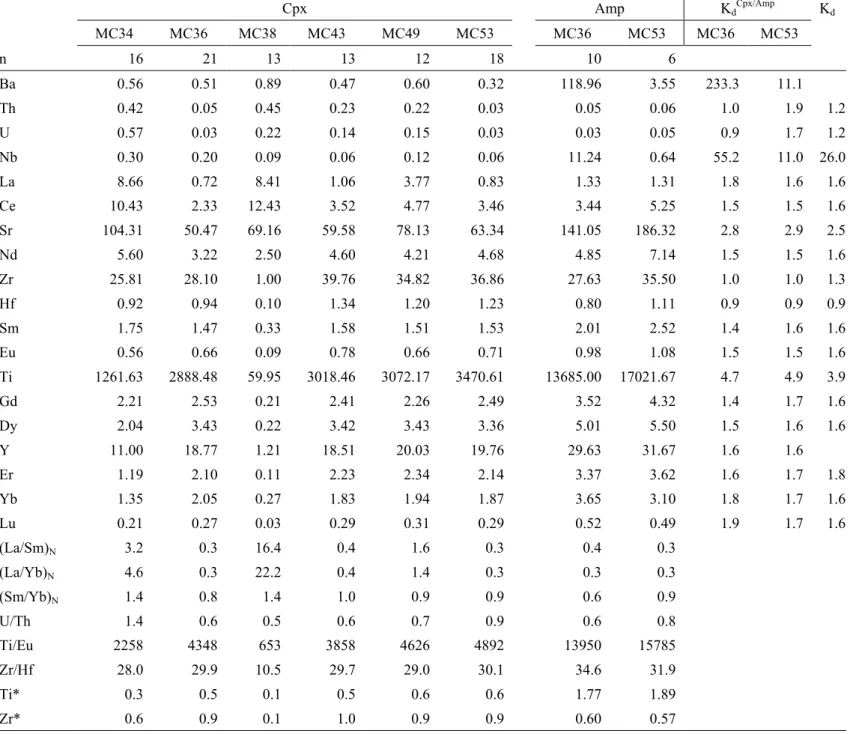
5.2 Trace element compositions in Cpx and Amp
Cpx and Amp trace element compositions are reported in Table 2. In each sample, more than 7 Cpx grains were analyzed at the cores, and the rims of 1 to 4 large grains were analyzed to monitor intragranular trace element homogeneity. No significant differences between cores and rims have been observed. For Amp, measurements were made at the cores, because Amp grains are too small to allow separate measurements at rims. No significant variation was observed among different Cpx or among different Amp grains in any given sample; thus, we will use the average contents of individual samples in the following discussion.
The chondrite-normalized REE distribution of Cpx displays different patterns among Mont Coupet samples (Fig.4a). Cpx in sample MC43 is slightly depleted in LREE relative to middle MREE, and has a nearly flat transition from MREE to HREE
((La/Yb)N=0.41; (Sm/Yb)N=0.96; the subscript ‘N’ represents normalization to
chrondrite; McDonough and Sun, 1995). Cpx chondrite-normalized REE distribution patterns in Amp-bearing sample MC36 and MC53 ((La/Yb)N=0.25 and 0.32,
respectively; (Sm/Yb)N=0.80 and 0.91, respectively), resemble with that in sample
MC43. In sample MC49, the normalized pattern shows obvious enrichment in La compared with other elements and nearly no fluctuation from CeN to LuN with
(La/Yb)N and (Sm/Yb)N values of 1.39 and 0.87, respectively. The distribution pattern
of sample MC34 exhibit upward inflection from Nd to La, and flat transition from MREE to HREE ((La/Sm)N=3.20; (Sm/Yb)N=1.44). Sample MC38 is totally different.
The sample is extremely depleted in MREE and HREE with GdN and ErN values of
1.03 and 0.67, respectively, whereas it is highly enriched in LREE with LaN value of
35.47. The pattern shows linear increase from Er to La.
The extended trace element compositions of Cpx in xenoliths from Mont Coupet are characterized by HFSE negative anomalies when element abundances are normalized to the primitive mantle (Fig. 4b). Ti and Nb anomaly occurs in all the Mont Coupet samples. The magnitude of Ti negative anomaly gradually decreases from sample MC38 (Ti*=0.10) to sample MC53 (Ti*=0.63; Ti*=2×Tin/(Eun+Gdn);
the subscript ‘n’ represents normalization to the primitive mantle). A very strong Zr negative anomaly is shown by sample MC38. Sample MC34 displays a slight Zr negative anomaly and in other samples no Zr anomaly is observed. U and Thin Cpx of all the samples display marked enrichment.
Amp REE have similar chondrite-normalized distribution patterns in sample MC36 and MC53 (Fig. 5a). They are very close to the patterns of coexisting Cpx, exhibiting LREE depletion and nearly flat transition from MREE to HREE in spider diagrams ((La/Yb)N=0.26 and 0.30; (Sm/Yb)N=0.61 and 0.90 in sample MC36 and MC53,
respectively). This similarity between REE content in Cpx and Amp attests for the equilibrium between these two phases (e.g., Chazot et al., 1996).
According to the extended trace element spider diagrams, Amp in these two samples have a slightly different patterns (Fig. 5b). Amp in sample MC36 is enriched in Nb relative to neighboring elements (U and La) whereas Amp in sample MC53 is Nb depleted. A similar difference also occurs for Ba. Compared with the distribution
patterns of coexisting Cpx, those of Amp have significant distinctions: Sr, Ti enrichment, and Zr, Hf depletion.
5.3 Li concentrations and isotopic compositions
Li concentrations and isotopic compositions of minerals in peridotite xenoliths from Mont Coupet are reported in Table 3.
Li concentrations in Ol range from 1.1 to 2.8 ppm, with small variation of averages in individual samples (2.1 to 2.5 ppm; Table 3). Li distributes nearly homogeneously from cores to rims in Ol grains. The Ol cores have a concentration range from 1.6 to 2.8 ppm similar to corresponding rims from 1.6 to 2.7 ppm. Opx in Mont Coupet samples contains Li ranging from 0.5 from 2.0 ppm. The sample averaged concentrations show little inter-sample variation (1.1 to 1.5 ppm; Table 3). Resembling to co-existing Ol grains, most Opx grains have Li concentration constant from cores to rims. Li contents in Cpx covers a range from 0.4 to 2.3 ppm, with individual sample averages ranging from 0.8 to 1.6 ppm (Table 3). The intragranular distribution in Cpx exhibits larger variation from cores to rims in some grains. On the whole, Cpx and Opx usually contain less Li than coexisting Ol in Mont Coupet samples. No significant difference in Li distribution can be observed between anhydrous samples and Amp-bearing samples.
Ol δ7Li values range from -4.1 to +12.1‰. None of the average Ol δ7Li value per
sample is negative, with a range of +0.5 to +7.7‰ (Table 3), the highest in sample MC36 and the lowest in sample MC38. No common pattern can be summarized for the intragranular Li isotopic composition variation. In fact, the variation inside most grains is within analytical errors. Li isotopic compositions of Opx have larger variation, with δ7Li values varying from -19.9 to +7.6‰. The average δ7Li value of
Opx in each sample ranges from -5.0 to +4.0‰ (Table 3), the former occurring in sample MC38 and the latter in sample MC49. In a few larger grains, the intragranular δ7Li distribution patterns show steep decrease at the points closest to the grain
boundaries. The patterns in other grains are totally irregular. Among the three mineral phases, Cpx displays the widest Li isotopic variations, from -22.9 to +14.7‰. The average δ7Li values also cover a large range (-8.8 to +4.4‰; Table 3). It is worth
are all obtained in sample MC38.
In samples MC36 and MC53, Li contents in Amp cover a narrow range of 0.7 to 1.4 ppm. In spite of the very small grain size of Amp, profiles have also been measured on each grain and no core-rim heterogeneous Li distribution was observed. Amp in both samples have δ7Li values lower than the coexisting mineral phases,
with δ7Li values varying from -11.4 to -2.1‰. The intragranular variations are
regarded within the analytical errors. 5.4 Water contents in minerals
5.4.1 Infrared spectra
The averaged Ol spectra collected under unpolarized light have bands similar to those observed in previous studies (Fig. 6a; e.g., Miller et al., 1987; Bell et al., 2003; Matsyuk and Langer, 2004; Berry et al., 2005; Peslier and Luhr, 2006; Grant et al., 2007; Walker et al., 2007; Peslier et al., 2008, 2015; Denis et al., 2013, 2015; Schämdicke et al., 2013; Doucet et al., 2014; Demouchy et al., 2015). Only bands at wavenumber 3572 and 3520 cm-1 are present at higher frequencies (Fig. 6a). Bands at
lower frequencies are present in Ol spectra of all but one sample (MC38). A broad band centered at 3225 cm-1 occurs and in some samples (MC34, MC36 and MC53)
this band is even stronger than the band at 3572 cm-1 (Fig. 6a). Two other bands
centered around 3350 and 3325 cm-1 are present in the Ol spectra from sample MC34,
but not in spectra of Ol from other samples. Core-rim profiles have been made on some large Ol grains, but no significant changes have been observed in the spectra collected from grain cores to rims, including band position, band width, and peak height (Fig. 7a).
The spectra collected under polarized light with E parallel to X, Y and Z have similar behavior to those reported in Denis et al. (2013; Fig. 6b). The bands at high frequency are dominant for E parallel to x axis, while the band centered at 3225 cm-1
is dominant in the spectra collected along z axis.
The averaged Opx spectra are shown in Fig. 6c. The band positions are similar to those reported in previous studies (e.g., Skogby et al., 1990; Grant et al., 2007; Xia et al., 2010; Sundvall and Stalder, 2011; Baptiste et al., 2012; Mosenfelder and Rossman, 2013a; Demouchy et al., 2015; Denis et al., 2013, 2015; Hao et al., 2016). The bands
are divided into several groups, between 3605-3590 cm-1, 3525-3515 cm-1, 3420-3390
cm-1, 3315-3300 cm-1, and 3080-3060 cm-1. In this study, the averaged spectra of Opx
from sample MC34, MC43 and MC49 are very similar, with the presence of all the aforementioned bands and the similar relative strengths of different bands (Fig. 6c). In Opx spectrum of sample MC38, an additional band at wavenumbers between 3578 to 3560 cm-1 appears and it overwhelm the band 3605-3590 cm-1. In contrast, the bands
centered at 3315-3300 cm-1 and 3080-3060 cm-1 are absent in the spectrum. The
spectra of Opx from two hydrous samples MC36 and MC53 resemble with each other; bands centered at 3315-3300 cm-1 and 3080-3060 cm-1 also can’t be observed; and the
band centered at 3525-3515 cm-1 contributes less to the total OH absorbance when
compared with the same band in sample MC34, MC43 and MC49. Core-rim profiles were also measured on some large Opx grains, and the infrared spectra do not display any changes from grain cores to rims (Fig. 7b).
The structural OH absorption bands in the averaged Cpx spectra of Mont Coupet are located in three narrow wavenumber ranges, between 3650-3630 cm-1, 3540-3520
cm-1, and 3465-3450 cm-1 (Fig. 6d), comparable to literature (e.g., Skogby et al., 1990;
Grant et al., 2007; Sundvall and Stalder, 2011; Baptiste et al., 2012; Mosenfelder and Rossman, 2013b). The three band types are present together in the averaged spectra of Cpx from all the Mont Coupet samples.
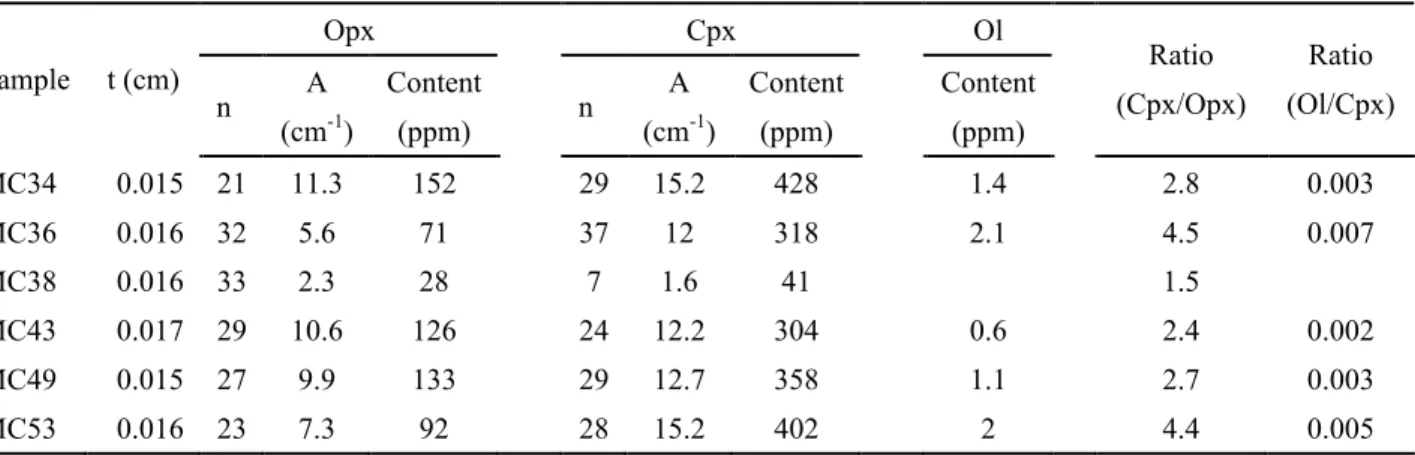
5.4.2 Water contents
The results of water contents in Ol calculated from IR spectra are shown in Table 4. No bands induced by structural OH vibration can be observed in the averaged spectrum of Ol in sample MC38 (Fig.6a). The averaging is carried out on spectra collected from more than twenty grains, so it is acceptable to assume that water content of Ol in these samples is 0 ppm (at <<1 ppm). The deviation of total water contents calculated using unpolarized spectra relative to the values estimated from polarized spectra is within the analytical errors (<30%; Table 6), so in the following sections the values from unpolarized spectra will be adopted to represent Ol water contents. Ol in Mont Coupet samples (except sample MC38) contain 0.6 to 2.1 ppm water. The maximum value occurs in sample MC34.
Table 5, where Ol water contents are also included for comparison. Opx water contents in Mont Coupet samples range from 28 to 152 ppm, the maximum value measured in sample MC34 and the minimum one in sample MC38. Cpx in sample MC38 have water content of 41 ppm, almost one order of magnitude lower than other samples (304-428 ppm). The water content ratio between Cpx and coexisting Opx (
/ ) in each sample varies from 1.5 to 4.5.
Water contents of Ol, Opx and Cpx in Amp-bearing samples (MC36 and MC53) are not higher than in other samples (Table 5). This suggests that although samples MC36 and MC53 have once experienced hydrous metasomatism, water contents of primary phases may not have been affected at that time or the imprint of water addition has been erased by subsequent metasomatic events.
6. Discussion
6.1 Mantle metasomatism after depletion by extraction of melts
During melting, incompatible elements (e.g., Ca, Al) preferentially enter the melt, whereas other elements (e.g., Mg) selectively reside in the solid phase. Cr has a higher compatibility in solid phases than Al, and in dry and low-pressure environment, more Mg remains in residuals than Fe. With the incremental degrees of partial melting of peridotites, Fo content in Ol and Cr# of Spl increase whereas Al2O3
contents in Cpx decrease (e.g., Arai, 1994; Hellebrand et al., 2001). Thus, the positive co-variation between Fo contents and Cr# of Spl and the negative co-variation between Al2O3 contents in Cpx and Cr# of Spl suggest that peridotites from Mont
Coupet have experienced partial melting in varying degrees (Fig. 8a and 8b).
Mildly incompatible elements in Cpx (HREE + Y) are commonly unaffected by later metasomatic events and negatively co-relate to Cr# of co-existing Spl, reflecting the partial melting event (Fig. 8c). In contrast, LREE contents (Fig. 8d) seem to be affected by later metasomatic events, and do not display such negative correlations. Hellebrand et al. (2001) have established a relationship linking Cr# of Spl in residual peridotites to the extent of partial melting. Using their equation, the degrees of partial melting of samples from Mont Coupet were calculated to range from 1 to 19% (Supplementary table 2). No estimate could be made on samples MC36 and MC53, for which Spl Cr# of 9.02 and 8.26, respectively, is lower than the literature data from
CH2O Cpx
CH2O Opx
other FMC localities (Werling and Altherr, 1997; Xu et al., 1998; Touron et al., 2008; Yoshikawa et al., 2010) and falls outside the available range of the equation.
Cpx trace element distributions in Mont Coupet samples display transitional variation of REE from LREE depletion to LREE high enrichment, and HFSE negative anomalies in varying degrees. Up to present, no exclusive opinions have been generally accepted on the type of metasomatic agents to induce such characteristic of trace elements in primary peridotites. HFSE negative anomalies associated with LREE enrichment have been considered as a signature of either carbonatite-bearing melts/fluids (e.g., Rudnick et al., 1993; Yaxley et al., 1998; Coltorti et al., 1999; Ionov et al., 2002), or melts/fluids released during subduction (e.g., Zanetti et al., 1999; Downes et al., 2004; Rivalent et al., 2007).
When melts/fluids percolate into a peridotite suite in depth, the crystallization of hydrous accessory minerals commonly occurs at the early stage (Ionov et al., 2002). Thus, if the melt responsible for generation of Amp in peridotites is the same as the one induced LREE enrichment in primary Cpx, Amp should keep the trace element distribution pattern characterized by LREE enrichment. But in samples MC36 and MC53, Amp are depleted in LREE (Fig. 5a) and REE partitioning between Cpx and Amp have achieved equilibrium (Table 2). Therefore, it can be considered that prior to the percolation of melts/fluids leading to LREE enrichment and HFSE negative anomalies in Cpx, another metasomatic event should have occurred to account for the generation of Amp. Meanwhile, Zr-Hf negative anomalies and Sr-Ti positive anomalies are present in Amp of both samples, totally different from coexisting Cpx, where weak Ti negative anomalies and no Sr-Zr-Hf anomalies occur. But KdAmp/Cpx of
each element in both samples is close to its equilibrium values (Table 2). The different distribution patterns of Zr, Hf and Ti in coexisting Amp and Cpx from samples MC36 and MC53 can therefore be ascribed to equilibrated redistribution of each element between the two phases at mantle depths (Vannucci et al., 1995).
Coltorti et al. (2007) have compiled major and trace element compositions of Amp in mantle xenoliths from many localities of various tectonic backgrounds; they suggested that Zr/Nb ratio plotted against Ti/Nb ratios and Ti/Zr in Amp could trace the origin of Amp (Fig. 9a and b; Coltorti et al., 2007). Considering Amp in both
samples plus a larger dataset from Touron (2005), we propose that the majority of Amp in peridotites from the FMC may crystallize from suprasubduction fluids or from two end-member mixed fluids (supersubduction and intraplate; Fig. 9a and b; Coltorti et al., 2007).
6.2 Large inter-mineral and inter-sample Li isotopic variation
Since the volcano erupted in the strombolian mode, peridotite xenoliths from Mont Coupet should have been transported to the earth surface quite fast and cooled to the ambient temperatures in a very short period. Thus, the original information of Li isotopic systems at mantle depths should be preserved in xenoliths.
Li concentrations in minerals in Mont Coupet samples range from 0.4 to 2.8 ppm, in the range of normal mantle (Fig. 10), and the Li partitioning among different coexisting phases are very close to equilibrium (Fig. 10; Table 3). Meanwhile, in the measured profiles, Li concentrations display almost no variation across most of analyzed grains of Ol, Opx, Cpx and Amp (Supplementary figure 1). In some grains (mainly Cpx), small decreases towards rims (<1 ppm) are limited within narrow zones close to grain rims; in fact, they are just a little larger than analytical errors.
In contrast with Li inter-mineral equilibrated partitioning, Li isotopic compositions show larger variation among different phases (Table 3).The averaged δ7Li values of
different mineral phases in most of Mont Coupet samples follow the common sequence: Ol>Opx>Cpx, except for sample MC53, where Li isotopic composition of Cpx is higher than those of coexisting Ol and Opx (Table 3). The averaged δ7Li
values of Ol range from +0.5 to +7.7 ‰, close to the estimated isotopic compositions of the upper mantle (+2 to +5 ‰); some Opx and Cpx in some samples have negative averaged δ7Li values (Table 3).
Given the large difference of diffusive rates between 6Li and 7Li, with a diffusion
coefficient ratio D7/D6=(m6/m7)β=1.0424 (m6 and m7 are the masses of 6Li and 7Li,
respectively; exponent β=0.27 according to Richter et al. (2014)), the Li isotopic composition will be altered during Li exchange by diffusion (e.g., Lundstrom et al., 2005; Wagner and Deloule, 2007; Gu et al., 2016). During diffusion, the minerals as the receptors first become enriched in 6Li owing to its faster diffusion rate, and the
‘trough’ in isotopic compositions (Parkinson et al., 2007). Inversely, δ7Li values of
the donors (percolating melts or fluids), which have lost Li, increase gradually. In receptor minerals, the ‘trough’ propagates into the interiors of grains until a new equilibrium is achieved, or the system cools below the closure temperature, freezing the disequilibrium state. Accordingly, the disequilibrated Li diffusive uptake can decrease the Li isotopic compositions of host minerals in certain degrees. In xenoliths from Mont Coupet, the lowest Cpx δ7Li value was measured in sample MC38, which
means that Cpx in this sample should contain much more Li than other samples if the light Li isotopic composition is interpreted as the result of dis-equilibrated kinetic diffusion. However, in contrary to this assertion, Li concentration of Cpx in sample MC38 is the lowest among all in Mont Coupet (Fig. 11a). And, there are no negative co-variations between Cpx δ7Li values and the Li concentrations when taking all the
Mont Coupet samples into consideration (Fig. 11a). Since Li partitioning is at equilibrium among minerals and no signatures of Li diffusive addition into minerals have been observed (Fig. 10 and Supplementary figure 1), the signatures of Li isotopic compositions imply that the light isotopic compositions of Opx and Cpx in some samples have been modified by an exotic small-volume melt with a light isotopic composition, and low or moderate Li content. In light of small or no core-rim concentration variations, Opx and Cpx grains in Mont Coupet samples may have achieved Li isotopic equilibrium with the percolating melt in a short time. Due to the lower diffusive rate of Li in Ol than Cpx, and higher Li content of Ol, Li isotopic compositions of Ol cannot have been largely affected.
In fact, Li isotopic compositions in Cpx from Mont Coupet xenoliths display a gradual increase from sample MC38 to MC53 (Fig. 11b). Here, an interpretation similar to the chromatographic effect described for REE distribution could be invoked to explain the Cpx Li isotopic composition of the different samples. Once the melt has percolated into the lithospheric mantle beneath Mont Coupet, harzburgites represented by MC38 were first passed through and the Li isotopic compositions in their Cpx (also Opx) grains were assimilated in a short time whereas the Li isotopic compositions of Ol were influenced in a smaller degree. As the melt left and continued advancing towards other parts of the mantle, δ7Li values of Cpx in sample
MC38 was no longer changed by the percolating melt. With the melt moving among different parts of the mantle, more 6Li than 7Li diffused into ambient peridotites along
the melt passage, and its light Li isotopic composition was gradually diluted. Thus, the samples far from the melt path could not record negative δ7Li signatures.
Considering the high diffusive rate of Li at high temperatures, in a single sample the inter-mineral Li isotopic disequilibrium is a transient state. The preservation of inter-mineral and inter-sample large Li isotopic fractionation currently observed in Mont Coupet implies that the percolation of the melt should have occurred shortly prior to the entrainment of the peridotite xenoliths by the host magmas, and/or through focused channels.
The negative δ7Li values, measured recently in peridotite xenoliths and
mantle-derived magmas by more and more studies (e.g., Li et al., 2012; Tang et al., 2012, 2014; Ackerman et al., 2013; Adelfadil et al., 2014; Tian et al., 2015; Gu et al., 2016), have been originally related to the recycled materials transported by subducted slabs into depths, forming a low-δ7Li reservoir in the deep mantle (Zack et al., 2003).
Here, melts/fluids stemming from the subducted materials during Variscan orogeny may have metasomatized the lithospheric mantle beneath the FMC, and brought the light Li isotopic compositions (Gu et al., 2016).
6.3 Water content variation controlled by partial melting and metasomatism 6.3.1 Preservation of original water contents in minerals
Due to the high diffusivity of hydrogen at magmatic temperatures (e.g., Mackwell and Kohstedt, 1990; Hercule and Ingrin, 1999; Stalder and Skogby, 2003; Demouchy and Mackwell, 2006) and water solubility in NAMs decreasing with diminishing pressures (e.g., Kohlstedt et al., 1996; Fé 19 and Bolfan-Casanova, 2012), hydrogen incorporated in lattices of NAMs may be lost during xenolith ascent to the surface (Demouchy et al., 2006; Peslier et al., 2006). Although experimentally determined H diffusivity does not vary largely in Ol and pyroxenes (e.g., Hercule and Ingrin, 1999; Stalder and Skogby, 2003; Demouchy and Mackwell, 2006; Ingrin and Blanchard, 2006), profiles formed by H diffusive loss have been observed in xenolithic Ol but not in coexisting pyroxenes (e.g., Peslier and Luhr, 2006) except in Opx in one recent specific case (Tian et al., 2016). In several recent studies, a certain amount of
structural OH have been detected in Ol grains in peridotite xenoliths transported by alkali basalts and have been considered to represent the original amount prior to entrapment by magmas (Demouchy et al., 2015; Denis et al., 2015). There is no reason to believe that the host magmas of xenoliths from Mont Coupet have risen much slower than these alkali basalts and that main minerals have lost water through decompression-induced outward diffusion.
The homogeneous intragranular water distribution in Opx and Cpx grains from Mont Coupet xenoliths has been testified by the absence of variation in spectra collected from grain cores to rims (e.g., Fig. 7b). And the concentration ratios between Opx and Cpx in most samples from Mont Coupet, except two Amp-bearing samples MC36 and MC53, fall in the range restricted by mantle xenoliths from worldwide localities (Fig. 12a). They indicate that Opx and Cpx from Mont Coupet xenoliths should have preserved their initial water contents.
Ol in xenoliths from Mont Coupet does not show evidence of water loss during ascent to the surface. On the one hand, the FTIR profile analyses reveal no variation in spectra across Ol grains. Especially, for the profile in one grain from sample MC34, both the bandwidth and the peak height of the band at 3225 cm-1 do notshow any
obvious changes (Fig. 7a). This band has been assigned to the mechanism of two H substituting Mg2+, by which hydrogen incorporated into Ol lattices (Balan et al.,
2011). It has been experimentally shown that this type of defect is one of fastest among the four mechanisms of H incorporation into Ol (Padrón-Navarta et al., 2014). If hydrogen loss would have occurred in Ol, it can be expected that the band would display variation in spectra collected from core to rim, or have totally disappeared, which is in contradiction with the observations in Fig. 7a. On the other hand, water contents of Ol in Mont Coupet xenoliths have a roughly positive co-variation with those of co-existing Cpx (Fig. 12b).
Ol in xenoliths from Mont Coupet contain rather less hydrogen compared with Ol in cratonic peridotite xenoliths (e.g., Grant et al., 2007; Peslier et al., 2008; Doucet et al., 2014), but it is consistent with observations from other off-craton mantle xenoliths (e.g., Grant et al., 2007; Peslier, 2010) and especially compared to off-craton xenoliths also from the FMC (Denis et al., 2015). It is in agreement with the general
observation that Ol in the off-craton lithospheric mantle might indeed have lower water content than Ol from cratonic lithospheric mantle.
6.3.2 Water content variation controlled by different processes
Among xenoliths from Mont Coupet, Opx and Cpx in sample MC38 contain the least water compared with corresponding minerals in other samples, and Ol infrared spectra from sample MC38 do not display any OH-vibration bands at wavenumbers between 3700-3000 cm-1 (Fig. 6a), indicating that water content in Ol of this sample
is lower than the detect limit of FTIR. According to major element compositions and Cpx HREE concentrations, sample MC38 had been depleted strongly by partial melting, with calculated partial melting degree of 16%, the highest among samples from Mont Coupet. Considering H as an incompatible element, the high-degree of partial melting of sample MC38 is coherent with a lower water content compared with other samples (Fig. 13a and b). Although LREE enrichment and HFSE negative anomalies in Cpx of sample MC38 points to a metasomatism subsequent to partial melting, the result of water content suggests that this metasomatism has at least not added water to the sample. This metasomatism is probably responsible for the alteration of the nature of main H defects in Opx and Cpx since their spectra are markedly different from those in other samples from Mont Coupet (Fig. 6c and d). The band position shift is intrinsically related to the change of OH-stretching modes, corresponding to the change of P-T conditions or chemical compositions of host minerals (e.g., Yang et al., 2012; Ingrin et al., 2013), which may have been induced by the percolation of the metasomatic melt. Furthermore, sample MC38 also has the highest calculated Spl Fe3+/ΣFe value (Fig. 13c), consistent with its low water content.
This consistency has been observed in natural samples (e.g., Peslier et al., 2002) and an experiment by Bromiley et al. (2004). Everything is pointing toward a very low water activity of the fluid/melt involved in this particular metasomatism event.
Sample MC34 severely deviates from the roughly negative co-variation between Cpx/Opx water contents and Fo contents in Ol for samples from Mont Coupet (Fig. 13a and b). The metasomatism, characterized by LREE enrichment in Cpx of sample MC34, might have added some water to sample MC34. As mentioned above, sample MC38 display strongly enriched characteristics of trace element compositions in its
Cpx, but its water contents in minerals are the lowest among all the samples from Mont Coupet. The different effects of metasomatism on water contents point out that different percolating agents may have carried out the metasomatism in samples MC34 and MC38.
The whole rock water contents in samples MC43 and MC49, with values of 50 and 88 ppm, fall in the range of water content in depleted MORB source mantle (50-200 ppm). Their water contents in minerals may just be involved in partial melting but not major postdating metasomatism (Fig. 13a, b and d).
For the two Amp-bearing samples MC36 and MC53, water contents in Ol, Opx and Cpx are not remarkably higher than those in equivalent minerals from other anhydrous samples from Mont Coupet (Table 5; Fig. 12a and b). In fact, the highest water contents of Cpx and Opx are observed in anhydrous sample MC34 (Table 5). The same observations have been reported in previous studies (Yang et al., 2008; Schmädicke et al., 2013; Bonadiman et al., 2014; Denis et al., 2015). Bonadiman et al. (2014) have calculated a very low water activity in Amp-bearing mantle peridotites, accompanied by low oxygen fugacity. They proposed that Amp could be regarded as a repository of water and have prevented circulation of water in the local environment composed of NAMs. From another viewpoint, the generation of Amp consumes water in the system and largely decreases the water activity in mantle peridotites. Thus, water contents in primary NAMs is not remarkably increased. In addition, as discussed in section 6.1, the formation of Amp may have occurred in another metasomatic event prior to the metasomatism characterized by LREE enrichment and HFSE negative anomalies in Cpx. The imprints from the foregoing modal metasomatism might have been modified by the lately percolating melts/fluids. However, it is noteworthy that these two Amp-bearing samples have higher /
ratios than the / ratio range restricted by mantle xenoliths from worldwide localities (Table 5; Fig. 12a).
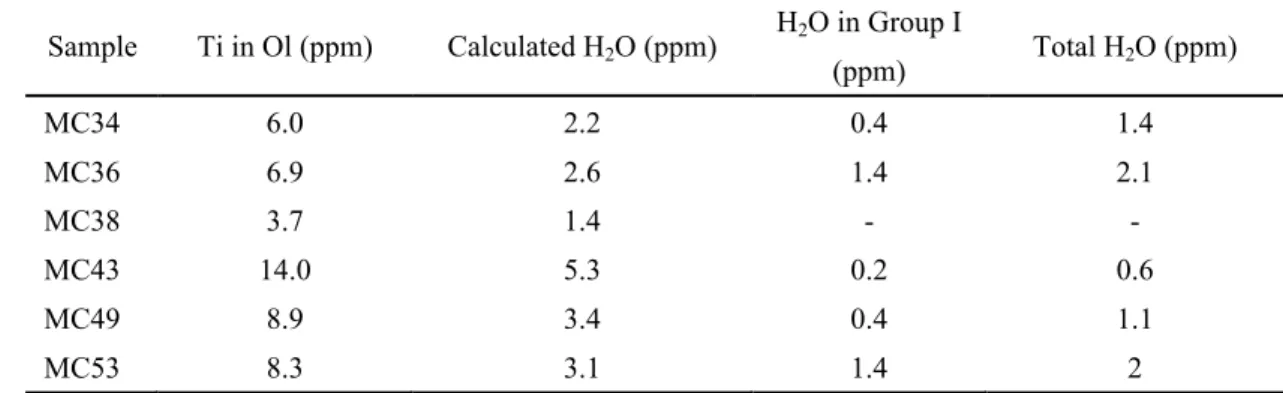
6.3.3 Relationship between water contents and Ti concentrations in Ol
Although H can incorporate into Ol lattice through occupying Mg vacancies charge-balanced by trivalent ions (e.g., Al3+ Cr3+, Fe3+), its corresponding bands are
only observed in Ol infrared spectra of sample MC34 but not in those of other
CH2O Cpx CH2O Opx CH2O Cpx CH2O Opx
samples. Thus, we will not discuss the relationship between concentrations of trivalent ions and concentrations of H responsible for bands at between 3400 and 3300 cm-1.
The maximum concentration of H, entering Ol accompanied by Ti, is calculated from Ti concentrations in Ol according to the expression Ti4+ + 2H+=Mg2+ + Si4+,
supposing that all Ti contributes to the Ti-2H defect. The calculated results are expressed in ppm wt. H2O ranging from 1.39 ppm in sample MC38 to 5.25 ppm in
sample MC43, much higher than the total Ol water contents measured in corresponding samples, let alone the content of water associated with bands at 3572 and 3525 cm-1 (Table 6; Schämdicke et al., 2013). It therefore suggests that Ti content
was not a limiting factor in the incorporation of water in the mantle beneath Mont Coupet.
Conclusion
Different geochemical indicators in peridotite xenoliths from Mont Coupet uniformly illustrate that the SCLM beneath the FMC has undergone multi-stage metasomatism by melts/fluids of different origins. The H and Li homogeneous distributions at the mineral scale in each sample point out that the host magmas have erupted fast enough to preserve the original information from Li and H. Li concentrations and isotopic compositions, and water contents in minerals have been modified in different degrees by metasomatism at mantle depths.
LREE enrichment and negative HFSE negative anomalies in Cpx point out a metasomatic process by carbonatitic or subduction-related melts/fluids. Prior to this event, another metasomatic event accounts for the generation of Amp in two xenoliths, because the trace element distribution in Amp shows characteristics of LREE depletion and equilibrium with co-existing Cpx.
Minerals in peridotite xenoliths from Mont Coupet have Li concentrations similar to the normal mantle; but Li isotopic compositions display significant inter-mineral fractionation and large variations among different samples, which should be a result of percolation of a small-volume melt with a low δ7Li value, and low to moderate Li
concentration, originally related to recycled materials. This metasomatic process should occur shortly before the xenolith entrainment by the host magmas.
Minerals in Mont Coupet xenoliths, including Ol, have apparently retained their original water contents. The distinct OH behaviors in individual samples with marked Cpx LREE enrichment suggest that agents of different origins have conducted the metasomatic processes characterized by variations of trace element compositions in Cpx. Ol, Opx and Cpx in two Amp-bearing samples show no remarkable difference in water content than other xenoliths. This point may be interpreted as the generation of Amp, as a repository of water, has significantly lowered the water activity in the whole system, so that the modal metasomatism have not imprinted the water content in NAMs with high values, or the effect of this modal metasomatism has perhaps been erased by some late metasomatism (e.g., the metasomatism characterized by LREE enrichment in Cpx).
Acknowledgements
This research was supported by the INSU SYSTER program and the State Scholarship Fund of China. We thank Michel FIALIN for access to EMP analysis, Marie-Christine BOIRON and Chantal PEIFFERT for help in analyzing trace elements using LA-ICPMS. GU X.Y. also appreciates Marc CHAUSSIDON, Andrey GURENKO for direction in using SIMS at CRPG. Special gratitude is expressed to Nordine BOUDEN for assistance in guaranteeing the operation of IMS 1270 when GU X.Y. used it. Isabelle De Waele is thanked for her patient direction and aide for the FTIR-microscope to analyze the water content in Université Lille 1.
References
Abdelfadil, K. M., Romer, R. L., Glodny, J., 2014. Mantle wedge metasomatism revealed by Li isotopes in orogenic lamprophyres. Lithos, 196, 14-26.
Ackerman, L., ŠpaČek, P., Magna, T., Ulrych, J., Svojtka, M., Hegner, E., Balogh, K., 2013. Alkaline and carbonate-rich melt metasomatism and melting of subcontinental lithospheric mantle: evidence from mantle xenoliths, NE Bavaria, Bohemian Massif. Journal of Petrology, egt059.
Arai, S., 1994. Characterization of spinel peridotites by olivine-spinel compositional relationships: review and interpretation. Chemical geology, 113(3), 191-204.
Aulbach, S., Rudnick, R. L., 2009. Origins of non-equilibrium lithium isotopic fractionation in xenolithic peridotite minerals: examples from Tanzania. Chemical Geology, 258(1), 17-27.
Balan, E., Ingrin, J., Delattre, S., Kovács, I., Blanchard, M., 2011. Theoretical infrared spectrum of OH-defects in forsterite. European Journal of Mineralogy, 23(3), 285-292.
Baptiste, V., Tommasi, A., Demouchy, S., 2012. Deformation and hydration of the lithospheric mantle beneath the Kaapvaal craton, South Africa. Lithos, 149, 31-50.
Beck, P., Barrat, J. A., Chaussidon, M., Gillet, P., Bohn, M., 2004. Li isotopic variations in single pyroxenes from the Northwest Africa 480 shergottite (NWA 480): a record of degassing of Martian magmas? Geochimica et Cosmochimica Acta, 68(13), 2925-2933.
Bell, D. R., Rossman, G. R., 1992. Water in Earth's mantle: the role of nominally anhydrous minerals. Science, 255(5050), 1391.
Bell, D. R., Ihinger, P. D., Rossman, G. R., 1995. Quantitative analysis of trace OH in garnet and pyroxenes. American Mineralogist, 80(5-6), 465-474.
Bell, D. R., Rossman, G. R., Maldener, J., Endisch, D., Rauch, F., 2003. Hydroxide in olivine: a quantitative determination of the absolute amount and calibration of the IR spectrum. Journal of Geophysical Research: Solid Earth, 108(B2).
Berry, A. J., Hermann, J., O'Neill, H. S., Foran, G. J., 2005. Fingerprinting the water site in mantle olivine. Geology, 33(11), 869-872.
Berry, A. J., O'Neill, H. S. C., Hermann, J., Scott, D. R., 2007. The infrared signature of water associated with trivalent cations in olivine. Earth and Planetary Science Letters, 261(1), 134-142. Brenan, J. M., Neroda, E., Lundstrom, C. C., Shaw, H. F., Ryerson, F. J., Phinney, D. L., 1998a. Behaviour of boron, beryllium, and lithium during melting and crystallization: constraints from mineral-melt partitioning experiments. Geochimica et Cosmochimica Acta, 62(12), 2129-2141. Bonadiman, C., Nazzareni, S., Coltorti, M., Comodi, P., Giuli, G., Faccini, B., 2014. Crystal chemistry of amphiboles: implications for oxygen fugacity and water activity in lithospheric mantle beneath victoria land, antarctica. Contributions to Mineralogy and Petrology, 167(3), 10291.
Bromiley, G. D., Keppler, H., McCammon, C., Bromiley, F. A., Jacobsen, S. D., 2004. Hydrogen solubility and speciation in natural, gem-quality chromian diopside. American Mineralogist, 89(7), 941-949.
Chazot, G., Menzies, M. A., Harte, B., 1996. Determination of partition coefficients between apatite, clinopyroxene, amphibole, and melt in natural spinel lherzolites from Yemen: implications for wet melting of the lithospheric mantle. Geochimica et Cosmochimica Acta, 60(3), 423-437.
Coltorti, M., Bonadiman, C., Hinton, R. W., Siena, F., Upton, B. G. J., 1999. Carbonatite metasomatism of the oceanic upper mantle: evidence from clinopyroxenes and glasses in ultramafic xenoliths of Grande Comore, Indian Ocean. Journal of Petrology, 40(1), 133-165.
Coltorti, M., Bonadiman, C., Faccini, B., Grégoire, M., O'Reilly, S. Y., Powell, W., 2007. Amphiboles from suprasubduction and intraplate lithospheric mantle. Lithos, 99(1), 68-84.
Decitre, S., Deloule, E., Reisberg, L., James, R., Agrinier, P., Mével, C., 2002. Behavior of Li and its isotopes during serpentinization of oceanic peridotites. Geochemistry, Geophysics, Geosystems, 3(1), 1-20.
De Hoog, J. C., Gall, L., Cornell, D. H., 2010. Trace-element geochemistry of mantle olivine and application to mantle petrogenesis and geothermobarometry. Chemical Geology, 270(1), 196-215. Deloule, E., Albarede, F., Sheppard, S. M., 1991. Hydrogen isotope heterogeneities in the mantle from ion probe analysis of amphiboles from ultramafic rocks. Earth and Planetary Science Letters, 105(4), 543-553.
Deloule, E., Chaussidon, M., Allé, P., 1992. Instrumental limitations for isotope measurements with a Caméca® ims-3f ion microprobe: Example of H, B, S and Sr. Chemical Geology: Isotope Geoscience section, 101(1), 187-192.
Demouchy, S., Jacobsen, S. D., Gaillard, F., Stern, C. R., 2006. Rapid magma ascent recorded by water diffusion profiles in mantle olivine. Geology,34(6), 429-432.
Demouchy, S., Mackwell, S., 2006. Mechanisms of hydrogen incorporation and diffusion in iron-bearing olivine. Physics and Chemistry of Minerals, 33(5), 347-355.
Demouchy, S., Ishikawa, A., Tommasi, A., Alard, O., Keshav, S., 2015. Characterization of hydration in the mantle lithosphere: Peridotite xenoliths from the Ontong Java Plateau as an example. Lithos, 212, 189-201.
Demouchy, S., Bolfan-Casanova, N., 2016. Distribution and transport of hydrogen in the lithospheric mantle: A review. Lithos, 240, 402-425.
Denis, C. M., Demouchy, S., Shaw, C. S., 2013. Evidence of dehydration in peridotites from Eifel Volcanic Field and estimates of the rate of magma ascent. Journal of Volcanology and Geothermal Research, 258, 85-99.
Denis, C. M., Alard, O., Demouchy, S., 2015. Water content and hydrogen behaviour during metasomatism in the uppermost mantle beneath Ray Pic volcano (Massif Central, France). Lithos, 236, 256-274.
Doucet, L. S., Peslier, A. H., Ionov, D. A., Brandon, A. D., Golovin, A. V., Goncharov, A. G., Ashchepkov, I. V., 2014. High water contents in the Siberian cratonic mantle linked to metasomatism: An FTIR study of Udachnaya peridotite xenoliths. Geochimica et Cosmochimica Acta, 137, 159-187. Downes, H., Dupuy, C., 1987. Textural, isotopic and REE variations in spinel peridotite xenoliths, Massif Central, France. Earth and Planetary Science Letters, 82(1), 121-135.
Downes, H., Reichow, M. K., Mason, P. R. D., Beard, A. D., Thirlwall, M. F., 2003. Mantle domains in the lithosphere beneath the French Massif Central: trace element and isotopic evidence from mantle clinopyroxenes. Chemical Geology, 200(1), 71-87.
Downes, H., Macdonald, R. A. Y., Upton, B. G., Cox, K. G., Bodinier, J. L., Mason, P. R., James, D., Hill, P. G., Hearn, B. C., 2004. Ultramafic xenoliths from the Bearpaw Mountains, Montana, USA: Evidence for multiple metasomatic events in the lithospheric mantle beneath the Wyoming craton. Journal of Petrology, 45(8), 1631-1662.
Ferot, A., Bolfan-Casanova, N., 2012. Water storage capacity in olivine and pyroxene to 14GPa: Implications for the water content of the Earth's upper mantle and nature of seismic discontinuities. Earth and Planetary Science Letters, 349, 218-230.
Fichtner, A., Villaseñor, A., 2015. Crust and upper mantle of the western Mediterranean–Constraints from full-waveform inversion. Earth and Planetary Science Letters, 428, 52-62.
statistics and analytical precision. Mineralogical Magazine, 64(1), 59-83.
Flesch, G. D., Anderson, A. R., Svec, H. J., 1973. A secondary isotopic standard for 6 Li/7 Li determinations. International Journal of Mass Spectrometry and Ion Physics, 12(3), 265-272.
Foley, S. F., Prelevic, D., Rehfeldt, T., Jacob, D. E., 2013. Minor and trace elements in olivines as probes into early igneous and mantle melting processes. Earth and Planetary Science Letters, 363, 181-191.
France, L., Chazot, G., Kornprobst, J., Dallai, L., Vannucci, R., Grégoire, M., Bertrand, H., Boivin, P., 2015. Mantle refertilization and magmatism in old orogenic regions: the role of late-orogenic pyroxenites. Lithos, 232, 49-75.
Frey, F. A., Green, D. H., 1974. The mineralogy, geochemistry and origin of Iherzolite inclusions in Victorian basanites. Geochimica et Cosmochimica Acta, 38(7), 1023-1059.
Frey, F. A., Prinz, M., 1978. Ultramafic inclusions from San Carlos, Arizona: petrologic and geochemical data bearing on their petrogenesis. Earth and Planetary Science Letters, 38(1), 129-176. Goes, S., Spakman, W., Bijwaard, H., 1999. A lower mantle source for central European volcanism. Science, 286(5446), 1928-1931.
Granet, M., Wilson, M., Achauer, U., 1995. Imaging a mantle plume beneath the French Massif Central. Earth and Planetary Science Letters, 136(3), 281-296.
Grant, K., Ingrin, J., Lorand, J. P., Dumas, P., 2007. Water partitioning between mantle minerals from peridotite xenoliths. Contributions to Mineralogy and Petrology, 154(1), 15-34.
Grégoire, M., Langlade, J. A., Delpech, G., Dantas, C., Ceuleneer, G., 2009. Nature and evolution of the lithospheric mantle beneath the passive margin of East Oman: evidence from mantle xenoliths sampled by Cenozoic alkaline lavas. Lithos, 112(3), 203-216.
Gu, X., Deloule, E., France, L., Ingrin, J., 2016. Multi-stage metasomatism revealed by trace element and Li isotope distributions in minerals of peridotite xenoliths from Allègre volcano (French Massif Central). Lithos, 264, 158-174.
Hao, Y. T., Xia, Q. K., Jia, Z. B., Zhao, Q. C., Li, P., Feng, M., Liu, S. C., 2016. Regional
heterogeneity in the water content of the Cenozoic lithospheric mantle of Eastern China. Journal of Geophysical Research: Solid Earth, 121, 517-537.
Hellebrand, E., Snow, J. E., Dick, H. J., Hofmann, A. W., 2001. Coupled major and trace elements as indicators of the extent of melting in mid-ocean-ridge peridotites. Nature, 410(6829), 677-681.
Hercule, S., Ingrin, J., 1999. Hydrogen in diopside: Diffusion, kinetics of extraction-incorporation, and solubility. American Mineralogist, 84(10), 1577-1587.
Hirschmann, M. M., 2006. Water, melting, and the deep Earth H2O cycle. Annu. Rev. Earth Planet.
Sci., 34, 629-653.
Ingrin, J., Skogby, H., 2000. Hydrogen in nominally anhydrous upper-mantle minerals concentration levels and implications. European Journal of Mineralogy, 12(3), 543-570.
Ingrin, J., Blanchard, M., 2006. Diffusion of hydrogen in minerals. Reviews in mineralogy and geochemistry, 62(1), 291-320.
Ingrin, J., Liu, J., Depecker, C., Kohn, S. C., Balan, E., Grant, K. J., 2013. Low-temperature evolution of OH bands in synthetic forsterite, implication for the nature of H defects at high pressure. Physics and Chemistry of Minerals, 40(6), 499-510.
Ionov, D. A., Bodinier, J. L., Mukasa, S. B., Zanetti, A., 2002. Mechanisms and sources of mantle metasomatism: major and trace element compositions of peridotite xenoliths from Spitsbergen in the context of numerical modelling. Journal of Petrology, 43(12), 2219-2259.
Kohlstedt, D. L., Keppler, H., Rubie, D. C., 1996. Solubility of water in the α, β and γ phases of (Mg, Fe)2 SiO4. Contributions to Mineralogy and Petrology, 123(4), 345-357.