HAL Id: hal-00297386
https://hal.archives-ouvertes.fr/hal-00297386
Submitted on 20 Feb 2006
HAL is a multi-disciplinary open access
archive for the deposit and dissemination of
sci-entific research documents, whether they are
pub-lished or not. The documents may come from
teaching and research institutions in France or
abroad, or from public or private research centers.
L’archive ouverte pluridisciplinaire HAL, est
destinée au dépôt et à la diffusion de documents
scientifiques de niveau recherche, publiés ou non,
émanant des établissements d’enseignement et de
recherche français ou étrangers, des laboratoires
publics ou privés.
Intense storms in the Mediterranean: a first description
from the ERA-40 perspective
A. Genovés, J. Campins, A. Jansü
To cite this version:
A. Genovés, J. Campins, A. Jansü. Intense storms in the Mediterranean: a first description from
the ERA-40 perspective. Advances in Geosciences, European Geosciences Union, 2006, 7, pp.163-168.
�hal-00297386�
SRef-ID: 1680-7359/adgeo/2006-7-163 European Geosciences Union
© 2006 Author(s). This work is licensed under a Creative Commons License.
Advances in
Geosciences
Intense storms in the Mediterranean: a first description from the
ERA-40 perspective
A. Genov´es, J. Campins, and A. Jans`a
CMT en Illes Balears, INM, Spain
Received: 11 November 2005 – Revised: 25 January 2006 – Accepted: 30 January 2006 – Published: 20 February 2006
Abstract. The study of the Mediterranean cyclones from a
climatological point of view has been one of the objectives of the first phase of WMO WWRP MEDEX (MEDiterranean EXperiment) project. It has been revealing itself like a good procedure for extracting conclusions about their characteris-tics and behaviour. The implementation on ECMWF ERA-40 reanalysis of the method for detecting and tracking the cyclones developed at the Centro Meteorol´ogico Territorial (CMT) in Illes Balears of the Instituto Nacional de Meteo-rolog´ıa (INM, Spain) has allowed the selection of the most intense storms occurred for the last 45 years. This selection has been based on the value of the cyclones’ circulation. The areas of maximum intensification for those cyclones have been obtained and the existence of preferential zones of in-tensification has been verified. Finally a first sight of those cases has allowed to initiate the check up of the ability of the ERA-40 re-analyses for reproducing these intense Mediter-ranean storms.
1 Introduction
One of the objectives of the first phase of the WWRP WMO MEDEX project (medex.inm.uib.es) has consisted in the study of the Mediterranean cyclones from a climatological point of view. In order to reach this goal, a procedure for objectively detecting and tracking the cyclones was devel-oped at the CMT of the Balearic Islands of the INM of Spain. The first version of the algorithm was applied on mean sea level pressure (mslp) operational objective analyses of
HIRLAM INM-0.5◦. The details of the procedure itself and
the statistical results, referred to the Western Mediterranean basin, can be found in Picornell et al. (2001). Some changes were then introduced in the algorithm for improving the de-tection and characterization of the cyclones, by one hand, and for extending the domain of application to the Eastern Mediterranean, by the other (Gil et al., 2003a). Afterwards, the extension of the procedure from msl to higher levels in the troposphere was considered and repeatedly applied, both Correspondence to: A. Genov´es
on HIRLAM-0.5◦ (Campins et al., 2006) and on ECMWF
operational analyses (not yet published) in order to dispose of a more complete 3-D description of the cyclones. The resulting databases of cyclones are different in which the re-spective areas and the periods of time concern. The Western database (based on HIRLAM analyses) extends from June 1995 until May 2004. The entire Mediterranean one is re-ferred to the June 1998–May 2004 period. Both two of them
were obtained on a 0.5◦ lat/lon grid (∼50 km, at the
lati-tude of the Mediterranean) and they have been included in the MEDEX web (medex.inm.uib.es).
However the differences about the areas and time periods, the repeated application of the same algorithm on two dif-ferent analysis systems can allow the intercomparison of the statistical results (in the common area and in the common period of time) and, hence, to test out the respective abilities of the analyses for describing the characteristics of the cy-clones. At the moment, only a first approach to this compar-ison has been realised by Gil et al. (2003b) and only referred to msl cyclones. This point would acquire more relevance by considering that the above mentioned studies cover no more than nine years in time, but also that their results are clearly dependent of the changes introduced along the time in both operational systems.
The implementation of the algorithm on ECMWF ERA40 re-analysis system (Uppala et al., 2004) was the next step for obtaining a “true” climatology of cyclones for the Mediter-ranean as it was specified in Gil et al. (2003a) and Gil et al. (2002). The ERA40 re-analysis constitutes a large series of analyses and it allows to exclude the biases often introduced with changes to the model or the assimilation system in an operational system (Bengtsson et al., 2004).
When the algorithm’s implementation was planned on ERA40 re-analysis, one of the reticences that were argued in spite of it was the resolution of the analyses for the cor-rect representation of the cyclones that occurred in this area of the world. Some of the handicaps that must be overcome for objectively monitoring the cyclones in the Mediterranean are related to the size and the spectrum of scales that such kind of systems present. Generally speaking, due to the pres-ence of the surrounding orography (actually the land areas),
164 A. Genov´es et al.: Intense storms in the Mediterranean
Table 1. Most intense cases of cyclones obtained from the
clima-tology based on ERA-40 analyses
Episode Maximum Max. Circ. development (GCU) 11–13 December 1967 12 at 06:00 UTC 16.53 10–12 January 1987 11 at 06:00 UTC 14.74 20–27 January 1981 21 at 12:00 UTC 13.77 13–16 March 1962 14 at 18:00 UTC 13.41 1–2 December 1969 01 at 18:00 UTC 13.11 27 February - 2 March 1958 01 at 00:00 UTC 13.05 10–12 November 2001 11 at 06:00 UTC 12.83 21–22 December 1979 22 at 00:00 UTC 12.12
they are smaller than the big cyclones in other maritime baro-clinic areas in the world, like those in the Atlantic and the Pacific. Moreover, they usually have less than 48 h life-cycles and tracks not greater than 900 km, so their charac-teristics and monitoring are easily masked or not finely de-scribed when a large scale tracking algorithm is considered. The ERA-40 system is based on a 3-D-Var data assimilation and the use of T159 (∼125 km) horizontal resolution (Uppala et al., 2004), and the tracking algorithm has been applied on
a 1.125◦lat/lon grid.
The initial purpose of this work consisted in testing the ability of the ERA40 assimilation system and the tracking procedure itself to correctly reproduce a selection of cases related to the presence of high impact weather. By doing that the MEDEX project would have a reference of case studies from a homogeneous system in order to compare the results obtained from some other numerical models. At the mo-ment, only a first sight about the representation of some ob-served features for the most intense storms has been studied. A deeper diagnosis of these and some other (sub-synoptic) cases is left for some future work.
Thus, this paper is organised as follows. First of all, the most intense storms are selected from a criterion based on the value of the circulation for the msl cyclones. A brief sight about the zones of maximum intensification for these storms follows in order to seek the preferential areas of develop-ment. Afterwards some references about the occurrence of these cases have been looked for in old literature in order to verify the description that ERA40 makes of these cases. The first conclusions and further remarks finish the study.
2 Selection of cases
When the procedure was designed the circulation of the cy-clone was chosen as a measure of its intensity each time it would be detected. The reasons for using this parameter in front of any other (like the mslp or the vorticity) as a measure of the cyclone strength were detailed and referenced in Picor-nell et al. (2001) and Campins et al. (2006), and coincident with those argued by Sinclair (1997). The circulation com-bines local values of the vorticity and the size of the cyclone,
and hence, it can be considered an appropriate parameter for characterising the cyclones’ intensity.
At the algorithm, the geostrophic circulation of the cy-clones is assessed by means of the expression
C = Z
A
ζg·dA (1)
being ζg the geostrophic vorticity and A the domain of the
cyclone. The reader is referred to Picornell et al. (2001) and Campins et al. (2006) for the details about the definition of both the domain and the circulation of the cyclone from the algorithm.
The circulation is computed every time and at all levels for which the cyclonic centre is detected. By this way, the geostrophic circulation of the msl cyclone is one of the pa-rameters that characterises the cyclone along its life cycle and allows its monitoring in terms of its intensity. The se-lection of the most intense cases from the database of cy-clones is then reduced to the selection of cases that present the greatest circulation. Once the moment of maximum cir-culation has been detected it is immediate to reproduce the life of the cyclone. The geostrophic circulation values are ∼
107m2s−1order of magnitude. Hereafter, it will be expressed
in Geostrophic Circulation Units, being 1 GCU=107m2s−1.
The maximum of the circulation’s probability density function (not shown) is located around 3 GCU. The 90% of the cyclones have values of circulation below 6 GCU and 7 GCU, respectively, in the western and eastern Mediter-ranean, when only the moments of maximum development of the cyclones are considered. For this study and, in a first stage, the cases with circulation greater than 13 GCU at msl at any moment of its life-cycle have been selected. This cir-culation value corresponds to the 0.03% of the distribution and only 6 cyclonic events overcome this threshold. These numbers indicates the relatively extreme events considered. Two additional events, each of them showing a circulation greater than 12 GCU (that corresponds to the 0.08% of the distribution), have also been included in this selection due to the reasons below detailed. The final selection of cases is shown in Table 1. In the table, the moment in which the pressure reaches its minimum value for each cyclone and the maximum value of its circulation are also included.
The Table 1 shows that most of the cyclones occurred in winter or late autumn and only two of them have been de-tected in March. Two of these events, the 1958 and 1969 cases, have not yet been related to high impact weather phe-nomena (no documentation has been found at the moment of writing this paper). The other six correspond to extreme cyclogenesis cases that were, at that time, responsible of ex-treme weather events at different places of the Mediterranean countries. The 1967 and 1962 storms produced some of the most severe bora events documented in Croatia. In these dates there were, respectively, historic wind records at Senj and Split (Vuceti´c, 1997). Moreover, the 1962 was labelled as the strongest and longest-lasting severe bora event in Split (it would be probably overcome nowadays by a very strong event occurred in 2004 (Horvarth et al., 2005).
The cyclone of 1987 corresponds to a low initially at the SW of the Iberian peninsula that evolves in a deep storm
when it arrives to the Mediterranean. Associated strong
wind gusts and heavy rain quantities were recorded at the Balearics. Afterwards the system explosively develops at the Tyrrhenian sea producing gale force winds at the Central Mediterranean.
Only one of the cases, the 1981 event, corresponds to a Genoa cyclone. In fact, this is not strictly speaking a clas-sical orographic alpine event, but it is a case in which the Alps made an enhancement effect in an explosive cyclogen-esis event.
The November 2001 and December 1979 cases are the lonely ones of the selection with values of maximum circula-tion lesser than 13 GCU. Nevertheless, the November 2001 storm is the 7th in the intensity ranking in terms of circula-tion, while the 1979 case occupies the 22th place. The reason why the last one has been included in this selection is that it has been recently documented and diagnosed by means of a modern high resolution NWP model like HIRLAM (Homar et al., 2002) and applying the today available state-of-the-art of the Mediterranean cyclogenesis. Both of them have a similar African origin, although the November case shows a more explosive and rapid development. And both of them are high impact weather events, especially the November 2001 case, with historical records in the island of Mallorca (Genov´es and Jans`a, 2003) and Algiers (Hamadache et al., 2003). Moreover, the catastrophic effects of this hurricane-like case (776 dead and 126 missing in Algeria) make of this event a reference case of last years, well documented by means of modern observation systems and current high reso-lution NWP models. These facts can help in the verification of the event from the ERA-40.
3 Areas of intensification. Tracks
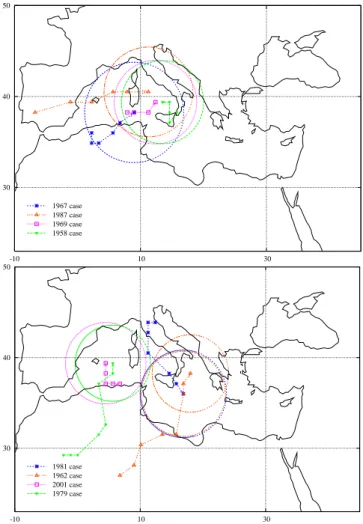
The track for each cyclone centre has been computed and some similarities have been found in the geographical areas where they reach their maximum development. The results are resumed in Fig. 1 where, for each cyclone, the position every 6 h is represented. The last position for everyone cor-responds to the maximum development time, that is, when the minimum pressure is reached. The maximum intensity is shown by a circumference whose radium is proportional to the circulation at that moment.
Some features can be emphasized in relation to the figure. Firstly, three regions of maximum development are observed. The most relevant one is the central Tyrrhenian sea and the south of Sardinia area, where four of the eight systems here considered reach their maximum development. Another re-gion in the Central Mediterranean, south of Sicily and South of mainland Italy, is also clearly important in what intensi-fication refers. In fact, two of the lows (the 1981 and 1962 cases) reach their respective minimum pressure at the same grid point. The presence of two circumferences for the 1962 storm shows the fact that it reaches twice its minimum
30 40 50 -10 10 30 1967 case 1987 case 1969 case 1958 case 30 40 50 -10 10 30 1981 case 1962 case 2001 case 1979 case
Fig. 1. Tracks of all the cases from their first detection until their
respective maximum developments. The circumferences are pro-portional to circulation, according to Table 1.
sure (982.8 and 982.7 hPa, the 14 March at 18:00 UTC and the 15 March at 06:00 UTC, respectively), due to the arrival to the area of a northern upper PV anomaly that re-activates the system. Finally, the Balearics zone is, for these selected storms, the third region of maximum intensification. This is due to the presence of two events in the area. Only one of them (the 2001 case) deserves to be in this selection at-tending to the circulation criterion, as it has been explained above. The 1979 case being intense is not the 8th in terms of circulation.
These results are in accordance to some previous clima-tological studies. Sanders and Gyakum (1980) defined a “bomb” as an extratropical surface cyclone whose central
pressure decreases at a rate of at least 1 bergeron=1 hPa×h−1
for 24 h at a latitude of 60◦N. For any other latitude, φ, the
begeron is defined by a geostrophically equivalent rate, ob-tained by multiplying that by a factor sin φ/ sin60. In the Mediterranean, the critical value of 1 bergeron varies from
20 hPa in 24 h at 45◦N to 14 hPa in 24 h at 30◦N. In a
clima-tology about meteorological bombs, referred to the Mediter-ranean, for the 1965–1984 period (Conte, 1985) and, after-wards extended until 1995, Conte et al. (1997) identified the
166 A. Genov´es et al.: Intense storms in the Mediterranean
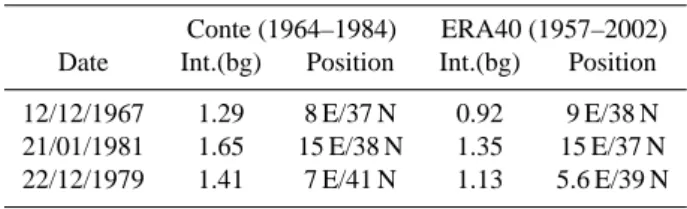
Table 2. Comparative of intensification rates and position of the
centres of the cyclones between climatological results and ERA40 monitoring of Mediterranean “bombs”.
Conte (1964–1984) ERA40 (1957–2002) Date Int.(bg) Position Int.(bg) Position 12/12/1967 1.29 8 E/37 N 0.92 9 E/38 N 21/01/1981 1.65 15 E/38 N 1.35 15 E/37 N 22/12/1979 1.41 7 E/41 N 1.13 5.6 E/39 N
Tyrrhenian, the central-south Adriatic and the northern Io-nian, and a third region including the Aegean sea, like the re-gions where the explosive development preferentially occurs. In those works, the Western Mediterranean basin around the Balearics is also a minor (in number of cases) but preferential zone of explosive development (Fig. 1 of Conte et al. (1997)). The absence of cases in the Eastern Mediterranean and the Adriatic in this paper can be emphasized. The reason for that is related to the restricted number of cases here consid-ered, that is, none of the cyclones in those areas overcome the 13 GCU of circulation. This would be probably related to the size of those weather systems. The criterion here used for selecting the cases is based on circulation values that are directly dependent on the area (domain) of the cyclone. In closed zones like the Aegean sea and the Adriatic, rounded by mountains, the systems are smaller than in the Central Mediterranean what is reflected in the value of the circula-tion and hence in their absolute intensity.
One more thing must be commented in relation to the Fig. 1. Three of the eight cases reflect a North-African origin. In fact, this influence can be extended to the November 2001 case, that initially developed as a secondary little system in the sea, from a large scale one in North-Africa (Genov´es and Jans`a, 2003) and ERA40 also reflects (see Fig. 1). This com-mon north-african origin could be of relevance for future ob-servation campaigns.
4 Comparison of intensification rates and position of the cyclone’s centres with old studies
In a first stage, the ability of the ERA40 for correctly repre-senting these intense Mediterranean storms has been checked by means of the comparison of the description from ERA40 with the existent data and/or old references relating these cases. No verification has been made, at the moment of writ-ing this paper, in front of observations for all of the cases.
In Conte (1985) the complete calendar of meteorologi-cal bombs for the period 1964–1984 was published. Ex-cept for the 1969 case, all the intense cyclogenesis events included in Table 1, and occurred between 1964 and 1984, appeared in that calendar. The 1969 event is a case of rapid and short development that shows a decrease in the pressure for only 18 h, and probably it was considered like an intense case, not a bomb. In the Conte’s list, the date of maximum
H H H H L L L 992 996 1000 1004 1004 1008 1008 1012 1012 1016 1016 1016 1016 1020 1020 1020 1024 1024 1024 1024 1024 1028 30°N 30°N 40°N 40°N 50°N 50°N 0° 0° 20°E 20°E 40°E 40°E ECMWF ERA-40 Analysis VT:Tuesday 12 December 1967 12UTC Surface: mean sea level pressure
Fig. 2. MSLP Analysis 12/12/1967 at 12:00 UTC.
deepening, the intensity in bergeron (corrected in latitude), the geographical position of the “bomb” in the moment of its maximum deepening and the mechanism of development (Conte et al., 1997) were included as parameters for charac-terising those systems. Their values (except those related to the mechanism of development) have been assessed for the correspondent events in ERA40 reanalyses. The results are resumed in Table 2.
From the table, some differences can be observed regard-ing the intensification rates and the position of the low cen-tres. First of all, the intensification rates assessed from the ERA40 analyses are clearly lesser than those from Conte. This could indicate an underestimation of the pressure at the centre of the cyclones in the analyses. One example of this possible understimation can be observed in Fig. 2 where the mslp analysis for 12 December 1967 at 12:00 UTC is pre-sented. It can be observed that surronding the center of the cyclone the pressure gradient is stopped in front of the al-most uniformly distributed gradient that would be expected at the sea surface where no obstacles are found for producing a deformation in the isobars.
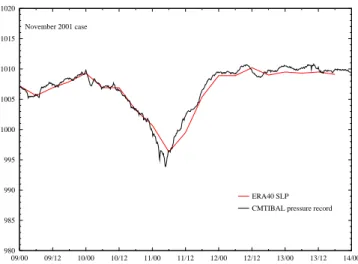
According to the Table 2, the relative differences in the in-tensification rates are around 80% of those found by Conte. It is not clear how were the intensification rates assessed by Conte, although they were done from analyses of different Bulletins of the time belonging to National Meteorological Services. This behaviour has also been observed for one more case, the 2001 case, obviously not included in Table 2. Figure 3 shows the pressure record at Palma’s CMT com-pared to the evolution of the mslp from ERA40 at 2.6 E, 39.5 N point, coincident to the CMT coordinates.
The pressure evolution is well caught by ERA40 analysis: the little fluctuations in the pressure record are also reflected in the analysis. Only the final sudden decrease of the pressure is underestimated in a 20% of the real value. In fact, this sud-den decrease is of a time scale of 1.5 h and, thus, not exactly comparable to the temporal resolution of ERA-40 analysis (6 h). It must be noted that the centre of the cyclone for this event didn’t pass exactly over Palma, but close to it. In fact, this record is the closest available to the centre of the cyclone.
This recent event, deepened on the sea and although many studies have been developed on it, it is also under study, due to the complexity that the atmospheric situation presented.
Returning to Table 2, some discrepancies are also ob-served in the position of the cyclone centre at the moment of maximum development when comparing the results from
ERA40 to those of Conte. The discrepancies appear for
the three cases but they are greater for the 1979 case. In the analysis, the cyclone reaches its minimum pressure on 22 December 1979 at 00:00 UTC, at 5.6 E/39 N. Six hours later, at 06:00 UTC, the centre of the cyclone is placed at 6.75 E/41.6 N, practically coincident with the position as-signed by Conte. Less reliable seems the evolution of the pressure at the centre of the cyclone. The pressure decreases abruptly until 6 h before the minimum pressure is reached. In the last 6 h of development the pressure decreases only 0.5 hPa. For twelve hours the behaviour of the pressure is almost constant.
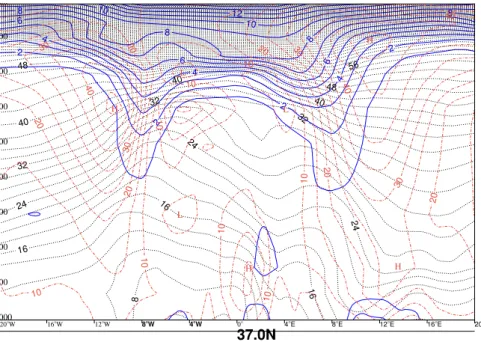
Homar et al. (2002) concluded that the latent heat release from the condensation processes throughout the troposphere was responsible for the 45% (7 hPa) of the total deepening of the 1979 cyclone. They arrived to this conclusion by means of numerical experimentation and from the analysis of a warm core present just west of an upper PV anomaly in Fig. 13 of Homar et al. (2002). The warm core and the eastern PV anomaly they studied are also present in ERA-40 analysis, like the Fig. 4 shows. Thus, in spite of the discrep-ancies related to the intensification or the position of the cen-tre of the cyclone, the ERA-40 analysis is able to reproduce this feature.
5 Conclusions
From the implementation of a procedure for detecting and tracking the cyclones on ERA40 re-analyses, the detection of the most intense storms occurred in the Mediterranean for the last 45 years has been possible. The definition of inten-sity has been based on the value of the circulation for the cyclones every time they were detected. The most intense cyclones have then been defined as those with the highest values of circulation. The criterion for the selection has im-pose restrictions about the size of the system so the study has been restricted at the moment to synoptic scale cyclones. More investigation must be done for the treatment that ERA-40 makes of some sub-synoptic systems related to high im-pact weather.
Most of these intense storms occurred in winter or late au-tumn. Only two of them have been detected in late February and March. Some of them were related to historical events of high impact weather in different Mediterranean countries, although more documentation would be necessary for a com-plete diagnosis of the cases.
The tracks of the cyclones have been computed and some common areas of maximum development have been de-tected. The central Tyrrhenian sea including the south of Sardinia is the area where the major concentration of
980 985 990 995 1000 1005 1010 1015 1020 09/00 09/12 10/00 10/12 11/00 11/12 12/00 12/12 13/00 13/12 14/00 November 2001 case ERA40 SLP CMTIBAL pressure record
Fig. 3. Pressure record at CMT in Palma de Mallorca and
ERA-40 mslp analysis for 10–12 November 2001 at point of coordinates 2.6 E, 39.5 N.
clones explosively developed. The Ionian sea and the area around the Balearic Islands are the two other zones where the cyclones reach their respective maximum developments. These results corroborate some previous climatological stud-ies about explosive developments in the Mediterranean. Al-though the same studies point to other additional areas as important for explosive developments, the restricted number of cases considered in this paper and the size of the weather systems produced there, more conditioned by orography, are probably the reasons because no system of those areas are between those with the highest circulation values.
Four of the eight cyclones detected are of North-African origin what would be taken in consideration for future obser-vation campaigns affecting the Mediterranean weather sys-tems.
All the eight systems here considered reached the maxi-mum intensity over the sea.
Some discrepancies have been detected in the intensifica-tion rates of the pressure at the centre of the cyclones and also in their position at the moment of maximum development when comparing the analyses of ERA-40 with the results of previous sudies about explosive cyclogeneses in the Mediter-ranean. The disagreement about intensification could be due to the resolution and/or to the treatment of the assimilated observations in ERA-40 system. The importance of heat and moisture fluxes in the deepening of the systems especially in the sea and in cloudy areas with a great lack of conven-tional observations makes especially relevant the information obtained from satellite data. However more investigation is needed to confirm these statements.
Acknowledgements. The ERA-40 analyses have been obtained
through the ECMWF computing facilities. The authors would like to thank the ECMWF for making the ERA-40 system available to the scientific community.
This work has been partially supported by the REN2002-03482 grant.
168 A. Genov´es et al.: Intense storms in the Mediterranean 20OW 16OW 12OW 8O W 4O W 0O 4O E 8O E 12O E 16O E 20O E 37.0N 1000 900 800 700 600 500 400 300 200 100 2 2 2 2 4 4 4 6 6 6 8 8 8 8 10 10 12 8 16 16 16 24 24 24 32 32 32 40 40 40 48 48 56 H H H H L L L 10 10 10 10 10 10 10 10 20 20 20 20 20 20 30 30 30 30 40 40 40
Fig. 4. PV (blue lines), wind (brown lines) and potential temperature (dashed lines) cross section across the cyclone centre, December 21,
1979, at 18 UTC from ERA-40 analysis. PV contouring interval, 1 PVU. Wind countouring interval, 5 m/s. Potential temperature contouring interval, 2◦C.
Edited by: V. Kotroni and K. Lagouvardos Reviewed by: anonymous referee
References
Bengtsson, L., Hodges, K., and Hagemann, S.: Sensitivity of the ERA40 reanalysis to the observing system: determination of the global atmospheric circulation from reduced observations, Tel-lus, 56A, 456–471, 2004.
Campins, J., Jans`a, A., and Genov´es, A.: Three-dimensional struc-ture of Western Mediterranean Cyclones, Int. J. Climatol., in press, 2006.
Conte, M.: The meteorological “bomb” in the Mediterranean: A synoptic climatology, Report of the Steering group meeting on Mediterranean Cyclones Study Project, PSPM Report Series No. 20, WMO/TD No 128, 17–31, 1985.
Conte, M., Piervitali, E., and Colacino, M.: The meteorological “bomb” in the Mediterranean, in: INM/WMO International sym-posium on cyclones and hazardous weather in the Mediterranean, MMA/UIB, pp. 283–287, 1997.
Genov´es, A. and Jans`a, A.: Diabatic Processes contribution to the November 2001 storm, CD of Proceedings of the 4th EGS Plinius Conference on Mediterranean Storms, PLC04-A-00047, 2003. Gil, V., Genov´es, A., Picornell, M., and Jans`a, A.: Base de datos de
ciclones a partir de an´alisis objetivos del CEPPM: Similitudes y diferencias entre el Mediterr´aneo occidental y oriental, Revista de Climatolog´ıa, 2, http://home3.worldonline.es/jaguijar/reclim. htm, 2002.
Gil, V., Genov´es, A., Picornell, M., and Jans`a, A.: Automated database of cyclones from the ECMWF model: Preliminary com-parison between West and East Mediterranean basins, CD of Pro-ceedings of the 4th EGS Plinius Conference on Mediterranean Storms, PLC04-A-00033, 2003a.
Gil, V., Genov´es, A., Picornell, M., Jans`a, A., and Navascu´es, B.: HIRLAM INM and ECMWF analyses: Comparison of their be-haviour in cyclones detection, 5th EGS Plinius Conference on Mediterranean Storms, PLC05-A-00033, 2003b.
Hamadache, B., Terchi, A., and Brachemi, O.: Study of the me-teorological situation which affected the west and the center of Algeria in general and Bab-el-Oued in particular on the 10th November 2001, CD of Proceedings of the 4th EGS Plinius Con-ference on Mediterranean Storms, PLC04-A-00063, 2003. Homar, V., Ramis, C., and Alonso, S.: A deep cyclone of African
origin over the Western Mediterranean: diagnosis and numerical simulation, Ann. Geophys., 20, 93–106, 2002.
Horvarth, K., Fita, L., Romero, R., Ivancan-Picek, B., and Stiper-ski, I.: Sensitivity of the November 2004 Mediterranean cyclone and induced bura flow in Adriatic Sea to macroscale dynamical factors, 7th EGS Plinius Conference on Mediterranean Storms, PLC07-A-00006, 2005.
Picornell, M., Jans`a, A., Genov´es, A., and Campins, J.: Automated database of mesocyclones from the HIRLAM-0.5oanalyses in the Western Mediterranean, Int. J. Climatol., 21, 335–354, 2001. Sanders, F. and Gyakum, J.: Synoptic-Dynamic Climatology of the
“Bomb”, Mon. Wea. Rev., 108, 1589–1606, 1980.
Sinclair, M. R.: Objective Identification of Cyclones and Their Cir-culation Intensity and Climatology, Wea. Forecasting, 12, 595– 612, 1997.
Uppala, S., Kallberg, P., Hern´andez, A., Saarinen, S., Fiorino, M., Li, X., Onogi, K., Sokka, N., Andrae, U., and Bechtold, V. D. C.: ERA-40: ECMWF 45-year reanalysis of the global atmosphere and surface conditions 1957–2002, ECMWF Newsletter, 101, 2– 21, 2004.
Vuceti´c, V.: Severe bora along the Adriatic coast, in: INM/WMO International symposium on cyclones and hazardous weather in the Mediterranean, pp. 517–524, MMA/UIB, 1997.