HAL Id: hal-00295990
https://hal.archives-ouvertes.fr/hal-00295990
Submitted on 24 Jul 2006
HAL is a multi-disciplinary open access
archive for the deposit and dissemination of
sci-entific research documents, whether they are
pub-lished or not. The documents may come from
teaching and research institutions in France or
abroad, or from public or private research centers.
L’archive ouverte pluridisciplinaire HAL, est
destinée au dépôt et à la diffusion de documents
scientifiques de niveau recherche, publiés ou non,
émanant des établissements d’enseignement et de
recherche français ou étrangers, des laboratoires
publics ou privés.
Development and validation of tools for the
implementation of european air quality policy in
Germany (Project VALIUM)
M. Schatzmann, W. Bächlin, S. Emeis, J. Kühlwein, B. Leitl, W. J. Müller, K.
Schäfer, H. Schlünzen
To cite this version:
M. Schatzmann, W. Bächlin, S. Emeis, J. Kühlwein, B. Leitl, et al.. Development and validation
of tools for the implementation of european air quality policy in Germany (Project VALIUM).
At-mospheric Chemistry and Physics, European Geosciences Union, 2006, 6 (10), pp.3077-3083.
�hal-00295990�
www.atmos-chem-phys.net/6/3077/2006/ © Author(s) 2006. This work is licensed under a Creative Commons License.
Atmospheric
Chemistry
and Physics
Development and validation of tools for the implementation of
european air quality policy in Germany (Project VALIUM)
M. Schatzmann1, W. B¨achlin2, S. Emeis3, J. K ¨uhlwein4, B. Leitl1, W. J. M ¨uller5, K. Sch¨afer3, and H. Schl ¨unzen1 1Meteorological Institute, ZMAW, University of Hamburg, Germany
2Ingenieurb¨uro Lohmeyer GmbH & Co. KG, Karlsruhe, Germany
3Forschungszentrum Karlsruhe, IMK-IFU, Garmisch-Partenkirchen, Germany
4Institute of Energy Economics and the Rational Use of Energy, University of Stuttgart, Germany 5Lower Saxony State Agency for Ecology, Hannover, Germany
Received: 15 August 2005 – Published in Atmos. Chem. Phys. Discuss.: 5 October 2005 Revised: 16 June 2006 – Accepted: 22 June 2006 – Published: 24 July 2006
Abstract. In the framework of the German Atmospheric
Re-search Program AFO-2000 a system of consistent coupled numerical models has been developed. The purpose of the model system is to serve as a tool for the execution of Eu-ropean urban air quality regulations. A consortium with the acronym VALIUM was formed, which consisted of German research institutes, environmental consultancies and an envi-ronmental agency.
A substantial part of the VALIUM program was devoted to the generation of a set of high quality data for the valida-tion of the numerical model system. The validavalida-tion data are based on a combination of field studies, tracer experiments and corresponding wind tunnel experiments. The field ex-periments were carried out inside and around a street canyon in a city district of Hanover/Germany. After a brief introduc-tion to the VALIUM project a summary of the main results will be given.
1 Introduction
This paper provides a short and selective review of project VALIUM which aimed on the development and validation of tools as they are needed for the execution of the European Air Quality Guideline 96/62/EU and its daughter directives. This set of regulations requires from the EU member states to submit maps that show the spatial distribution of air pollu-tants
Correspondence to: M. Schatzmann
– for the member state in total,
– for conurbations with more than 250 000 inhabitants
and
– for micro environments as, e.g., city districts subject to
high pollutant concentrations.
Project VALIUM comprised the following tasks:
– Development of the numerical model system M-SYS
which is capable to provide pollutant concentrations in spatial resolutions matched to the regional and local scales,
– development of a methodology to generate emission
data with resolutions as required by the models,
– generation of a high quality data set based on a
combi-nation of field measurements and wind tunnel simula-tions in a city district, and finally
– presentation of the measured data in the form of a
gen-erally accessible data base and utilization of the data for the validation of M-SYS and its parameterisations. Project VALIUM was designed as the German core project for EUROTRAC-SATURN “Studying Atmospheric Pollu-tion in Urban Areas” (Moussiopoulos, 2003).
2 Experiments
The field measurements were made at the test site “Goet-tinger Strasse” in Hanover/Germany (Fig. 1). This side in-cludes a busy street canyon with approximately 30 000 vehi-cles per day, a large percentage of them being trucks. Since
3078 Atmospherich Chemistry and Physics (in print) M. Schatzmann et al.: Project VALIUM
Fig. 1: Street Canyon ‘Goettinger Strasse’ with instrumentation. The picture shows the
continuous monitoring stations HRV1 to HRV3 in white and the SF6-line-source at the
median strip plus the sampling bag locations in green colour. The path-averaged
measurements are indicated by the blue (FTIR) and red (DOAS) lines.
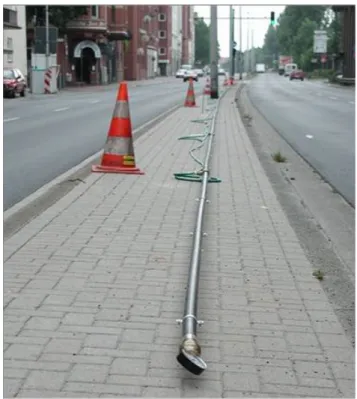
Fig. 2: Picture of the 96m long SF6 line source which was positioned on the median strip of
the street canyon.
Fig. 1. Street Canyon “Goettinger Strasse” with instrumentation. The picture shows the continuous monitoring stations HRV1 to HRV3 and the SF6-line-source at the median strip plus the sampling bag locations (solid line). The path-averaged measurements are indicated by the dotted lines.
nearly two decades the Lower Saxony State Agency for Ecol-ogy (NL ¨O) operates a monitoring station at this site. Long time series of data are available which offer the opportunity to approach the urban air pollution problem also by statistical methods (Schatzmann and Leitl, 2002).
Continuous measurements of air pollutants inside the street canyon and in an area of 1 km×1 km surrounding the canyon were performed in addition to the routine NL ¨O mon-itoring from early 2001 until the end of 2003. Both air pol-lutants and meteorological parameters were measured by in-situ instruments at four locations inside the street canyon and at three locations in the surroundings of the canyon (one of those being a roof-top station at the highest building in that area). Path-averaging optical measurement techniques (two, some times three DOAS systems) were used continuously at the ground and at building roof level. The meteorologi-cal background (vertimeteorologi-cal profiles of wind and turbulence plus mixing layer height) came from a SODAR system that was positioned about 500 m apart from the street canyon (Emeis, 2004; Emeis and T¨urk, 2004). The determination of the mix-ing layer height over an urban area is a subject of ongomix-ing research (Baklanov et al., 20061; Rotach et al., 2005).
1Baklanov, A., Joffre, S., Piringer, M., Deserti, M., Middleton,
D., Tombrou, M., Karppinen, A., Emeis, S., Prior, V., and Rotach, M.: Towards Estimating the Mixing Height in Urban Areas – Re-cent Experimental and Modelling Results from the COST-715 Ac-tion, Bound.-Lay. Meteorol., submitted, 2006.
Atmospherich Chemistry and Physics (in print)
Fig. 1: Street Canyon ‘Goettinger Strasse’ with instrumentation. The picture shows the
continuous monitoring stations HRV1 to HRV3 in white and the SF6-line-source at the
median strip plus the sampling bag locations in green colour. The path-averaged
measurements are indicated by the blue (FTIR) and red (DOAS) lines.
Fig. 2: Picture of the 96m long SF6 line source which was positioned on the median strip of
the street canyon.
Fig. 2. Picture of the 96 m long SF6 line source which was posi-tioned on the median strip of the street canyon.
Three intensive observation periods (IOPs) in different seasons were successfully executed. Path-averaged concen-trations of air pollutants were measured at both sides of the street using FTIR spectrometry. In addition, vertical gradi-ents of air pollutants in the street canyon were determined applying a DOAS-system. During selected periods, the stan-dard meteorological measurements performed continuously at the roof top station and by the SODAR system were com-plemented by those of (1) a ceilometer (operated by Vaisala, M¨unkel et al., 2004) that was located at the roof of a build-ing, and (2) a Wind-Temperature-RADAR (WTR, operated by IMK-ASF). The ceilometer (aerosol backscatter profile, Sch¨afer et al., 2004) and WTR mixing layer height data (tem-perature profile) were used for comparisons with the SODAR data (Emeis et al., 2004). All measurement systems were carefully calibrated. Simultaneous operation of the different instruments carried out at one site before or after each IOP showed only differences in the order of the specified accu-racy of the instruments.
Most of the previous field experiments carried out in ur-ban areas suffer from the fact that the source term is not properly known. There is the choice between several emis-sion models that link the traffic flow to the source strength. Since the concentration fields predicted in dispersion calcu-lations are directly proportional to the source strength, the results of numerical models may to a large degree depend on the particular choice of the emission model. In order to cir-cumvent this problem, the meteorological and pollutant mea-surements in the Goettinger Strasse were complemented by some tracer experiments. An artificial line source was in-stalled on the median strip dividing the four traffic lanes, and controlled amounts of SF6 were released (Fig. 2). The line source had a length of 96 m. Air probes were collected at 15 sampling points within the street canyon and at roof level. The SF6content of the probes was subsequently analysed in the laboratory. For altogether 8 days within the period 2001 to 2003, 100 half-hourly averaged concentration values were determined at each monitoring position. Additionally path averaged concentrations of tracer SF6were measured at both sides of the street using FTIR spectrometry. Prevailing wind directions during the experiments were westerly for five days and northerly, easterly and southerly, respectively, for the re-maining 3 days.
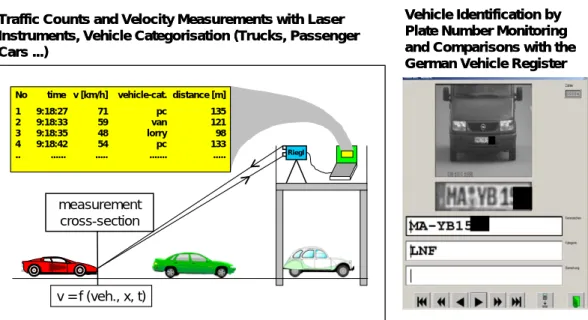
The tracer experiments provided the opportunity to val-idate not only dispersion models but emission models as well. During the intensive observation periods, manual traf-fic counts were carried out together with traftraf-fic speed mea-surements (Fig. 3). In addition, the vehicles were subject to an automated plate number registration. The subsequent consultation of the German vehicle register allowed the ex-act determination of the vehicle engines and, by means of emission factors, the best possible quantification of the traf-fic emission rate.
The weather conditions during field campaigns cannot be controlled, one has to cope with the weather as it is.
The boundary conditions for the experiments are only partly known and, even worse, they change continuously due to the diurnal cycle. Therefore, VALIUM comprised also a wind tunnel sub-project that was tasked to support the field measurement campaigns with corresponding flow visualiza-tion experiments and with some systematic sensitivity studies which help to analyse and to understand the data. In addition complete fields of velocity and concentration were measured within the street canyon with a spatial resolution which cor-responds to that of micro-scale numerical models. A detailed aerodynamic wind tunnel model of the urban site was built, the complete model covering an area of about 1 km×1 km. A wind tunnel boundary layer corresponding to the model scale (1:250) was generated utilizing a combination of vortex gen-erators and floor roughness elements. The complete mean and turbulent boundary layer properties were determined. Subsequently numerous and until now unique experiments have been carried out from which only a few examples can be presented in the results part of this paper.
3 Numerical model development
The meso- and micro-scale meteorological and chemistry transport models METRAS (Schl¨unzen, 1990), MITRAS (Schl¨unzen et al., 2003), MECTM (Lenz et al., 2000) and MICTM (Grawe, 20062) were combined to the model sys-tem M-SYS (Trukenm¨uller et al., 2004). Three mesoscale and one micro-scale model area were used to receive concen-tration maps of different resolution. For M-SYS the neces-sary input data (building inventory, emission inventory) has been processed, and an analysis procedure on the basis of routine meteorological observations was developed. The gas phase chemical mechanism was complemented with simple aerosol chemistry, and a nudging method for chemical data assimilation was implemented and applied. The sensitivity of model results on the different horizontal resolutions used in the mesoscale was reduced by calculating aggregated sur-face fluxes for the meteorological parameters (Schl¨unzen and Katzfey, 2003). All these measures lead to a significant im-provement of model performance in comparison with obser-vations. After completion of the development phase a large number of simulations were made.
4 Results
The VALIUM experiments are up to now the probably world-wide largest and most detailed of its kind. In order to make the data generally accessible, the “intelligent” database VAL-IDATA was created that comprises the measurements in a 2Grawe, D.: Verkn¨upfung von Modellen und Messungen
zur Konzentrationsvorhersage, PhD-thesis, Fachbereich Geowis-senschaften, University of Hamburg (in German), in preparation, 2006.
3080 Atmospherich Chemistry and Physics (in print) M. Schatzmann et al.: Project VALIUM
v = f (veh., x, t) measurement cross-section
Riegl
No time v [km/h] vehicle-cat. distance [m]
1 9:18:27 71 pc 135 2 9:18:33 59 van 121 3 9:18:35 48 lorry 98 4 9:18:42 54 pc 133 .. ... ... ... ... Vehicle Identification by Plate Number Monitoring and Comparisons with the German Vehicle Register Traffic Counts and Velocity Measurements with Laser
Instruments, Vehicle Categorisation (Trucks, Passenger Cars ...)
Fig. 3: Experimental set-up for traffic counts and vehicle speed measurements
y = -6.1928x + 572.4 R2 = 0.3596 0 200 400 600 800 1000 0 20 40 60 80 100 120 140
Daily mean of NOx concentration [µg/m³]
D
aily
m
ean
of mixing layer height
[
m
]
Fig. 4: Correlation of NOx with mixing layer height for the roof-top station at Goettinger
Strasse.
Fig. 3. Experimental set-up for traffic counts and vehicle speed measurements.
Atmospherich Chemistry and Physics (in print)
v = f (veh., x, t) measurement cross-section
Riegl
No time v [km/h] vehicle-cat. distance [m] 1 9:18:27 71 pc 135 2 9:18:33 59 van 121 3 9:18:35 48 lorry 98 4 9:18:42 54 pc 133 .. ... ... ... ... Vehicle Identification by Plate Number Monitoring and Comparisons with the German Vehicle Register Traffic Counts and Velocity Measurements with Laser
Instruments, Vehicle Categorisation (Trucks, Passenger Cars ...)
Fig. 3: Experimental set-up for traffic counts and vehicle speed measurements
y = -6.1928x + 572.4 R2 = 0.3596 0 200 400 600 800 1000 0 20 40 60 80 100 120 140
Daily mean of NOx concentration [µg/m³]
D
aily
m
ean
of mixing layer height
[
m
]
Fig. 4: Correlation of NOx with mixing layer height for the roof-top station at Goettinger
Strasse. Fig. 4. Correlation of NOxwith mixing layer height for the roof-top
station at Goettinger Strasse.
well-documented and easily understandable form. Before the data entered the database they have been checked for plausibility and consistency. Part of the examination was the comparison of the spot concentrations at the monitor-ing positions with the line-averaged measurements along the Goettinger Strasse. Furthermore the dilution of the tracer gas SF6 was compared with that of NOx. It was checked whether the pattern of path-averaged air pollutant concentra-tions at both sides of the Goettinger Strasse shows the rotor-like circulation inside the street canyon. Whenever possi-ble the data were compared with the results of the wind tun-nel that were obtained under carefully controlled and steady boundary conditions. In all cases the data agreed reasonably well with each other and showed the expected qualitative and quantitative behaviour.
From the numerous results obtained only a few can be mentioned here. The analysis of NOx concentrations
mea-sured at the roof top station during the whole period 2001– 2003 revealed that about one third of the variance of NOx concentrations was caused by regional transport and depends on the mixing layer height as shown in Fig. 4 (Sch¨afer et al., 2005). At ground-level stations this dependence has not been found. The correlation between mixing layer height and PM10is much weaker and not different for ground and roof top level data, but the PM10 concentrations at ground level inside the street canyon are about twice as high as those at roof level. That confirms the expectation that the concentra-tions measured at roof top are representative for the urban quarter surrounding the street canyon. In contrast to that, the concentration measurements at ground level are dominated by traffic emissions inside the canyon.
The mixing layer heights for the aforementioned correla-tion analysis have been derived from the SODAR measure-ments by analyzing the acoustic backscatter intensity and the standard deviation of the vertical wind component (σw). This
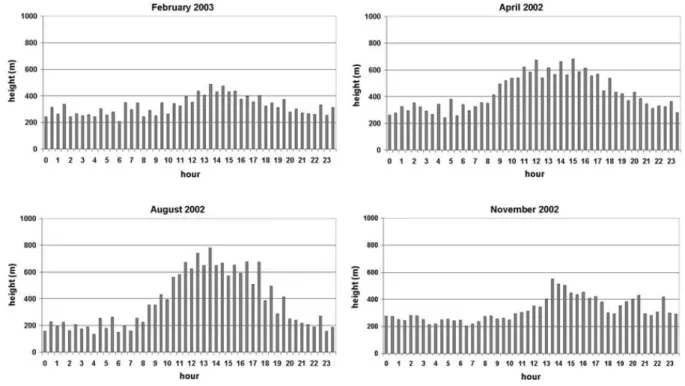
evaluation scheme (Emeis and T¨urk, 2004) allows distin-guishing between super-adiabatic and thermally stable tem-perature gradients near the surface. The averaged results showed a clear diurnal cycle and an annual cycle of the mix-ing layer height (Fig. 5). Further, the SODAR data delivered vertical profiles of mean wind speed and turbulence intensity up to 700 m above ground. Turbulence intensity was espe-cially enhanced at night time due to the larger heat storage at the urban surface (Emeis, 2004).
The comparison of wind vectors determined by the SO-DAR system with those from the roof top station (10 m above roof level) showed that for this quantity the roof station mea-surements are not fully representative for the site. The veloc-ity data are influenced by the building itself and by the build-ing structure surroundbuild-ing the site. This findbuild-ing is confirmed
M. Schatzmann et al.: Project VALIUM 3081
Fig. 5: Monthly mean mixing-layer height over the city of Hanover (Germany) derived from
SODAR measurements for four months from the four seasons (from Emeis and Türk 2004).
Fig. 6: Physical model of the site in the Boundary Layer Wind Tunnel of Hamburg University
Fig. 5. Monthly mean mixing-layer height over the city of Hanover (Germany) derived from SODAR measurements for four months from the four seasons (from Emeis and T¨urk, 2004).
by the wind tunnel measurements that allowed quantifying the wind vector modification.
The traffic measurements in the street canyon Goettinger Strasse in Hanover showed, that the driving behaviour and the driving patterns are subject to strong temporal variations. The common procedure to assign a rigid “traffic situation” to a given road segment results in considerable errors and should not be applied in numerical simulations with high temporal resolution. The quality of currently published emis-sion factors (including systematic errors) has been assessed by comparisons between the emission rates, modelled on the basis of the extended traffic measurements, measured pollu-tant concentrations and the data from the tracer gas experi-ment (K¨uhlwein, 2004).
Air pollution in the Goettinger Strasse is predominantly caused by traffic emissions. As is typical for so-called hot spots in cities, the sources and the receptor points are close together. The values measured at the pedestrian walkway must depend on the source location. The VALIUM tracer ex-periment was carried out with an artificial SF6 line source, which was located at the median strip at the centre of the street canyon, whereas the vehicles emit along the four traf-fic lanes. To study how the values measured depend on the source conditions, in the wind tunnel (Fig. 6) the follow-ing scenarios were carried out, (a) all traffic lanes emitted equally, (b) the lanes emitted according to their traffic den-sity and (c) each lane emitted separately. Since in the field experiments the line source was only 96 m long, the effect
Atmospherich Chemistry and Physics (in print)
Fig. 5: Monthly mean mixing-layer height over the city of Hanover (Germany) derived from SODAR measurements for four months from the four seasons (from Emeis and Türk 2004).
Fig. 6: Physical model of the site in the Boundary Layer Wind Tunnel of Hamburg University Fig. 6. Physical model of the site in the Boundary Layer Wind
Tunnel of Hamburg University.
of the finite length of the source was also studied (Pascheke et al., 2005). Additional laboratory experiments investigated the influence of different averaging times on mean concen-tration values (Pascheke, 20063).
3Pascheke, F.: Systematische Untersuchung von mikroskaligen
Str¨omungs- und Transportprozessen in st¨adtischer Bebauung, PhD thesis, Dep. of Earth Sciences, University of Hamburg (in German), under preparation, 2006.
3082 Atmospherich Chemistry and Physics (in print) M. Schatzmann et al.: Project VALIUM
Fig 7: Numerical model results for the Goettinger Strasse (in the centre of the figure) and
vicinity. Shown is a horizontal cross section of NO
2concentration at a height of 1.5 m above
ground for 11th April, 2003, 07:00-07:30 as simulated with the MITRAS/MICTM model
system. NO2 is formed by chemical reaction between the primarily emitted NO and O
3advected into the street from outside. The meandering of the plume in the street canyon is
caused by heterogeneities in the wind field. A convergence zone in the northernmost part of
the street causes the two peak concentration spots.
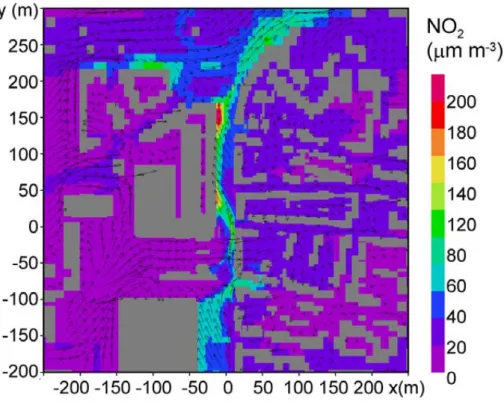
Fig. 7. Numerical model results for the Goettinger Strasse (in the centre of the figure) and vicinity. Shown is a horizontal cross section of NO2concentration at a height of 1.5 m above ground for 11 April 2003, 07:00–07:30 as simulated with the MITRAS/MICTM model system.
NO2 is formed by chemical reaction between the primarily emitted NO and O3advected into the street from outside. The meandering of the
plume in the street canyon is caused by heterogeneities in the wind field. A convergence zone in the northernmost part of the street causes the two peak concentration spots.
During measurement campaigns only individual cases are covered. The characterisation of the general pollutant situa-tion at a site requires numerical modelling. It is known that substantial parts of the pollutant concentrations measured at an urban site can be caused by long-range and regional transport. Therefore it is necessary to apply a hierarchy of meso- and micro-scale models nested into each other. For more than 40 days of year 2000 concentration simulations were performed on a 16×16 km grid. The selected peri-ods correspond to those situations which have shown high NO2-concentrations in the area of Hanover. The model re-sults were in good agreement with those of the measurements (Schl¨unzen et al., 2005). Maps showing concentration distri-butions were compiled at the various scales.
For the VALIUM project the micro-scale flow simula-tions were of particular interest. Good agreement can be reported between the numerical model results and the data taken within and around the street canyon or in the wind tun-nel. The micro-scale concentration fields are very hetero-geneous; for westerly flow they show two local peaks some 60 m apart, which is in agreement with SF6 tracer experi-ments. For easterly winds it was found that tracers are ex-ported from the street canyon over the roofs into the back-yards.
It has been demonstrated that the model system M-SYS is fit for its purpose. M-SYS is presently able to simulate the meteorological fields and the following pollutants considered in the EC daughter directives: SO2, NO2, NOx, some of the PM10-substances (secondary ammonium aerosols), CO and O3(Fig. 7). The prototype version of M-SYS is generally available. Due to the fact that the originally planned second period of AFO2000 was cancelled, a fully documented PC version of M-SYS needs still to be developed.
5 Conclusions
The combination of field studies, wind tunnel experiments and numerical model simulations within one project proved to be a very successful strategy to investigate the complex flow and transport processes that occur in urban environ-ments. The main objectives of VALIUM, the development of a prototype model system that provides pollutant concentra-tions in spatial resoluconcentra-tions matched to the requirements of the new European regulations and the generation of a high qual-ity data set based on a combination of field measurements and wind tunnel simulations in a city district, were reached.
Additionally, project VALIUM can give answers to a num-ber of questions that are of particular importance for urban air
pollution studies:
– How accurate are present emission models for
micro-scale applications?
– What are the chances of ground-based remote sensing
techniques for the determination of vertical profiles of atmospheric variables in urban areas?
– What is the influence of surrounding buildings on
roof-top measurements at urban sites?
– How much dependent are air pollution levels in urban
environments on the height of the mixing layer?
– To which degree are local concentrations influenced by
long-range and regional pollutant transport?
– How representative are concentrations measured at
po-sitions within the canopy layer with respect to time and space?
– Is the commonly used non-dimensional concentration
c∗a suitable parameter for the generalisation of street canyon concentrations from one situation to the other?
– To which extent depend numerical or physical model
results on the choice of the domain size?
– How sensitive are street canyon measurements to the
particular source pattern?
However, there are also open questions for which final an-swers have not yet been found. These comprise the contribu-tion of vehicle-induced turbulence to pollutant dispersion in street canyons, the representativeness of episodic measure-ments within the urban canopy layer and the concepts for a unified presentation of concentration data.
Acknowledgement. The authors are grateful for financial support from the German Ministry for Education and Research (BMBF) through the Atmospheric Research Programme AFO2000. Many helpful discussions with the FUMAPEX community are gratefully acknowledged.
Edited by: A. Baklanov
References
Emeis, S.: Vertical wind profiles over an urban area, Meteorol. Z., 13, 353–359, 2004.
Emeis, S. and T¨urk, M.: Frequency distributions of the mixing height over an urban area from SODAR data, Meteorol. Z., 13, 361–367, 2004.
Emeis, S., M¨unkel, Chr., Vogt, S., M¨uller, W. J., and Sch¨afer, K.: Atmospheric boundary-layer structure from simultaneous SO-DAR, RASS, and ceilometer measurements, Atmos. Environ., 38, 273–286, 2004.
K¨uhlwein, J.: Unsicherheiten bei der rechnerischen Ermittlung von Schadstoff-emissionen des Straßenverkehrs und Anforderungen an zuk¨unftige Modelle, PhD-thesis, Fakult¨at Maschinenbau, University of Stuttgart (in German), 2004.
Lenz, C.-J., M¨uller, F., and Schl¨unzen, K. H.: The sensitivity of mesoscale chemistry transport model results to boundary values, Env. Monitoring and Assessment, 65, 287–298, 2000.
Moussiopoulos, N.: Air Quality in Cities, Springer-Verlag, ISBN 3-540-00842-x, 2003.
M¨unkel, C., Emeis, S., M¨uller, W. J., and Sch¨afer, K.: Aerosol con-centration measurements with a lidar ceilometer: results of a one year measurement campaign, in: Remote Sensing of Clouds and the Atmosphere VIII, edited by: Sch¨afer, K., Comeron, A., Car-leer, M., and Picard, R. H., Proceedings of SPIE, Bellingham, WA, USA, Vol. 5235, 486–496, 2004.
Pascheke, F., Leitl, B., and Schatzmann, M.: Dispersion of traffic pollutants in street canyons – a systematic windtunnel study to evaluate a field tracer experiment, Proceedings 5th Int. Conf. on Urban Air Quality, Valencia, March 29–31, 2005.
Rotach, M., Vogt, R., Bernhofer, C., Batchvarova, E., Christen, A., Clappier, A., Feddersen, B., Gryning, S. E., Martucci, G, Mayer, H., Mitev, V., Oke, T. R., Parlow, E., Richner, H., Roth, M., Roulet, Y. A., Ruffieux, D., Salmond, J. A., Schatzmann, M., and Voogt, J. A.: BUBBLE – An urban boundary layer meteorology project, Theor. Appl. Climatol., 81, 231–261, 2005.
Schatzmann, M. and Leitl, B.: Validation and application of ob-stacle resolving urban dispersion models, Atmos. Environ., 36, 4811–4821, 2002.
Sch¨afer, K., Emeis, S., Rauch, A., M¨unkel, Ch., and Vogt, S.: De-termination of mixing layer heights from ceilometer data, in: Remote Sensing of Clouds and the Atmosphere IX, edited by: Sch¨afer, K., Comeron, A., Carleer, M., Picard, R. H., Sifakis, N., Proceedings of SPIE, Bellingham, WA, USA, Vol. 5571, 248– 259, 2004.
Sch¨afer, K., Emeis, S., Hoffmann, H., Jahn, C., M¨uller, W. J., Heits, B., Haase, D., Drunkenm¨olle, W.-D., B¨achlin, W., Schl¨unzen, H., Leitl, B., Pascheke, F., and Schatzmann, M.: Field measurements within a quarter of a city including a street canyon to produce a validation data set, Int. J. Environ. Poll., 25, 201–216, 2005. Schl¨unzen, K. H.: Numerical studies on the inland penetration of
sea breeze fronts at a coastline with tidally flooded mudflats, Beitr. Phys. Atmosph., 63, 243–256, 1990.
Schl¨unzen, K. H., Bohnenstengel, S., and Trukenmueller, A.: Rel-evance of surface flux aggregation for different meteorological situations, Contribution to EMS Utrecht, 12.–16.09.2005. Schl¨unzen, K. H., Hinneburg, D., Knoth, O., Lambrecht, M., Leitl,
B., Lopez, S., L¨upkes, C., Panskus, H., Renner, E., Schatzmann, M., Schoenemeyer, T., Trepte, S., and Wolke, R.: Flow and trans-port in the obstacle layer – First results of the microscale model MITRAS, J. Atmos. Chem., 44, 113–130, 2003.
Schl¨unzen, K. H. and Katzfey, J. J.: Relevance of sub-grid-scale land-use effects for mesoscale models, Tellus, 55A, 232–246, 2003.
Trukenm¨uller, A., Grawe, D., and Schl¨unzen, K. H.: A model sys-tem for the assessment of ambient air quality conforming to EC directives, Meteorol. Z., 13, 387–394, 2004.