HAL Id: hal-01984166
https://hal.archives-ouvertes.fr/hal-01984166
Submitted on 6 Feb 2019HAL is a multi-disciplinary open access archive for the deposit and dissemination of sci-entific research documents, whether they are pub-lished or not. The documents may come from teaching and research institutions in France or abroad, or from public or private research centers.
L’archive ouverte pluridisciplinaire HAL, est destinée au dépôt et à la diffusion de documents scientifiques de niveau recherche, publiés ou non, émanant des établissements d’enseignement et de recherche français ou étrangers, des laboratoires publics ou privés.
Mrk 1040. Revealing the Failed Nuclear Wind with
Chandra
J. Reeves, V. Braito, E. Behar, T. Fischer, S. Kraemer, A. Lobban, E.
Nardini, D. Porquet
To cite this version:
J. Reeves, V. Braito, E. Behar, T. Fischer, S. Kraemer, et al.. High-resolution X-Ray Spectroscopy of the Seyfert 1 , Mrk 1040. Revealing the Failed Nuclear Wind with Chandra. The Astrophysical journal letters, Bristol : IOP Publishing, 2017, 837 (1), pp.23. �hal-01984166�
arXiv:1702.00461v1 [astro-ph.HE] 1 Feb 2017
Nuclear Wind with Chandra.
J. N. Reeves1,2, V. Braito1,3, E. Behar4,5, T. C. Fischer6, S. B. Kraemer7, A. Lobban2,8, E. Nardini2,9, D. Porquet10, T. J. Turner11
ABSTRACT
High resolution X-ray spectroscopy of the warm absorber in the nearby X-ray bright Seyfert 1 galaxy, Mrk 1040 is presented. The observations were carried out in the 2013–2014 time-frame using the Chandra High Energy Transmission Grating with a total exposure of 200 ks. A multitude of absorption lines from Ne, Mg and Si are detected from a wide variety of ioniza-tion states. In particular, the detecioniza-tion of inner K-shell absorpioniza-tion lines from Ne, Mg and Si, from charge states ranging from F-like to Li-like ions, suggests the presence of a substantial amount of low ionization absorbing gas, illuminated by a steep soft X-ray continuum. The ob-servations reveal at least 3 warm absorbing components ranging in ionization parameter from
log(ξ/erg cm s−1) = 0 − 2 and with column densities of N
H = 1.5 − 4.0 × 1021cm−2. The velocity profiles imply that the outflow velocities of the absorbing gas are low and within
±100 km s−1 of the systemic velocity of Mrk 1040, which suggests any outflowing gas may
have stalled in this AGN on large enough scales. The warm absorber is likely located far from the black hole, within 300 pc of the nucleus and is spatially coincident with emission from an extended Narrow Line Region as seen in the HST images. The iron K band spectrum reveals only narrow emission lines, with Fe Kα at 6.4 keV consistent with originating from reflection
off Compton thick pc-scale reprocessing gas.
1
Center for Space Science and Technology, University of Maryland Baltimore County, 1000 Hilltop Circle, Baltimore, MD 21250, USA; [email protected]
2Astrophysics Group, School of Physical and Geographical Sciences, Keele University, Keele, Staffordshire, ST5 5BG, UK;
3
INAF - Osservatorio Astronomico di Brera, Via Bianchi 46 I-23807 Merate (LC), Italy
4
Dept of Physics, Technion, Haifa 32000, Israel
5
Department of Astronomy, University of Maryland, College Park, MD 20742, USA
6
Astrophysics Science Division, NASA Goddard Space Flight Center, Code 665, Greenbelt, MD 20771, USA
7Institute for Astrophysics and Computational Sciences, Department of Physics, The Catholic University of America,
Washing-ton, DC 20064, USA
8
Dept of Physics and Astronomy, University of Leicester, University Road, Leicester LE1 7RH, UK
9INAF - Arcetri Astrophysical Observatory, Largo Enrico Fermi 5, I-50125 Firenze, Italy 10
Universit´e de Strasbourg, CNRS, Observatoire astronomique de Strasbourg, UMR 7550, F-67000 Strasbourg, France
11
Subject headings: galaxies:active — galaxies: individual: Mrk 1040 — X-rays: galaxies
1. Introduction
Material existing within the vicinity of the super-massive black hole in an Active Galactic Nucleus (AGN) can significantly modify the resultant X-ray spectrum. Consequently, detailed studies of the repro-cessed primary X-ray emission can reveal valuable information about the kinematics and geometry of the central nucleus. In the soft X-ray band (below 2 keV), the dominant reprocessing mechanism is absorption by photoionized (or “warm”) material along the line of sight. In fact systematic X-ray studies of AGN with ASCA, Chandra, XMM-Newton and Suzaku have established that at least half of all type 1 Seyferts host warm absorbers (Reynolds 1997; George et al. 1998; Crenshaw et al. 2003; Porquet et al. 2004; Blustin et al. 2005; McKernan et al. 2007; Tombesi et al. 2013). When observed at high spectral resolution, such as with the X-ray grating spectrometers onboard either Chandra or XMM-Newton, the warm absorber is seen to give rise to numerous narrow absorption lines from astrophysically abundant elements such as C, N, O, Ne, Mg, Si, S and Fe (Kaastra et al. 2000; Kaspi et al. 2002; Blustin et al. 2002; McKernan et al. 2003). The warm absorption is often seen to be outflowing and can arise from gas covering a wide (several orders of magnitude) range of column densities and ionization parameters.
Indeed the X-ray spectral signatures of the warm absorber range can arise from very low ionization gas from ions with low charge states; such as from the Unresolved Transition Array (UTA) of M-shell iron (< FeXVII) at ∼ 16 ˚A (Sako et al. 2001; Behar et al. 2001) or from inner (K-shell) transitions of L-shell ions from lighter elements, such as O through to Si (Behar & Netzer 2002; Gu et al. 2005). On the other hand, the absorbing gas can also be very highly ionized, in some cases arising from H-like and He-like iron, where such highly ionized gas may originate from an accretion disk wind (e.g., Reeves et al. 2004; Risaliti et al. 2005; Braito et al. 2007; Turner et al. 2008; Tombesi et al. 2010; Gofford et al. 2013). The associated absorption lines are often blueshifted, thus implying outflowing winds, with velocities ranging from a few hundred to a few thousand km s−1, or even exceeding 10000 km s−1 in the case of the so-called ultra fast outflows (Chartas et al. 2002; Pounds et al. 2003; Reeves et al. 2003; Tombesi et al. 2013; Gofford et al. 2013; Nardini et al. 2015; Tombesi et al. 2015; Longinotti et al. 2015).
With the exception of the ultra fast outflows, which are often highly ionized and may originate from an accretion disk wind on sub-pc scales, most soft X-ray warm absorbers are thought to be typically located at fairly large distances from the central black hole. This is as a result of their low ionization parame-ters and outflow velocities (< 1000 km s−1), their (relative) lack of variability, plus in some cases from their inferred low densities (e.g., NGC 3783: Behar et al. 2003; Krongold et al. 2005; Mrk 279: Scott et al. 2004; Ebrero et al. 2010; NGC 4051: Steenbrugge et al. 2009; Mrk 290: Zhang et al. 2011; and Mkn 509: Kaastra et al. 2012). These soft X-ray warm absorbers can be associated with, for example, a wind origi-nating from the putative parsec scale torus (Blustin et al. 2005) or the latter stages of an accretion disc wind which has propagated out to larger radii (Proga & Kallman 2004; Tombesi et al. 2013), or from gas associ-ated with the AGN Narrow Line Regions (Crenshaw et al. 2000; Crenshaw & Kraemer 2000). Although the
exact kinematic contribution of the warm absorbers to the total AGN luminosity can be difficult to assess (Crenshaw & Kraemer 2012), they may still play a key role in shaping the wide scale properties of AGN host galaxies (Hopkins & Elvis 2010).
1.1. The Target: Markarian 1040
Mrk 1040 (also known as NGC 931) is a bright, nearby (z = 0.016652, Huchra et al. 1999) type-1
Seyfert galaxy. The likely black hole mass islog(MBH/M⊙) = 7.64±0.40 (Zhou et al. 2010; De Marco et al. 2013), as estimated from its stellar velocity dispersion (Nelson & Whittle 1995; Tremaine et al. 2002). In X-rays, Mrk 1040 was observed by ASCA in August 1994 (Reynolds et al. 1995) and the spectral features were interpreted as arising from a warm absorber plus a strong broad, fluorescent Fe Kα emission line (FWHM ∼16 000–70 000 km s−1;EW = 500 ± 250 eV). It is also bright in the hard X-ray bandpass, having been
detected in the 70 month Swift BAT catalogue, with a 14-195 keV band flux of6.1 × 10−11erg cm−2s−1 (Baumgartner et al. 2013). Mrk 1040 was subsequently observed by XMM-Newton in February 2009 when the source flux was high, with a total exposure of ∼84 ks. The spectrum revealed all the classic Seyfert 1 characteristics; a soft X-ray excess, a deep warm absorber below 2 keV and a strong Fe Kα line profile
(Tripathi et al. 2011). The AGN is also strongly variable on timescales of104s and an energy dependent lag was claimed from the XMM-Newton observation (Tripathi et al. 2011), similar to the soft X-ray (or negative) lags that have been claimed in other AGN (De Marco et al. 2013). Yet despite its X-ray brightness, similar to other bright and nearby Seyfert 1 galaxies, the X-ray spectrum of Mrk 1040 is comparatively understudied and no high resolution X-ray spectrum has yet been published on this AGN.
The host galaxy of Mrk 1040 is a Sbc spiral galaxy and is viewed at high inclination ofb/a = 0.21
(de Zotti & Gaskell 1985; Amram et al. 1992). The UV continuum is heavily reddened, which Crenshaw & Kraemer (2001) suggested was due to dust in the plane of the host galaxy. Based on the width of Hβ, Full Width at
Half Maximum (FWHM) of ∼1830 km s−1, it is classified as a Narrow-Line Seyfert 1 (Osterbrock & Shuder 1982). If the narrowness of the Balmer lines is due to a line-of-sight close to the rotation axis of the black hole/accretion disk (Kraemer et al. 2012), then our view of the AGN in Mrk 1040 may be roughly pole-on, which suggests that the AGN is highly inclined with respect to the disk of the host galaxy.
This paper presents the analysis of a series of Chandra High Energy Transmission Grating (HETG) (Weisskopf et al. 2000; Canizares et al. 2005) observations of Mrk 1040 from October 2013 to March 2014, with a total exposure of ∼200 ks. Indeed the observations provide the first reported high spectral resolution
observations of this Seyfert 1 galaxy over the X-ray band. Subsequent observations with XMM-Newton were also obtained during 2015, with a total exposure of 175 ks in the RGS; these together with the archival observation from 2009 will be presented in a subsequent paper (hereafter paper II). One of the primary goals was to study the warm absorber in this AGN in unprecedented detail and resolution. Here the HETG provides the higher energy coverage of the warm absorber, especially in the 1 keV band and above and covering the Ne through Fe K-shell lines, with the RGS providing high sensitivity coverage at lower energies down to 0.3 keV.
The paper is organized as follows. In Section 2, we describe the observations and reduction of the HETG spectra. Section 3 is devoted to the spectral fitting of the HETG data, including atomic line detec-tions and identificadetec-tions as well as the measurements of the kinematics and profiles of the absorption lines. The properties of the emission lines, such as in the iron K-shell band and the He-like triplets, are also pre-sented. Section 4 presents photoionization modeling of the X-ray absorption in the HETG, which as will be shown requires multiple absorption components to cover the wide range of ionization states seen in the absorption spectrum. In Section 5, we discuss about the origins and infer some physical properties of the X-ray absorbing media observed in Mrk 1040. The properties of the X-ray gas are then compared to the images and kinematics of the nuclear [OIII] emitting gas seen from archival Hubble Space Telescope (HST) observations. As we will show, the X-ray absorber appears to show no evidence of outflow to high precision and the ionized gas may be in part associated with a failed wind located within ∼100 pc of the nucleus.
2. Chandra Observations and Data Reduction
Chandra observed Mrk 1040 four times between 24 September 2013 to 3 March 2014 (see Table 1 for a summary), with three of the four observations occurring within a one week period from 25 February 2014 and 3 March 2014. Spectra were extracted with the CIAOpackage v4.7 (Fruscione et al. 2006). Only the first order dispersed spectra were considered for both the MEG (Medium Energy Grating) and HEG (High Energy Grating) and the ±1 orders for each grating were subsequently combined for each sequence. No
significant spectral variability was observed between the four sequences, with only modest ∼5% variations
in count rate (see Table 1). Therefore the spectra were combined from all four sequences to yield a single 1st order spectrum for each of the MEG and HEG, yielding respective net source count rates of0.457±0.002 s−1 (from 0.8–5.0 keV) and 0.238 ± 0.001 s−1 (from 1.2-9.0 keV) respectively for a total exposure time of 197.8 ks. The total counts obtained exceeded 90000 and 47000 counts for MEG and HEG respectively, while the background count rate was negligible. The undispersed zeroth order image shows no evidence for extended X-ray emission in excess of the telescope point spread function.
The resultant time-averaged source spectra were subsequently binned at 3 different levels. These cor-respond to either at Half Width at Half Maximum (HWHM) of the spectral resolution (i.e. ∆λ = 10 m ˚A and ∆λ = 5 m ˚A bins for MEG and HEG respectively), at the FWHM of the resolution, or at twice the FWHM resolution. Note that at 1 keV (or 12.3984 ˚A), the HWHM binning corresponds to velocity intervals of∆v = 240 km s−1 and ∆v = 120 km s−1, per spectral bin, for the MEG and HEG respectively. The former finer HWHM binning was adopted for the subsequent spectral fitting as well as for obtaining veloc-ity profiles of the lines, while the latter more coarsely binned spectra (FWHM or twice FWHM) were used for an initial inspection of the data and for some of the spectral plots. The MEG and HEG spectra were analyzed over the energy ranges of 0.8–5.0 keV and 1.2–9.0 keV respectively. Below 0.8 keV, the signal to noise of the MEG data was low due to the build up of contamination over time on the ACIS-S CCDs and was excluded from the subsequent fitting. A cross normalization constant between the MEG and HEG spectra has been included in all the subsequent fits, however in each case it is consistent with 1.0. Note the overall fluxes, obtained against an absorbed power-law, correspond toF0.5−2 keV = 1.1 × 10⁻¹¹erg cm−2s−1and
F2−10 keV = 3.7 × 10⁻¹¹erg cm−2s−1 respectively.
The C-statistic (Cash 1979) was employed in the subsequent spectral fits to the HETG, as although an overall large number of counts were obtained in the observations, towards the lower energy (longer wave-length) end of each grating spectrum the total source counts per bin drops below N < 20 in some of the
spectral bins, which is also true at the centroids of the deepest absorption lines in the spectrum. In the case ofχ2 minimization, this would lead to the continuum level being somewhat underestimated at soft X-ray energies. All fit parameters are given in the rest frame of the quasar at z = 0.016652 and are stated in
energy units, adopting the conversion factor of 1 keV being equivalent to 12.3984 ˚A in wavelength. In all of the fits, a Galactic absorption of hydrogen column density ofNH= 6.7 × 1020cm−2(Kalberla et al. 2005) was adopted, modeled with the “Tuebingen–Boulder” absorption model (TBABSinXSPEC), see Wilms et al. (2000) and references therein for the cross–sections and abundances used in this model. Note that upon in-cluding molecular hydrogen, the Galactic column rises toNH= 8.84 × 1020cm−2, e.g. see Willingale et al. (2013), although the spectra above 0.8 keV are not sensitive to the exact value adopted here. Values of
H0= 70 km s−1Mpc−1, andΩΛ0 = 0.73 are assumed throughout and errors are quoted at 90% confidence (∆χ2 = 2.7), for 1 parameter of interest.
3. X-ray Spectral Fitting 3.1. The Overall Spectral Form
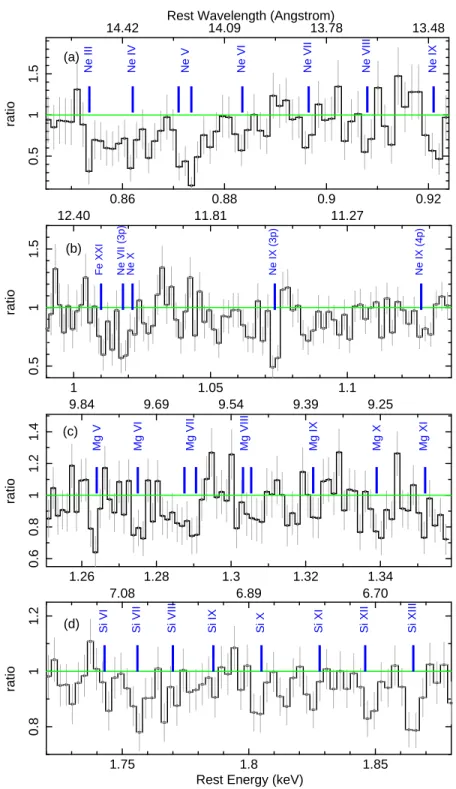
Figure 1 shows the observed HETG spectrum of Mrk 1040, where the spectrum has been unfolded through the instrumental response against a powerlaw model of photon index Γ = 2 in order to
pro-duce a fluxed spectrum inνFν flux units. The spectrum has been plotted at the FWHM spectral resolu-tion and over the wavelength (energy) range from 1.7 ˚A–15.2 ˚A (or 0.82–7.3 keV) and is plotted in wave-length (in the observed frame) to show the overall spectral form. The spectrum shows many clear sig-natures of a warm absorber, with several K-shell absorption lines present from the most abundant ele-ments, where the strongest lines have been identified in the figure panels. Aside from the highly ionized absorption lines from He and H-like ions (e.g. from Ne, Mg and Si, as well as the H-like lines from S and Ar), evidence for lower ionization absorption is also present. This is in the form of inner K-shell (1s → 2p) absorption lines from ions corresponding to charge states from Li to F-like (i.e. where the
L-shell is partially occupied), see Behar & Netzer (2002). These can be seen in the spectrum via ab-sorption lines from charge states varying from:- NeIII-VIII (14.0–14.8 ˚A observed frame), MgV-IX (9.5-10.0 ˚A) and from SiVI-XII (6.8–7.2 ˚A). The most prominent of these lines appear from NeV (C-like Ne) and MgVIII(B-like Mg). This suggests that the warm absorbing gas covers a wide range of ionization, as
has been observed in other Seyfert 1 galaxies, e.g. NGC 3783: (Kaspi et al. 2000, 2001; Krongold et al. 2003), NGC 5548: (Kaastra et al. 2002; Andrade-Vel´azquez et al. 2010), Mrk 509: (Yaqoob et al. 2003; Smith et al. 2007), NGC 7469: (Blustin et al. 2007), IC 4329A: (Steenbrugge et al. 2005a), NGC 3516: (Holczer & Behar 2012), MCG-6-30-15: (Lee et al. 2001; Turner et al. 2004), Mrk 279: (Costantini et al. 2007).
Note that we do not detect absorption due to either the low ionization ions of iron, i.e. in the form of the iron M-shell Unresolved Transition Array (FeI-XVII UTA, Sako et al. 2001; Behar et al. 2001), or due to Oxygen (Gu et al. 2005), as these fall below 0.8 keV where the effective area of the HETG drops rapidly. However the study of the absorption from these lower energies features will be presented in paper II covering the soft X-ray RGS spectrum.
3.2. Absorption Lines in the HETG Spectrum
In order to measure the absorption line properties, an initial parameterization of the continuum was adopted. The continuum emission was modified by a powerlaw absorbed by the Galactic column and a neutral partial covering absorber was also included (using theXSPEC modelZPCFABS), whereby a fraction
fcov of the primary X-ray continuum passes through the absorber. This simple model is adopted purely to account for the spectral curvature (decrease in flux) towards lower energies due to bound-free absorption, but without accounting for any discrete absorption lines. A full description of the photoionization modeling of the spectrum which accounts for both the absorption lines present and the spectral curvature is given in Section 4 and its effect on the overall spectrum is shown later in Figure 8. The photon index of the powerlaw was found to beΓ = 1.75 ± 0.02, while the column of the partial covering absorber was found to
beNH = 4.0+0.9−0.3×1021cm−2 with a line of sight covering fraction offcov > 0.92, i.e. consistent with a fully covering absorber.
While this simple partial covering model is successful in reproducing the spectral curvature, the overall fit is poor, with a fit statistic ofC/ν = 2592.7/2262 (where ν is the number of degrees of freedom) which
is rejected at> 99.99% confidence. The residuals to this continuum model in the Ne, Mg and Si bands to
the MEG spectrum are shown in Figure 2, while the equivalent residuals in the Mg and Si bands to the HEG spectrum are shown in Figure 3. Indeed a wealth of absorption line structure is clearly present in the HETG spectrum (independently in both the MEG and HEG gratings) against the continuum model, especially at energies below 2 keV in the Ne, Mg and Si bands. As expected from the initial broad-band spectrum, low ionization gas appears to be present in the form of a multitude of inner K-shell lines of Ne, Mg and Si. We refer to Behar & Netzer (2002) for a compilation of these inner shell lines and we adopt the known energies (wavelengths) of these lines from this paper later in Table 2. Indeed such lines have been detected in other high signal to noise grating spectra of Seyfert 1 AGN, such as in NGC 3783 (Kaspi et al. 2002; Blustin et al. 2002), NGC 4151 (Kraemer et al. 2005), Mrk 509 (Kaastra et al. 2011b), NGC 3516 (Holczer & Behar 2012), NGC 4051 (Lobban et al. 2011), NGC 5548 (Steenbrugge et al. 2005b), MR 2251-178 (Reeves et al. 2013) and MCG -6-30-15 (Holczer et al. 2010) among others.
In the Ne band of the Mrk 1040 MEG spectrum, residuals due to inner-shell absorption lines due to NeIII-VII (O-like Ne through to Be-like Ne) are present from 0.85-0.90 keV (13.8 ˚A-14.6 ˚A). In addition at higher energies absorption from He and H-like Ne are also present, in particular the He-like line series shows absorption from1s → 2p up to 1s → 4p (see Figure 2, panels a and b). This indicates the absorber
Likewise, the spectrum in the Mg and Si K-shell bands shows similar characteristics. Inner-shell lines from MgV-IX (O-like through to Be-like ions) are apparent from 1.26 − 1.32 keV (9.4–9.8 ˚A). Similarly, inner shell absorption is also detected from SiVI-XII(F-like to Li-like) around 1.74–1.85 keV (6.7–7.1 ˚A). Most
of the lines are also independently detected in the HEG (Figure 3) as well as the MEG (Figure 2) spectra. Absorption from the resonance (1s → 2p) He-like lines of Mg and Si are also detected (as well as the H-like
absorption for MgXII), which again confirms that ions from a wide range of charge states are present in the Mrk 1040 absorber.
3.3. Velocity Profiles
We then constructed velocity profiles of the principle absorption lines listed in Table 2. We restricted the analysis to those lines which are detected at at least 95% confidence (corresponding to∆C = 6.0 for 2
interesting parameters), noting that most of the lines are detected at least at this level in both gratings (with the exception of the Ne band as noted below). A baseline continuum consisting of an absorbed power-law was used, utilizing the neutral partial covering model described in the previous section, as this accounts for the broad-band spectral curvature without imparting any discrete absorption lines upon the spectrum. The lines were then fitted with Gaussian profiles in the rest energy frame, allowing their centroid energies, widths and normalisations to vary and accounting for the spectral resolution via the standard instrument responses. To maximize the resolution, HWHM binning was used and we utilized the highest resolution HEG data for the Mg and Si bands (and above), except for the Ne band where the MEG is adopted due to the low effective area of the HEG at 1 keV and below. The line profiles were then transposed into velocity space around the known lab frame energy (or wavelength) of each line. In the case where a line profile originates from an unresolved doublet (such as for the H-like lines), we took the weighted mean of the respective lab frame energies to calculate the expected line energy. The doublet corresponding to the MgVIII1s → 2p lines is
resolved by the HEG, so in that case we fitted the two lines separately, obtaining the centroid in velocity space separately for each component, i.e. allowing for the different rest-energies of the two lines.
The results of the line profile fitting are summarized in Table 2, which includes 21 line profiles cov-ering 18 separate ionic species from Ne up to Ar. The absorption profiles arise mainly from the1s → 2p
transitions, except for NeIX and NeX, where the higher order1s → 3p lines are detected; indeed in these
latter cases the He-β and Ly-β profiles provide better constraints on the line widths and velocity centroids,
as they are free from contamination from other lines. It is also apparent from inspecting the measured energy centroids in Table 2 that most of the lines are positioned close to their expected lab frame energies, while generally the absorption lines are unresolved (or only marginally resolved), with typical velocity widths of
σ < 300 km s−1(or evenσ < 100 km s−1 in the more tightly constrained cases).
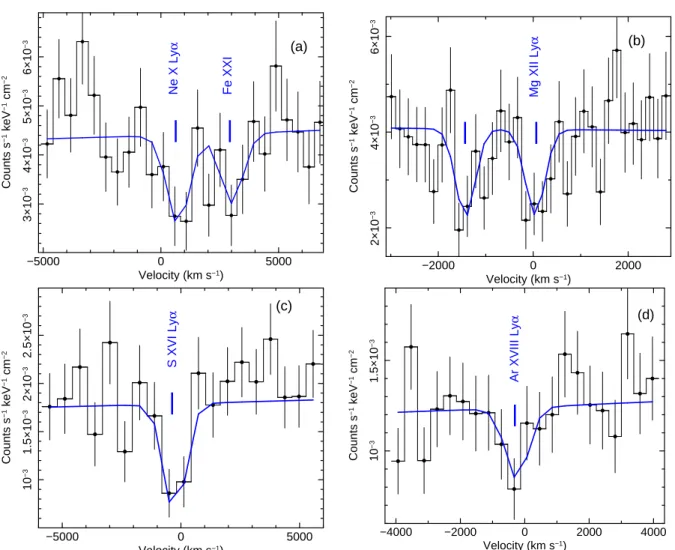
Examples of some of the velocity profiles are plotted in Figure 4 (for the inner-shell and He-like res-onance lines) and in Figure 5 (for the H-like lines). In all of the examples, the line centroids are consistent with zero velocity shift within the measurement errors. While it may appear that some of the profiles contain an additional higher velocity component (either red or blue-shifted) with respect to the main line centroids,
these are due to the presence of nearby lines from adjacent ions as labelled in Figures 4 and 5. For example the strong NeV absorption profile shows weak absorption components at ±4000 km s−1; these are simply due to neighbouring absorption lines from NeIVand NeVIeither side of NeV with no velocity shift. This
is also the case for the SiVIIIand SiXIIIprofiles, e.g. the latter He-like profile contains a weak contribution from SiXII (Li-like Si) on the red-side of the profile. The velocity widths of these profiles are generally
low or unresolved, only NeVis significantly broadened (withσ = 490 ± 200 km s−1). However this may be a result of the line being an unresolved doublet (Behar & Netzer 2002), or from this deep line becom-ing saturated in its core (as the flux reaches close to zero at the center). In contrast the He-like profiles of NeIX (He-β) and MgXI (neither of which are doublets, saturated, or contaminated by other lines) are only marginally resolved, with widths ofσ = 225+140−100km s−1 andσ = 150+110−95 km s−1, respectively. The MgVIIIprofile is clearly resolved in the HEG data into a doublet, although the velocity shifts and widths of
both components are consistent with zero (e.g. σ < 100 km s−1).
A similar story emerges for the H-like (Lyman-α) profiles, as shown in Figure 5 for NeX, MgXI, SXVI and ArXVIII (note SiXIV falls just below the detection threshold). The NeX Ly-α profile is
heav-ily contaminated by2p → 3d absorption by FeXXIand thus the velocity constraints listed in Table 2 are
instead obtained from NeX Ly-β. The highly ionized SXVI and ArXVIII profiles are both unresolved and their velocity centroids are consistent with zero. Only the MgXII profile contains some indication of blueshift. Although the main centroid is consistent with zero velocity, a second velocity component emerges at −1500 km s−1 which appears uncontaminated by other lines (note that the separation of the MgXII dou-blet cannot account for this as it is too small to be resolved by the HEG). However upon inspecting the MEG data for consistency, no such blueshifted component was confirmed, nor is such a component detected in any of the other high ionization He or H-like lines. Even though this component appears formally significant at the ∼99% level (∆C = 10.6), as no high velocity component was measured in any of the other profiles
we do not consider this detection to be plausible.
Overall none of the individual profiles, low ionization as well as high ionization (He and H-like), appear to show a significant outflowing component and most of the lines are unresolved within the instrumental resolution. To determine if the absorption profiles as a whole are characterized by a small velocity shift, which is within the statistical error of any individual profile, the mean and dispersion of the velocity shifts of the sample of lines was calculated based on the values reported in Table 2. Only one value was considered for each ionic species, taking the best determined values in the three cases where multiple measurements exist for a given ion (e.g. the NeX1s → 3p line was favored over the 1s → 2p line). Over 18 ions, the mean
velocity shift was found to be< vout >= 0 ± 40 km s−1, with a dispersion ofσv = 180 km s−1. Neither was any trend or deviation found between outflow velocity and rest energy. Thus no outflow (or inflow) is required to within ±40 km s−1 of the systemic velocity of Mrk 1040, within the absolute wavelength calibration of the HETG gratings. Thus unlike for many other AGN, the Mrk 1040 warm absorber does not appear to originate from an outflow, at least to within very tight limits. In the next section we return to model the absorption with photoionization models generated byXSTAR.
3.4. Emission Lines
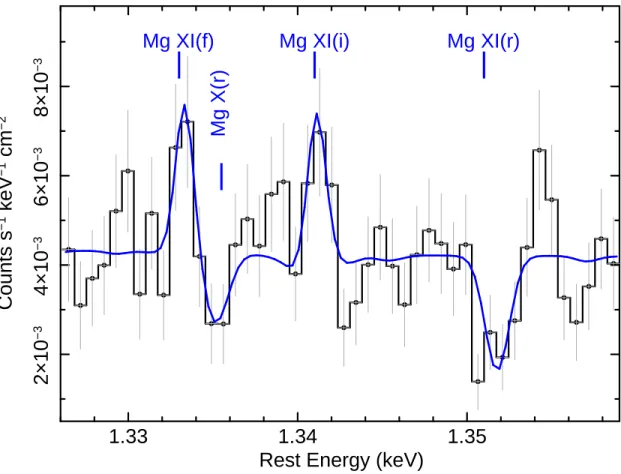
In contrast to the absorption lines, there are a paucity of soft X-ray emission lines in the HETG spectrum against the bright X-ray continuum. The emission lines which are detected in the spectrum are listed in Table 3. In the soft X-ray band the most significant emission residuals occur around the MgXItriplet, at the expected positions of the forbidden and intercombination transitions, while an absorption line is present at the resonance line energy as is shown in Figure 6 for the HEG data. Both emission lines are relatively weak (equivalent width of1.1 ± 0.7 eV) and appear unresolved, with an upper limit to their velocity widths of σ < 135 km s−1.
The relatively equal contribution of the forbidden and intercombination components appears surprising at first, as this would imply a relatively low ratio of theR value between the two lines (R = z/(x + y), see
Porquet & Dubau 2000) and subsequently a high density ofne∼1013cm−3. However given the large errors on the line normalizations it is not possible to constrain the line ratio and the derived density is also formally consistent with a lower density photoionized plasma, wherene< 1012cm−3. Furthermore a relatively high UV radiation field may also suppress the forbidden line, via photoexcitation (Porquet et al. 2010), making the direct measurement of the density from the triplet lines less certain. Furthermore the forbidden line may also be absorbed on its blue-wing due to the adjacent MgXresonance absorption line (see Figure 6). Note that no other line emission is detected from the other triplets, e.g. as the S/N is too low around NeIX, while the only other soft X-ray line which is marginally detected arises from SiXIV Lyman-α at 2.0 keV, which
again is unresolved.
3.4.1. The Iron K-shell band
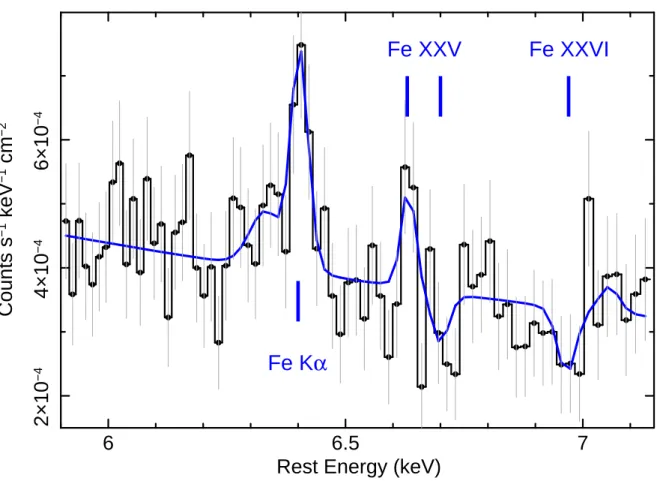
The strongest signal present in the iron K-shell band arises from the almost ubiquitous narrow Fe Kα
emission line (Nandra et al. 2007); the iron K band spectrum is plotted in Figure 7. The line is detected at
6403+12−8 eV and thus is at the expected energy for near neutral iron. The equivalent width of the narrow Fe Kα line is 44+17−12eV. The line is unresolved, with a formal upper-limit to its width of σ < 28 eV or σ < 1310 km s−1 in velocity space. This appears consistent with an origin in distant (e.g. pc scale) gas, which is often found to be case from Fe Kα line cores seen in other type I Seyferts as measured by Chandra
HETG (Shu et al. 2010). Note there is some indication of an excess red-wards of the line core, this is consistent with the presence of a Compton shoulder to the line (George & Fabian 1991) with an energy of
E = 6.33+0.03−0.07keV; however formally the Compton shoulder is not detected (∆C = 4.3) and neither is
it well constrained. Aside from the possibility of a weak Compton shoulder, there is no evidence for any additional excess emission on the red-wing of the line, which may be expected to arise from a broad line from the inner accretion disk. The presence (or lack thereof) of any relativistic line component in Mrk 1040 will be discussed in a forthcoming paper.
Aside from the neutral Kα emission, there is some evidence (at ∆C = 6.3) for the presence of ionized
emission exactly coincident with the expected position of the forbidden line from He-like Fe (FeXXV).
with the known energy of the forbidden component and the line width appears narrow withσ < 14 eV (or
equivalently σ < 630 km s−1). Thus its origin likely arises from distant photoionized material, as per the soft X-ray line emitting and absorbing gas. Note that the residuals at the expected position of the resonance absorption lines from FeXXVand FeXXVI(6.70 keV and 6.97 keV) are not formally significant in their own right (∆C = 4.4 and ∆C = 3.7 respectively), however in the next section we will place a formal limit on
any high ionization absorption component arising from Mrk 1040.
Finally in order to determine whether the observed narrow iron Kα emission is consistent with an origin
in scattering off distant Compton thick matter, we instead modeled with spectrum with either a neutral or an ionized Compton reflection component in addition to the underlying power-law continuum. An excellent fit (C/ν = 565.2/512 over the 2–8 keV band) was found from modeling the line with a neutral reflection
component, adopting the PEXMON model (Nandra et al. 2007) within XSPEC, which returned a reflection fraction ofR = 0.30+0.06−0.12 for an assumed inclination angle ofθ = 45 degrees and Solar abundances. Note
that the photon index of the underlying continuum wasΓ = 1.79+0.07−0.04. A statistically equivalent fit was also obtained with an ionized reflection model, using the (angle averaged) tabulatedXILLVER model spectra of Garc´ıa & Kallman (2010) and Garc´ıa et al. (2013), where the upper-limit on the ionization parameter was found to belog ξ < 0.1, with a consistent photon index of Γ = 1.88+0.05−0.08. Indeed the spectrum fitted with this model is shown in Figure 7. Thus the Fe Kα emission appears consistent with an origin from distant,
Compton thick matter and no additional velocity broadening is required to account for this band.
4. Photoionization Modeling of the X-ray Absorption Spectrum 4.1. Photoionization Models
Given the substantial presence of partially ionized gas in the X-ray spectrum of Mrk 1040, we at-tempted to model the absorption spectrum with photoionized grids of models using the XSTARcode v2.2 (Kallman et al. 2004). Absorption grids were generated in the form of XSPEC multiplicative tables. The absorption spectra within each grid were computed between 0.1–20 keV withN = 10000 spectral bins. The
photoionizing X-ray continuum between 1–1000 Rydberg was assumed to be a broken power-law, with a photon index ofΓ = 2.5 below a break energy of 0.8 keV (at the low energy end of the HETG bandpass)
and with a photon index ofΓ = 2 assumed above this break energy. The 1–1000 Rydberg photoionizing
luminosity is predicted to beLion ∼2 × 1044erg s−1 for Mrk 1040 using this continuum model. Although the power-law break is not required to model the continuum in the HETG data, which is not sensitive to the lowest energies, it is required by the subsequent XMM-Newton spectra (both for the pn and RGS, paper II) to account for the soft X-ray excess in this source. Furthermore, as will be discussed in Section 4.3, a softer photoionizing continuum is required to model the numerous low ionization inner-shell absorption lines in the spectrum, which otherwise are over ionized by a flatterΓ = 2 continuum.
With this choice of continuum, we then generated an initial broad grid of models that covered a wide range in ionization and column density:- from NH = 1 × 1018cm−2 toNH = 3 × 1024cm−2 and
log(ξ/erg cm s−1) = 0 − 51 in logarithmic steps of∆(log N
H) = 0.5 and ∆(log ξ) = 0.5 respectively. This broad grid was used to provide an initial characterization of the warm absorber zones (i.e. to provide a first order estimate of the range of ionization and column needed to account for the absorption) and to account for any high ionization absorption components. A more finely tuned grid (covering a narrower range of parameters) was subsequently generated with the specific purpose of modeling the low ionization absorption in the Mrk 1040 spectrum, especially the inner-shell lines. The column density of this narrow low ionization grid covered the range fromNH= 0.5 − 5.0 × 1021cm−2in steps of∆NH= 1 × 1020cm−2, with the ionization range extending fromlog(ξ/erg cm s−1) = −1 − 3 in 20 steps of ∆(log ξ) = 0.2. A fine spectral resolution ofN = 105points over an energy range of0.1 − 20 keV was also employed. Given the narrow (or unresolved) widths of the absorption lines detected in the Chandra HETG spectrum, a turbulence velocity2 ofb = 100 km s−1 was assumed for the absorption models; grids with much higher turbulences all gave substantially worse fits in the models considered below. Solar abundances were adopted for all the abundant elements, using the values of Grevesse & Sauval (1998), except for Ni which is set to zero (the default option withinXSTAR).
4.2. Warm Absorber fits to the Mrk 1040 Chandra HETG spectrum
In order to model the absorption spectrum we successively added individual components of absorbing gas, fully covering the line of sight to the source, until the fit statistic was no longer improved at the 99% confidence level (∆C = 9.2 for 2 parameters) and no obvious residuals remained after fitting the spectrum.
To fit the continuum itself we adopted the broken powerlaw form as described above, with the break energy fixed at 0.8 keV and the photon index below the break also fixed atΓ = 2.5 (as the Chandra data are not
sensitive to the slope of the soft excess). Note that the above choice of the continuum is consistent with the later XMM-Newton observation, where the low energy soft excess is required. Above the break energy the photon index was allowed to vary, along with the overall normalization of the continuum. After adding the required absorption zones as described below, the photon index was found to beΓ = 1.78 ± 0.02, while
after correcting for the absorption, the intrinsic luminosity of Mrk 1040 wasL2−10 = 2.4 × 1043erg s−1and
L1−1000 Ryd= 1.8 × 1044erg s−1 over the 2–10 keV and 1–1000 Rydberg bands respectively. The emission
lines were also added to the model as Gaussians, as described in Section 3.4; these arise from the MgXI
triplet, from the Fe Kα and FeXXVcomponents of the iron K band emission and a weak emission line from SiXIVLyman-α (see Table 3).
Three components of absorbing gas are formally required in the Chandra model to account for the soft X-ray absorption, which are listed as zones 1–3 in Table 4. The finely tuned grid of absorption models was used for all three soft X-ray zones. A fourth highly ionized absorption zone was also added to the
1
The ionization parameter is defined asξ = Lion/nR2 (Tarter et al. 1969), whereLion is the1 − 1000 Rydberg ionizing luminosity,n is the electron density and R is the distance of the ionizing source from the absorbing clouds. The units of ξ are
erg cm s−1.
model (zone 4, Table 4), using the coarse grid covering a broader range of column and ionization. However compared to the soft X-ray zones 1–3, this high ionization zone is only marginally significant (∆C = 11.0)
and mainly contributes by adding the weak absorption lines due to FeXXVand FeXXVI(see Section 3.4.1
and Figure 7). Overall with all the zones of absorption applied to the continuum, the fit to the Chandra spectrum is very good, with a final fit statistic ofC/ν = 2374.0/2252 and a corresponding null hypothesis
probability ofPf = 0.16. In comparison the fit with the simple neutral partial covering model yielded a substantially worse fit withC/ν = 2592.7/2262 (as this model only accounts for the continuum curvature
but not the line absorption), while a fit without any absorption zones applied to the continuum (aside from the Galactic column) is extremely poor withC/ν = 3508.3/2264. Indeed the effect of the warm absorber
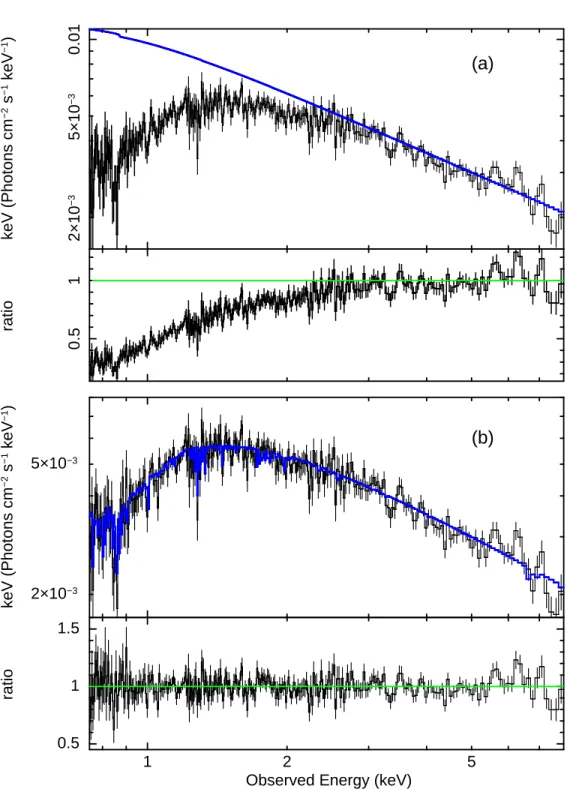
upon the overall spectrum is illustrated in Figure 8. Here the top panel shows the spectrum fitted with just a power-law continuum (withΓ = 1.78) above 3 keV, where the pronounced spectral curvature due to the
warm absorber is apparent towards lower energies. Once the warm absorber is applied to the spectral model, then the continuum curvature is clearly accounted for by the absorbing gas (see Figure 8b).
Overall the three soft X-ray warm absorber zones 1–3 that are required to model the Chandra spectrum cover the range in column from NH = 1.5 − 4.0 × 1021cm−2 and ionization from log ξ = 0 − 2 (see Table 4 for detailed parameters), where the lowest ionization zone 1 (log ξ = 0) has the highest column. As
is expected from the velocity profile analysis (Section 3.3), the outflow velocities of the absorption zones are very low and are typically consistent within ±100 km s−1 of the systemic velocity of Mrk 1040. While the lowest ionization zone 1 hints at some mild outflow (withvout = −150+105−100km s−1), this is not supported by either zones 2 or 3; e.g. zone 2 is consistent with zero (vout = +10+80−90km s−1) and zone 3 suggests very mild inflow (withvout = +130+70−60km s−1). However any slight difference in velocities between the zones are likely to be within the scatter of the measurements. Indeed even the highly ionized zone 4 (where
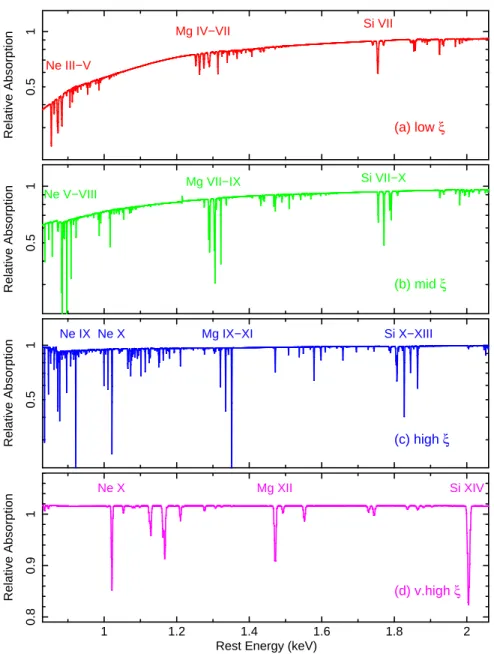
log ξ = 3.7) shows no evidence for outflow, with a formal limit on the outflow velocity of < 80 km s−1. Figure 9 shows the relative contributions of each of the warm absorber components against a power-law continuum. The two lower ionization zones 1 and 2, withlog ξ = 0 and log ξ = 1 respectively (top and
middle panels), contribute to the lower ionization ions, reproducing the inner-shell lines of Ne, Mg and Si as seen in the spectrum below 2 keV. Most of the bound-free spectral curvature is also imparted upon the spectrum by these two zones, with the lowest ionization zone 1 having the greater opacity towards lower energies. The higher ionization zone 3 (with log ξ = 2.1) mainly produces the He and H-like absorption
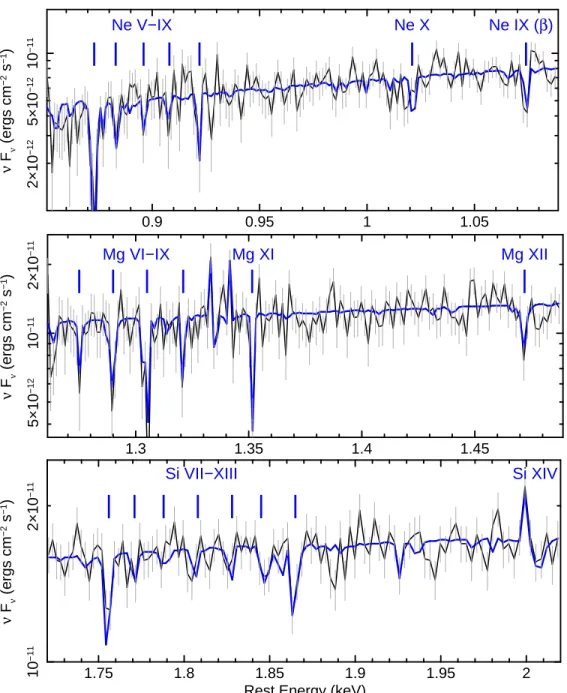
lines from Ne, Mg and Si, while the very highly ionized zone 4 is essentially transparent at soft X-rays and only makes a weak contribution to some of the H-like lines. The superposition of these zones is then able to model the absorption line structure seen in the Chandra spectrum, where Figure 10 shows the best-fit model over the 0.8-2 keV band covering the major absorption lines from Ne, Mg and Si. Indeed theXSTARmodel
is able to account for the wide range of charge states present, e.g. reproducing the series of absorption lines observed from NeV-X, MgVI-XIIand SiVII-XIII, while simultaneously being able to model for the convex shape of the overall X-ray spectrum.
The broad, and relatively flat distribution ofNH with ξ seen in Table 4 is commensurate with other slow Seyfert outflows; see Behar (2009) where this was parametrized asNH ∝ ξa. Here the value of a corresponds to a density profile ofn ∝ r−α, whereα = (1 + 2a)/(1 + a). Formally, the values in Table 4
(for zones 1–3) yielda = −0.2 ± 0.1 and hence α = 0.8 ± 0.2. Such a flat distribution can be explained
by an MHD outflow withn ∝ r−1(Fukumura et al. 2010), but also with a Radiation-Pressure Compressed (RPC) cloud (Stern et al. 2014). The MHD wind models predict a well-defined line-of-sight outflow velocity structure ofv ∝ r−1/2, that for a flat ionization distribution impliesv ∝ ξ1/2that is not quite observed here. The RPC models do not solve for the kinematic structure of the outflow and assume the entire absorber is cruising uniformly at the same velocity (that does not need to be specified for the ionization distribution to be flat). The latter appears to be the case for the absorber of Mrk 1040. Clearly, the broad distribution ofNH withξ is not consistent with a simple radial outflow of n ∝ r−2, which would naturally produce a narrow distribution of ionization.
4.3. The Effect of the Ionizing SED on the Absorber
As discussed above, the shape of the illuminating SED from 1–1000 Ryd may effect the properties of the X-ray absorber via the ionization balance. Here we adopted a broken powerlaw for the SED, with a steep spectrum below ∼ 1 keV, motivated by the need to model the lower ionization lines of Ne, Mg and
Si in particular. These inner shell ions have relatively low ionization potentials for their L-shell electrons, e.g. 266 eV for MgVIIIand 126 eV for NeV; both of the ions produce notable absorption in the spectra as is shown in Figures 2 and 3. The low ionization potentials of these ions suggest that the form of the EUV and soft X-ray continuum may have an effect on the warm absorber modeling.
In comparison we also tested the effect of a flat Γ = 2 continuum on the absorber properties, by
replacing the above grids of models with their equivalent versions with the flat SED shape and subsequently minimizing the new spectral fit. In this case the 1–1000 Rydberg ionizing luminosity is a factor of 3 lower than for the broken power-law case (5.6 × 1043erg s−1vs. 1.8 × 1044erg s−1). The effect of the flat SED on the subsequent warm absorber modeling is quite apparent, which is illustrated in Figure 11 in the Ne and Mg K-shell bands. The flat SED model clearly underpredicts the inner shell absorption from MgV-IX
and NeV-VIII, presumably due to the lower luminosity in the EUV to soft X-ray range and as an excess of such photons above the X-ray powerlaw is needed to excite these L-shell electrons. On the other hand, both models are able to account for the higher ionization absorption lines from He and H-like ions, as these are more sensitive to the hard powerlaw part of the continuum above 1 keV than the soft excess. Overall the fit with the flat SED model is significantly worse than the softer broken powerlaw SED model, with
C/ν = 2452.6/2252 vs. C/ν = 2374.0/2252 respectively; here the difference in fit statistic arises from
the inability of the former model to account for the lower ionization absorption lines. This demonstrates that the low ionization warm absorber is particularly sensitive to the form of the ionizing continuum in the lowest energy band; this has been found to be the case for the QSOs, MR 2251-178 (Reeves et al. 2013) and IRAS 13349+2438 (Laha et al. 2013).
Thus potentially the properties of the warm absorber may make it possible to deduce the nature of the soft X-ray continuum and especially the soft excess in AGN. While this is unlikely to be the result of the direct thermal emission from the accretion disk (Gierli´nski & Done 2004), some authors have suggested that
the origin of the soft excess was atomic and may instead arise from an ionized reflector. An ionized reflection spectrum (Ross & Fabian 2005), when convolved with the relativistic blurring expected in the innermost disk a few gravitational radii from the black hole, can produce an overall smooth continuum capabale of fitting the featureless soft excess below 1 keV (Crummy et al. 2006; Walton et al. 2013). Alternatively, Comptonization of UV disk photons in a warm, optically thick, accretion disk atmosphere (Done et al. 2012; R ´o˙za´nska et al. 2015) has also proven to be a plausible form for the EUV to soft X-ray excess in many AGN (Jin et al. 2012; Petrucci et al. 2013; Matt et al. 2014). In Mrk 1040, the warm absorber modeling favors a steep (Γ > 2) continuum from the EUV to soft X-rays. This might imply that the soft excess is part of
the intrinsic continuum in this AGN and may be produced through disk Comptonization, rather than arising from reprocessed or reflected emission, as is also likely to be the case in MR 2251-178 (Nardini et al. 2014).
5. Discussion
5.1. Main observational results
We have presented the first high resolution X-ray spectrum of the nearby, X-ray bright, Seyfert 1 galaxy, Markarian 1040. The Chandra HETG observations reveal a spectrum showing a wealth of spectral features from the warm absorber, which covers a wide range in ionization; e.g. from lowly ionized O-like ions up to highly ionized He/H-like like species. The warm absorber parameters for this AGN, with column density in the range from(1.5 < NH < 4.0) × 1021cm−2 and0 < log ξ < 2.1, are fairly typical for most nearby Seyfert galaxies (Crenshaw et al. 2003; Blustin et al. 2005; McKernan et al. 2007), although at the lower range in ionization. Perhaps the most surprising discovery is the low (or zero) velocity of the gas, consistent within ±100 km s−1 of the systemic velocity of Mrk 1040. Thus unlike the majority of Seyfert 1 galaxies, whereby the warm absorbing X-ray gas is clearly ascribed to an outflow, the warm absorber in Mrk 1040 either does not appear to be associated with an outflow, or instead any wind is not able to accelerate out to sufficient distances from the nucleus.
Indeed the velocities of most X-ray warm absorber components typically fall in the range from 0 up to −2000 km s−1(Blustin et al. 2005; McKernan et al. 2007; Laha et al. 2014), while the UV velocity com-ponents can also cover a similar range of velocity as seen in X-rays (Crenshaw & Kraemer 2012). Typical outflow velocities of a few hundred km s−1 are also seen for the soft X-ray absorber in many well studied cases; e.g. NGC 3783 (Kaspi et al. 2002), Mrk 509 (Kaastra et al. 2011b; Detmers et al. 2011). Furthermore, Seyfert 1 AGN often show multiple velocity components in the X-ray band, as is also commonly observed in the UV. For example in an analysis of a deep observation of MCG –6-30-15 observed with Chandra HETG, Holczer et al. (2010) detect a low velocity absorber withvout = −100 ± 50 km s−1, while a higher velocity absorber emerges withvout = −1900 ± 150 km s−1only in the highest ionization component of the warm absorber. In this case, this was directly seen in some of the H-like lines (e.g. MgXIIand SiXIV), where the high velocity component was revealed in the blue-wing of the velocity profiles for these lines. While the lower velocity component of the warm absorber in MCG –6-30-15 appears very similar to what is observed here (with a wealth of inner K-shell and UTA absorption present), no high velocity component of the high
ionization lines is seen in Mrk 1040 (e.g. see the velocity profiles in Figures 4 and 5).
The higher ionization zone 3 warm absorber in Mrk 1040 (see Table 4) shows no evidence of outflow (vout = +130+70−60km s−1), while the highest ionization zone 4 (mainly arising from the weak contribution of He and H-like iron) has an upper limit of< 80 km s−1 to the outflow velocity. This is in contrast to the warm absorbers seen in many other Seyferts, where higher velocity zones can emerge in the higher ionization gas. For instance in NGC 3516, fast outflowing zones of up to −4000 km s−1were present when the AGN continuum brightened (Turner et al. 2008; Holczer & Behar 2012), which in this case may have coincided with the emergence (or illumination) of an inner disk wind component to the absorber. Similarly in NGC 4051, both high (several thousand km s−1) and low velocity (several hundred km s−1) warm absorbing zones appear to be present (Steenbrugge et al. 2009; Lobban et al. 2011; Pounds & Vaughan 2011), while in NGC 5548 the onset of a high velocity (BAL-like) component of the UV and X-ray absorber was also recently revealed in during an absorption episode (Kaastra et al. 2014).
Thus Mrk 1040 appears curious in that there is no evidence for the X-ray warm absorber to be out-flowing, either through a slow component (withvout > 100 km s−1) or a faster higher ionization zone (with
vout> 1000 km s−1), at least on the basis of the X-ray spectra from the present epoch of observations. Both the low velocity and ionization of the absorber in Mrk 1040 likely places the gas at large distances from the black hole, as we will show below. This is far removed from some of the high velocity and high ionization components of the warm absorber discussed above, which may instead originate from an accretion disk wind on sub-parsec scales (e.g. Tombesi et al. 2013) and some of which are powerful enough to drive gas out to kpc scales (Tombesi et al. 2015; Feruglio et al. 2015).
5.2. The Properties and Location of the Warm Absorber in Mrk 1040
The best physical constraints on the absorbing gas in Mrk 1040 arise from the zone 3 absorber (see Table 4), as this zone is also associated with the He-like emission from the Mg triplet, which makes it possible to calculate the covering fraction of the gas as well as its radial location. Photoionized emission spectra, in the form of an additive table of models (or an atable within XSPEC) were also generated with
XSTAR, with the same properties as the zone 3 absorber and with the same input continuum and ionization (log ξ = 2.1).
From the photoionization modeling, the normalization (or flux),κ, of an emission component is defined
byXSTAR(Kallman et al. 2004) in terms of:
κ = f L38 D2
kpc
(1)
whereL38is the ionizing luminosity in units of1038erg s−1over the 1–1000 Rydberg band andDkpcis the distance to the AGN in kpc3. Heref is the covering fraction of the gas with respect to the total solid angle,
3
wheref = Ω/4π and thus for a spherical shell of gas, f = 1. For Mrk 1040, where Lion= 1.8×1044erg s−1 andD = 68.7 Mpc (Theureau et al. 2007), then for a spherical shell the expected XSTARnormalization is
κ = 3.8 × 10⁻⁴. Hence for a given column density of gas, this sets the total luminosity of the soft X-ray photoionized emission; also see Reeves et al. (2016) for a similar calculation.
We then applied thisXSTARemission component to the spectrum of Mrk 1040 in order to reproduce the He-like emission from MgXI, which is the strongest emission line present in the spectrum and in particular the forbidden line component. Adopting the above normalization of the emission component, then a column density ofNH = 1.0+0.2−0.5×1021cm−2 is required, in the case where the gas fully covers the X-ray source with a solid angle of 4π steradian. Alternatively if we fix the column density of the emitter to what was
previously measured for the zone 3 absorber (whereNH= 1.5 × 1021cm−2, see Table 4), then a minimum covering fraction off > 0.4 of 4π steradian is required to model the emission.
A lower limit on the radial location of the emission can also be obtained from the upper limit to the velocity width of the line emission. Taking3σ2 = GM/R and with an upper limit for velocity width of the MgXIforbidden emission ofσv < 135 km s−1 (see Table 3), then for an estimated black hole mass of Mrk 1040 of4 × 107M
⊙(Zhou et al. 2010), the location of the emitting gas associated with zone 3 is found to be> 1019cm or> 3 pc.
A typical limit to the radial location of the absorber can be derived from the definition of the ionization parameter and the requirement that the thickness of the absorber does not exceed its distance to the super-massive black hole, i.e.,NH ≃nH∆R < nHR. Then from the definition of the ionization parameter, this
yields:-rmax≡(Lion/ξNH)(∆R/R). (2)
Thus for the condition that ∆R/R ∼ 1 and for the measured zone 3 absorber parameters of log ξ = 2.1, NH = 1.5 × 1021cm−2 and an ionizing luminosity ofLion = 1.8 × 1044erg s−1, thenrmax ∼1021cm or
< 300 pc. Note that the location of the gas cannot be much larger than this to satisfy the above geometric
condition, while it can be smaller if∆R/R < 1 or if the gas is clumpy.
For comparison, the expected sizescale of the Narrow Line Region (NLR) can be estimated by the scaling relation of Mor et al.
(2009):-RNLR= 295 × L0.47±0.1346 (pc). (3)
where hereL46is the bolometric luminosity of the AGN in units of 1046erg s−1. If we take the 2-10 keV luminosity to be a typical 3% of the total bolometric luminosity of Mrk 1040, thenLbol ∼7 × 1044erg s−1 and the estimated distance of the optical NLR would beRNLR∼100 pc, consistent with the above minimum and maximum estimates for the radial distance of the ionized gas (of3 pc < R < 300 pc). If the ionized
X-ray gas is extended on distances of up to ∼ 300 pc, then the density of the gas is low, of the order n ∼ 1 cm−3for a column density ofNH= 1021cm−2. This may be expected for large scale gas associated with an extended NLR region. Note the distance scale of up to 300 pc is consistent with archival HST images (Schmitt et al. 2003), which show extended [OIII] emission within ±1′′of the nucleus (see Section 5.3).
We can place upper-limits to the mass outflow rate ( ˙M ), which in the quasi-spherical case is given by ˙
M = f 4πNHRvoutµmp, where f is the gas covering fraction and µ ∼ 1.2 is the average particle mass relative to H. From the observations,NH= 1.5 × 1021cm−2, the covering fraction (as estimated from the emission) isf ∼ 0.4, while we adopt a likely upper-limit to the outflow velocity of vout < 100 km s−1. Thus for the most likely range in the radial location (R) of the absorber, i.e. from 3 pc to 300 pc as above,
then the limits on the mass outflow rate are ˙M < 0.02 M⊙yr−1 and ˙M < 2 M⊙yr−1 respectively. Even for the most conservative upper-limit of ˙M < 2 M⊙yr−1, then the corresponding upper-limit to the kinetic power of the outflow is very low withLK< 1040erg s−1.
Similar constraints can be placed on the other absorber zones. Given the lower ionizations of zones 1 and 2 (Table 4), equation 2 would predict rmax values 1–2 orders of magnitude greater than for the more highly ionized zone 3 discussed above (i.e. on kpc scales). However a moderate clumping of the gas would restrict it to spatial scales consistent with the extended [OIII] emitting gas, which is discussed below. Thus
for the lowest ionization zone 1 (with log ξ = 0), if ∆R/R ∼ 0.02 and for the measured column of NH = 4 × 1021cm−2, then the distance is rmax ∼ 1021cm (∼ 300 pc) and thus the density would be
n ∼ NH/∆R ∼ 200 cm−3. This is typical of the estimated densities for line emitting NLR clouds (Koski 1978). Furthermore, gas with this low ionization (log ξ ∼ 0) will be more than capable of producing [OIII] emission in the optical band. Indeed as will be shown from subsequent XMM-Newton/RGS soft X-ray spectroscopy of Mrk 1040 (paper II), absorption is seen in the O K-shell band covering the full range of charges states; i.e. from OI-VIII, including the strong detection of K-shell absorption from OIII. The latter absorption is also likely to be associated to the low ionization zone 1 gas.
5.3. Imaging and Kinematics of the Nucleus with HST
Interestingly, from the HST imaging of the [OIII] narrow line emitting gas in Mrk 1040 (Schmitt et al. 2003), the NLR appears to be extended on spatial scales of ∼ ±1′′ from the nucleus. This is consistent with the above maximum estimate ofrmax ∼ 300 pc for the warm absorber at the distance of Mrk 1040. Schmitt et al. (2003) report that the [OIII] emission appears bi-conical in structure, with an opening angle of 120◦, with the cone axis approximately perpendicular to the host galaxy disk; the HST Wide Field Planetary Camera 2 (WFPC2) image of Mrk 1040 is reproduced in Figure 12 (left panel) from these observations. Note that no direct evidence is found for extended X-ray emission from the Chandra image of Mrk 1040. However the brightness of the central AGN, the lower spatial resolution of Chandra and the moderate photon pile-up present in the zeroth order image precludes a quantitative comparison with the HST image.
Two HST Space Telescope Imaging Spectrometer (STIS) observations of Mrk 1040 in 2009 were per-formed with the G430M grating, sampling two different position angles through the central part of the galaxy. The details of the observations and of the analysis proceedures are reported by Fischer et al. (2013), who perform imaging and kinematics (primarily in [OIII]) of a sample nearby Seyfert galaxies with HST STIS. Here we show the results obtained in Mrk 1040, in order to compare the location and kinematics of the narrow line region emitting gas with the X-ray warm absorber.
These results are summarized in Figure 12. The two STIS observations give two slit positions through different portions of the galaxy, with slit A along the major axis of the galaxy and slit B approximately perpendicular to this. The positions of the two slits are indicated in the left hand panel of Figure 12, overlaid on the non dispersed WFPC2 image of Mrk 1040 at [OIII]λ5007. The center and right panels of Figure 12
show the resulting kinematics of the [OIII] line components versus position in arcseconds from the AGN
center. These plots indicate that there is evidence for some modest outflow located within ±0.2′′ of the nucleus of Mrk 1040, with outflow velocities of typically −200 km s−1. This blue-shifted component of [OIII] is visible in both of the slit A and B spectra and occurs well within the inner 100 pc of the central AGN. Slit A, positioned along the major axis, also shows extended, blue-shifted [OIII] emission up to 0.5′′ to the southwest of the nucleus and in the direction of the major axis of the galaxy. This emission may be attributed to rotation, if for instance the disk is rotating in a counterclockwise direction and thus the southwest side would appear blue shifted.
5.4. Implications for the X-ray Absorber
Thus the likely distance of the ionized X-ray gas is consistent with the extended emission observed from the optical NLR, as seen in the HST observations. The X-ray kinematics are also broadly consistent with what is seen in HST, where some modest outflow is associated with the nucleus itself of up to −200 km s−1. Indeed for the zone 1 absorber, which is most likely associated to the [OIII] emission, the outflow velocity is −150+105−100km s−1 (see Table 4). The aperture of Chandra HETG is much larger than for the HST STIS and thus given the likely upper limit of< 300 pc to the location of the X-ray absorber, we cannot exclude
either an origin either associated with the weak nuclear outflow located within< 100 pc of the nucleus as
seen in [OIII], or with the somewhat more extended gas associated with the rotating galactic disk, with low
radial velocities. A tighter constraint on the radial distance of the X-ray absorbing gas would be needed to distinguish between these possibilities; this will be discussed further in paper II, where we present evidence for variations in absorber ionization between the different epochs.
One interesting scenario is that we are viewing a failed nuclear wind from Mrk 1040. The accretion rate of Mrk 1040, given its luminosity and likely black hole mass, probably does not exceed 10% of Eddington. With such a weak AGN, it may be difficult to radiatively accelerate gas at distances beyond ∼ 100 pc
(Fischer et al. 2016), although this gas could still be ionized by the AGN. Indeed the stringent upper limit obtained earlier on the outflow kinetic power (LK < 1040erg s−1) implies that this weak wind will leave a minimal kinetic footprint on its host galaxy, while the X-ray outflow velocity is also no larger than the velocity dispersion of the stellar bulge in Mrk 1040 (Nelson & Whittle 1995). The low X-ray velocity may also be in part due to our orientation, if for instance we are viewing Mrk 1040 pole-on compared to a more equatorial wind. The narrowness of the Balmer lines in Mrk 1040 is more likely due to a pole-on view, rather than a high Eddington rate as is usually inferred in more typical NLS1s.
6. Conclusions
This paper has presented a 200 ks Chandra HETG observation of the nearby Seyfert 1, Mrk 1040, which is the first time a high resolution X-ray spectrum of this AGN has been discussed. The spectra show the strong signature of a warm absorber, with the lower ionization gas responsible for the strong series of inner K-shell absorption lines from Ne, Mg and Si, originating from ions with low charge states. Neither the low or high ionization components of the absorber appear to be outflowing, to typically within ±100 km s−1
of the systemic velocity of Mrk 1040. We also find that the lower ionization (inner K shell) absorption lines are best reproduced with a model that requires a steep (Γ = 2.5) photon index below 1 keV. This argues for
an intrinsic origin for the soft X-ray excess from this AGN.
The low ionization and low velocity of the absorber likely places the absorbing gas between ∼3 and ∼300 pc from the black hole and it appears coincident with the optical NLR emitting gas, as seen in [OIII]
in the HST images of this AGN. This is also broadly similar to the soft X-ray absorbers seen towards other Seyfert 1s, which may typically range from a pc scale toroidal wind (Krolik & Kriss 2001; Blustin et al. 2005), to the NLR on scales of several tens to hundreds of parsecs (e.g. Netzer et al. 2003; Behar et al. 2003; Kriss et al. 2011; Kaastra et al. 2012). Finally we suggest that the lack of an X-ray outflow component in Mrk 1040 may be due to a failed nuclear wind in this AGN, with the gas not able to accelerate out to scales beyond ∼100 pc.
7. Acknowledgements
We thank the anonymous referee for their positive and constructive comments. J.N. Reeves acknowl-edges Chandra grant number GO3-14123X, as well as NASA grant numbers NNX16AE11G and NNX15AF12G. T.J. Turner acknowledges NASA grant number NNH13CH63C. Both J.N. Reeves and A. Lobban acknowedge support from STFC, via the consolidated grants ST/M001040/1 and ST/K001000/1. D. Porquet acknowl-edges financial support from the European Union Seventh Framework Program (FP7/2007-2013) under grant agreement number 312789. E. Behar is supported by the the European Unions Horizon 2020 research and innovation programme under the Marie Sklodowska-Curie grant agreement no. 655324 and by the I-CORE program of the Planning and Budgeting Committee (grant number 1937/12). E.N also acknowl-edges funding from the European Unions Horizon 2020 research and innovation programme under the Marie Skodowska-Curie grant agreement No. 664931. TCF was supported by an appointment to the NASA Post-doctoral Program at the NASA Goddard Space Flight Center, administered by Universities Space Research Association under contract with NASA. The scientific results reported in this article are based on obser-vations made by the Chandra X-ray Observatory. This research has made use of software provided by the Chandra X-ray Center (CXC) in the application package CIAO.
REFERENCES Amram, P., Marcelin, M., Bonnarel, F., et al. 1992, A&A, 263, 69
Andrade-Vel´azquez, M., Krongold, Y., Elvis, M., et al. 2010, ApJ, 711, 888 Baumgartner, W. H., Tueller, J., Markwardt, C. B., et al. 2013, ApJS, 207, 19 Behar, E. 2009, ApJ, 703, 1346
Behar, E., Rasmussen, A. P., Blustin, A. J., et al. 2003, ApJ, 598, 232 Behar, E., & Netzer, H. 2002, ApJ, 570, 165
Behar, E., Sako, M., & Kahn, S. M. 2001, ApJ, 563, 497
Blustin, A. J., Branduardi-Raymont, G., Behar, E., et al. 2002, A&A, 392, 453
Blustin, A. J., Page, M. J., Fuerst, S. V., Branduardi-Raymont, G., & Ashton, C. E. 2005, A&A, 431, 111 Blustin, A. J., Kriss, G. A., Holczer, T., et al. 2007, A&A, 466, 107
Braito, V., Reeves, J. N., Dewangan, G. C., et al. 2007, ApJ, 670, 978 Canizares, C. R., Davis, J. E., Dewey, D., et al. 2005, PASP, 117, 1144 Cash, W. 1979, ApJ, 228, 939
Chartas, G., Brandt, W. N., Gallagher, S. C., & Garmire, G. P. 2002, ApJ, 579, 169 Costantini, E., Kaastra, J. S., Arav, N., et al. 2007, A&A, 461, 121
Crenshaw, D. M., Kraemer, S. B., Hutchings, J. B., et al. 2000, AJ, 120, 1731 Crenshaw, D. M., & Kraemer, S. B. 2000, ApJ, 532, L101
Crenshaw, D. M., & Kraemer, S. B. 2001, ApJ, 562, L29
Crenshaw, D. M., Kraemer, S. B., & George, I. M. 2003, ARA&A, 41, 117 Crenshaw, D. M., & Kraemer, S. B. 2012, ApJ, 753, 75
Crummy, J., Fabian, A. C., Gallo, L., & Ross, R. R. 2006, MNRAS, 365, 1067 De Marco, B., Ponti, G., Cappi, M., et al. 2013, MNRAS, 431, 2441
Done, C., Davis, S. W., Jin, C., Blaes, O., & Ward, M. 2012, MNRAS, 420, 1848 Detmers, R. G., Kaastra, J. S., Steenbrugge, K. C., et al. 2011, A&A, 534, A38 de Zotti, G., & Gaskell, C. M. 1985, A&A, 147, 1
Done, C., Davis, S. W., Jin, C., Blaes, O., & Ward, M. 2012, MNRAS, 420, 1848 Ebrero, J., Costantini, E., Kaastra, J. S., et al. 2010, A&A, 520, A36
Feruglio, C., Fiore, F., Carniani, S., et al. 2015, A&A, 583, A99
Fischer, T. C., Crenshaw, D. M., Kraemer, S. B., & Schmitt, H. R. 2013, ApJS, 209, 1 Fischer, T. C., Machuca, C., Diniz, M. R., et al. 2016, ApJ, in press (arXiv:1609.08927) Fruscione, A., McDowell, J. C., Allen, G. E., et al. 2006, Proc. SPIE, 6270, 62701V Fukumura, K., Kazanas, D., Contopoulos, I., & Behar, E. 2010, ApJ, 715, 636 Garc´ıa, J., & Kallman, T. R. 2010, ApJ, 718, 695
Garc´ıa, J., Dauser, T., Reynolds, C. S., et al. 2013, ApJ, 768, 146 George, I. M., Turner, T. J., Netzer, H., et al. 1998, ApJS, 114, 73 George, I. M., & Fabian, A. C. 1991, MNRAS, 249, 352
Gierli´nski, M., & Done, C. 2004, MNRAS, 349, L7
Gofford, J., Reeves, J. N., Tombesi, F., et al. 2013, MNRAS, 430, 60 Grevesse, N., & Sauval, A. J. 1998, ssr, 85, 161
Gu, M. F., Schmidt, M., Beiersdorfer, P., et al. 2005, ApJ, 627, 1066 Holczer, T., & Behar, E. 2012, ApJ, 747, 71
Holczer, T., Behar, E., & Arav, N. 2010, ApJ, 708, 981 Hopkins, P. F., & Elvis, M. 2010, MNRAS, 401, 7
Huchra, J. P., Vogeley, M. S., & Geller, M. J. 1999, ApJS, 121, 287 Jin, C., Ward, M., Done, C., & Gelbord, J. 2012, MNRAS, 420, 1825
Kaastra, J. S., Mewe, R., Liedahl, D. A., Komossa, S., & Brinkman, A. C. 2000, A&A, 354, L83 Kaastra, J. S., Steenbrugge, K. C., Raassen, A. J. J., et al. 2002, A&A, 386, 427
Kaastra, J. S., de Vries, C. P., Steenbrugge, K. C., et al. 2011, A&A, 534, A37 Kaastra, J. S., Detmers, R. G., Mehdipour, M., et al. 2012, A&A, 539, A117 Kaastra, J. S., Kriss, G. A., Cappi, M., et al. 2014, Science, 345, 64
Kallman, T. R., Palmeri, P., Bautista, M. A., Mendoza, C., & Krolik, J. H. 2004, ApJS, 155, 675 Kaspi, S., Brandt, W. N., Netzer, H., et al. 2000, ApJ, 535, L17
Kaspi, S., Brandt, W. N., Netzer, H., et al. 2001, ApJ, 554, 216 Kaspi, S., Brandt, W. N., George, I. M., et al. 2002, ApJ, 574, 643 Koski, A. T. 1978, ApJ, 223, 56
Kraemer, S. B., George, I. M., Crenshaw, D. M., et al. 2005, ApJ, 633, 693 Kraemer, S. B., Crenshaw, D. M., Dunn, J. P., et al. 2012, ApJ, 751, 84 Kriss, G. A., Arav, N., Kaastra, J. S., et al. 2011, A&A, 534, A41 Krolik, J. H., & Kriss, G. A. 2001, ApJ, 561, 684
Krongold, Y., Nicastro, F., Brickhouse, N. S., et al. 2003, ApJ, 597, 832
Krongold, Y., Nicastro, F., Brickhouse, N. S., Elvis, M., & Mathur, S. 2005, ApJ, 622, 842
Laha, S., Guainazzi, M., Dewangan, G. C., Chakravorty, S., & Kembhavi, A. K. 2014, MNRAS, 441, 2613 Laha, S., Dewangan, G. C., Chakravorty, S., & Kembhavi, A. K. 2013, ApJ, 777, 2
Lee, J. C., Ogle, P. M., Canizares, C. R., et al. 2001, ApJ, 554, L13 Lobban, A. P., Reeves, J. N., Miller, L., et al. 2011, MNRAS, 414, 1965 Longinotti, A. L., Krongold, Y., Guainazzi, M., et al. 2015, ApJ, 813, L39 Matt, G., Marinucci, A., Guainazzi, M., et al. 2014, MNRAS, 439, 3016 McKernan, B., Yaqoob, T., George, I. M., & Turner, T. J. 2003, ApJ, 593, 142 McKernan, B., Yaqoob, T., & Reynolds, C. S. 2007, MNRAS, 379, 1359 Mor, R., Netzer, H., & Elitzur, M. 2009, ApJ, 705, 298
Nandra, K., O’Neill, P. M., George, I. M., & Reeves, J. N. 2007, MNRAS, 382, 194 Nardini, E., Reeves, J. N., Gofford, J., et al. 2015, Science, 347, 860
Nardini, E., Reeves, J. N., Porquet, D., et al. 2014, MNRAS, 440, 1200 Nelson, C. H., & Whittle, M. 1995, ApJS, 99, 67
Netzer, H., Kaspi, S., Behar, E., et al. 2003, ApJ, 599, 933 Osterbrock, D. E., & Shuder, J. M. 1982, ApJS, 49, 149