HAL Id: insu-01598576
https://hal-insu.archives-ouvertes.fr/insu-01598576
Submitted on 29 Sep 2017
HAL is a multi-disciplinary open access
archive for the deposit and dissemination of
sci-entific research documents, whether they are
pub-lished or not. The documents may come from
teaching and research institutions in France or
abroad, or from public or private research centers.
L’archive ouverte pluridisciplinaire HAL, est
destinée au dépôt et à la diffusion de documents
scientifiques de niveau recherche, publiés ou non,
émanant des établissements d’enseignement et de
recherche français ou étrangers, des laboratoires
publics ou privés.
Index in Babol City
A Choobbasti, Mehran Naghizadehrokni, R Charaty
To cite this version:
A Choobbasti, Mehran Naghizadehrokni, R Charaty. Microzonation of Liquefaction Hazard using
Liquefaction Index in Babol City. Geotechnical Engineering Journal of the SEAGS & AGSSEA, 2017,
48. �insu-01598576�
Microzonation of Liquefaction Hazard using Liquefaction Index in Babol City
A. Janalizadeh choobbasti1, M. Naghizadehrokni2*, R. Charaty3
1 Department of Civil Engineering, Babol University of technology, Babol, Iran
2Department of Geotechnical Engineering, PhD Researcher, RWTH Aachen University, Aachen, Germany 3Department of Civil Engineering, IAU Zanjan branch, Zanjan, Iran
* E-mail: [email protected]
ABSTRACT: One of the devastating effects of the earthquake is on liquefaction phenomenon site, which is one of the most important and
most complex topics in seismic geotechnical engineering. Liquefaction is a phenomenon that occurs in loose, saturated sediments without stickiness in undrained conditions under the influence of waves caused by earthquakes or heavy static load. In order to cope with devastating effects of this phenomenon, it is essential to identify areas prone to liquefaction. This identification can be conducted as microzoning, in which risk capacity is determined in different areas. Thus, in this paper, the zoning map of Babol liquefaction risk will be provided. In this regard, a study was conducted on the soils in Babol and after examining different areas of the city, laboratory results and field studies of more than 50 boreholes in different areas with a depth of 20 m were analyzed for finding liquefaction and non-liquefaction segments. In this study, different approaches were used including Seed, Iwasaki, Haeri and Yasrebi, Chin & Zhang and Sewmez & Gocojlou procedures and finally, a computer program was written for examining and providing microzoning map of Babol liquefaction risk.
KEYWORDS: Liquefaction, Microzonation, Babol, Index, Seismic Geotechnic.
1. INTRODUCTION
Since the dawn of mankind and human settlement under the roof, earthquake was always one of the risks that have killed the human from time to time. In recent years, discussion about the effects of earthquakes on soil has attracted many soil engineers and researchers. Among the phenomena related to seismic geotechnical risks, soil liquefaction is of great importance(Gill and Berg 1967). In this phenomenon, the saturated soil will be influenced by light stresses caused by earthquake and pore water pressure increases. Now if the speed of applying these loads is low so that the soil has an opportunity for drainage, pore water pressure will be amortized and liquefaction will occur. But if the speed of applying these loads is high, there is no opportunity for drainage, and the soil mass will tend to change volume and pore water pressure will increase so that it will be equal to the total stress applied to the soil mass(Maurer, Green et al. 2015). Therefore, the sand particles will be floating in the water and effective stress will be equal to zero. In this case, soil bulk loses its shear strength and liquefaction occurs. Liquefaction is the main reason for much of the destruction caused by the earthquake. Large and continuous deformations that occur in soil mass can lead to instability and ultimately great damage to these structures(Maurer, Green et al. 2014). This phenomenon can cause gable roofs instability, loss of bearing capacity of structures foundation, and damage to the structures caused by non-uniform subsidence.
After the wide liquefaction that occurred in the devastating earthquake of Japan and Alaska in 1964, geotechnical engineers paid attention to this phenomenon. In the last 40 years, a significant progress has been done in terms of understanding liquefaction mechanism and the factors affecting it(Rahman, Siddiqua et al. 2015). In the early years, more attention was focused on investigating this phenomenon in clean sands so that it was thought that liquefaction is just related to sands and coarse-grained soils are not capable to produce an additional pressure of pore water, which is the main reason of liquefaction (Seed and Idriss 1982). But as time passed and new earthquake occurred and following the observation of this phenomenon in coarse and fine-grained soils, many researchers aimed to examine the factors affecting the liquefaction of the soil(Idriss and Boulanger 2006).
Iran is located on seismic Alpine-Himalayan region and this increased the occurrence of earthquakes as one of the most damaging natural disasters in the country. Major earthquakes such as Manjil earthquake (1990), Ardebil (1996), South Khorasan
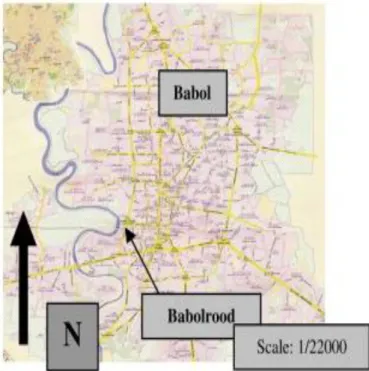
(1997), Bam (2003) and Boroujerd (2006) confirms this issue; therefore, the need is felt for a comprehensive review of earthquake phenomenon and its effects in the country. Therefore, in this study, Babol City (as shown in Figure 1) was evaluated in terms of geological and seismic features, using results of soil mechanic studies and eventually liquefaction risk zoning map of the city was provided(Choobbasti, Farrokhzad et al. 2015).
Figure 1. Position of the Babol City in the Mazandaran Province
2. METHODS
Less than one century has passed from the first use of the word “liquefaction” by researchers. In fact, this is known as one of the most complex issues in geotechnical engineering. The Close connection of this phenomenon with earthquake engineering has attracted more attention from scientists. Hazen in 1918 used the word “liquefaction” for the first time in order to explain Calaveras dam break. Studies on liquefaction phenomenon were seriously
started by researches after two earthquakes of Niigata in Japan and Alaska in America in 1964 (Ceyhun and Hilmi).
Among the most important studies in this field, I can refer to Casgrande, Castro, Seed and Idriss, Youd, Iwasaki et al.’s research works. In this study, according to Seed et al.’s method, the safety factor is determined against liquefaction in accordance with Eq. 1 (Seed, Tokimatsu et al. 1984).
Cyclic Resistance Ratio Cyclic Stress Ratio
S
CRR R
F
CSR L
(1)
Cyclic shear stress ratio is determined by Eq. 2. d av
r
g
a
CSR
0
/
65
.
.
0 0 max 0
(2) Where
av is the average equivalent uniform cyclic shear stress caused by the earthquake, which is assumed to be 0.65 of the maximum induced stress;a
max is the peak horizontal acceleration at ground surface generated by the earthquake, g is the acceleration of gravity,
0 and
0
are the total and effective overloaded stresses, respectively, andr
d is a stress reduction coefficient (Seed and Idriss 1971).r
d had been suggested by the national center for earthquake engineering research workshop (NCEER) in 1996 (Youd, Idriss et al. 2001):1.0 0.00765
9.15
dr
Z
for Z
m
(3)1.174 0.0267
9.15
23
dr
Z
for
m
Z
m
(4)
0.744 0.008
23
30
dr
Z
for
m
Z
m
(5)
0.50
30
dr
for Z
m
(6)The first step in determining the cyclic shear resistance ratio (CRR) of the soil is the corrected number of SPT (N) to be achieved
(
N
1 60)
.1 60
(
N
)
N C C C C C
m.
N. . . .
E B R S(7) Where (N1 60) is the corrected number of SPT value,
N
m is the standard penetration resistance measured at the site,C
N is the correction factorN
mis considered as overhead effective stress,E
C
is hammer efficiency,C
B is the correction factor for borehole diameter,C
R is the correction factor for bar length andC
S is the correction factor for samples with or without cover. The NCEER workshop proposed the Equation 8 for fine correction coefficients (Youd, Idriss et al. 2001).
N
1 60CS
N
1 60 (8) Where α and β are coefficients that are obtained based on the percentage of fines (F200). The cyclic shear resistance ratio (CRR) of soil is determined to obtain the value of (N1)60cs and using theSeed et al.’s graphs with attention to the fine-grained soil (Youd, Idriss et al. 2001). In order to determine the safety factor against liquefaction in earthquakes with different magnitudes, the scale magnification correction coefficient of the earthquake must be used. In this study, the suggested coefficients of Poud & Idris are used.
Poud and Idris suggested that MSF coefficients are calculated according to Equation 9.
(
7.5 /
)
FS
CRR
CSR MSF
(9)Where MSF is the magnitude correction factor.
3. DIFFERENT PROCEDURES FOR EVALUATING FINE-GRAINED SOILS LIQUEFACTION
Natural sand deposits may include some silt seam and bands which can play an important role on the excess pore pressures being developed; therefore, this issue sometimes can be a critical factor in increasing the potential of liquefaction. Sites consists of silt and silty clays with low plasticity properties are widely available around the world, including Iran. Thus, it is very important to know the properties of silts encountered in field or used in laboratory testing. If the silt layer has a high plasticity, it can increase the resistance against liquefaction while low plasticity silts may alleviate the potential risk of liquefaction.
According to Chinese criteria, sandy soils with low liquefaction properties have more trend to liquefaction at low shear strain and soils with high plastic properties tend to reduce the resistance and hardness at the large strain. Seed et al. provided new criteria in 2003 for fine-grained soil liquefaction assessment (Seed, Cetin et al. 2003).
These criteria consider all the properties of fine-grained soil and are widely used in its engineering projects. This procedure is described in Figure 2. As it can be seen, if the soil is in A or B area, there is a need for more investigations including laboratory tests or confidence coefficient in SPT method. In order to calculate the liquefaction severity in this area, 3 methods of Haeri & Yasrebi, Iwasaki and Sunmez and Gukejlo were used. The procedure of Iwasaki includes liquefaction severity from ground level to a depth of 20 meters.
Figure 2. Recommendations Regarding of “Liquefiable” Soil Type Assessment
In this way, by calculating the liquefaction potential at any location using equation 10, the effects of liquefaction in the study can be concluded (Iwasaki, Tokida et al. 1982):
20 0
.
( )
LI
F W z dz
(10)1
1
0
1
FS
FS
F
FS
(11)
z
z
W
(
)
10
0
.
5
(12)
Where
I
L is the liquefaction potential index, F is the function of the safety factor, FS is the safety factor against liquefaction at depth z and W z is the depth function. Iwasaki proposed four categories
for assessing the severity of liquefaction. Liquefaction severity is very low for0
L
I
, low forI
L
5
, high for 5 IL 1and very highfor
15
I
L.Haeri and Yasrebi changed the safety factor in Iwasaki method, in order to remove defects in this approach in order to reduce the confidence coefficient effect of different layers against liquefaction in final potential function of surface occurrence. Also, the depth function was changed so that if the liquefaction layer depth increased, the effect of liquefaction in that layer would reduce non-linearly on the surface. Following equation is suggested to calculate the potential for liquefaction at surface(Iwasaki, Tokida et al. 1982).
20 1.5 20 (1 ) L Z P F dz Z
(13) WhereP
Lthe liquefaction potential index at surface, Z is the depth in meters, F is the safety factor against liquefaction at depth Z.Analyzes have been conducted by Haeri and Yasrebi show that
P
L
1
is the appropriate boundary for separating the two modes of occurrence and non-occurrence of liquefaction effects. Thus, theP
L
1
values indicate non-occurrence at surface andP
L
1
are indicative of the occurrence of the surface effects of liquefaction(Haeri 1999).Chen and Zhang presented the possibility of soil liquefaction by PL equation. This index varies from zero to one which is associated with FL (Chen and Juang 2000).
4.5
1
1
0.96
L LP
F
(14)Sunmez and Gukejlo designated the LS liquefaction severity index instead of the liquefaction potential index proposed by Iwasaki. Sunmez and Gukejlo described the construction of liquefaction severity classified according to the following formula:
20 010 0.5
S LL
P
Z
z dz
(15) The PL (z) value is determined for Eq.14 for each depth.
2 2 20 20 0 0
( )
( )(10
)
(10
)
4
4
L S LdP z
z
z
L
P z
z
z
dz
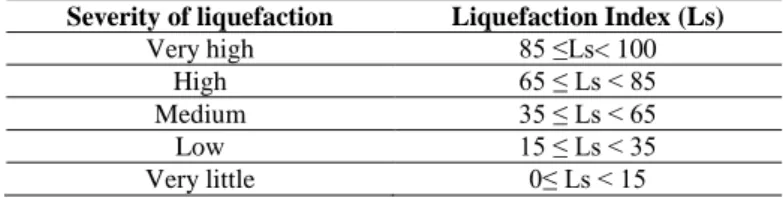
(16)Classification of liquefaction severity index which was suggested by Sunmez and Gukejlo is given in Table 1 with a description of the liquefaction potential(Sonmez and Gokceoglu 2005).
Table 1. Classification of the severity of liquefaction based on LS (Sunmez and Gukejlo)
Severity of liquefaction Liquefaction Index (Ls)
Very high 85 ≤Ls< 100 High 65 ≤ Ls < 85 Medium 35 ≤ Ls < 65 Low 15 ≤ Ls < 35 Very little 0≤ Ls < 15 Non-liquefaction(FL>1.411) Ls=0
4. EVALUATION OF THE GEOLOGICAL, SEISMICITY AND GEOTECHNICAL STUDIES AT BABOL CITY
Babol, a city of Mazandaran province in the northern part of Iran, is considered as the study area in this research. The city is located approximately 20 km south of the Caspian Sea on the west bank of the river Babolrood and receives abundant annual rainfall.
Babol area is located on alluvial deposits that belong to quaternary geology resulting from torrential rivers. The bedrock in the area is made of Conglomerate, sandstone. In general, the soil texture in this area consists of sand, clay and silt compounds. The percentage of these compounds depends on the distance from the sea. Thus, the closer to the sea, the higher percentage of sand compounds and contrariwise: the more the distance from the sea, the higher percentage of silt compounds.
A large number of faults have been identified along the North East - South West direction intersecting with faults along the North West - South East in Babol region, which leads to smashing bedrock in this area. The acceleration of plan in this project is considered 0.35 g according to Babol location in a region with a relatively high risk. However, there is a considerable risk due to the Micro-faults in Quaternary sediments and smashing bedrock. The field of study is considered as a class (IV) according to the classification table of the new edition of the regulations [4].
According to the seismic investigations that have previously been conducted in the area of the Mazandaran province, the assessment of seismic hazard in the Babol city on the analysis of earthquake magnitude (M) equals to 6.4 on the Richter scale. This is obtained by the maximum horizontal acceleration (Amax) equal to 0.32g. This number roughly corresponded with the number achieved by the ministry of Housing and Urban Development in a 500 year-return period event for Babolsar area. The maximum horizontal acceleration for a return period of 500 years is estimated to be between 0.2g to 0.3g in Babol area.
In a study that was conducted by American researchers to demonstrate the effect of site, it was proposed to the U.S. regulation draft, Martin and Dobry showed that for the accelerations less than 0.4g, acceleration over alluvial is more than the acceleration of the stone, and to obtain the acceleration over alluvial it should be 1.2 times the acceleration of the stone. From what has been discussed above, which were obtained from the latest studies and research works, the acceleration number (Amax) is obtained 0.35g in this research. Also, the earthquake magnitude has been considered 7.5 on Richter scale for the calculations of liquefaction. Laboratory and geological studies imply the following results about Babol city soil: 1- Geological formations of plan scope generally belong to the Pleistocene (the present era).
2- Formations of the present era which has covered all over the studied fields have three origins of marshy–fluvial, and the flood and most of the three categories of sediments surround the sediments originating from the fenny and marshy areas.
3- The dominant soil type is clay and sandy silt.
4- Sand particles with a diameter of up to 0.2 mm, are the diameter of the dominant particles in sandy layers of the area.
5- According to the USCS classification, the dominant soil type is the type of CL and ML (clay and silt with low pasty properties). 6- Dry specific weight of the soil for the soil's area is about 1.1 g/cm3 to 1.5 g/cm3.
7- Wet specific gravity of the soils for the proposed area is located in the range of 1.6 g/cm3 to 2.1 g/cm3.
8- Underground water depth varies from 0.2 to a maximum of 6.5 meters in height in the more southern areas.
Due to the city map, according to Figure 3 and considering the dispersion of boreholes location in the city, for appropriate conclusion and the best assessment of the area liquefaction, it was divided into zones of 1000 to 1,000 meters, in which 5 zones were
obtained in the horizontal direction and 7 zones in the vertical direction. Overall, the city was divided into 35 zones which can be seen in Figure 3. Overall, I will have 22 zones of important areas of the city for severity of liquefaction assessment that is usable for zoning map.
Figure 3. Zoning map of the Babol city for liquefaction assessment and the boreholes position
5. RESULTS AND DISCUSSION
The physical properties and boreholes soil test were adjusted in the table for easy access to the boreholes data. Table 2 also represents a sample of these tables from No. 33 boreholes data. The results of liquefaction occurrence severity for each zone were calculated separately with three methods of Iwasaki, Haeri and Yasrebi and Sunmez and Gukejlo, which were adjusted in Table 3. Finally, by using a computer program written in this regard in Matlab Program, calculations were performed to evaluate the liquefaction hazard.
Table 2. Physical characteristics and soil testing of Borehole number 33
Borehole No. 3 Depth of groundwater level: 1.5 m Date of test: 91/05/18 C(g r/cm 2 ) Ǿ W (% ) D 5 0 (m m ) P 2 0 0 P erc en t fin e Γ we t (g /cm 3 ) γd (g /cm 3) Ns p t S o il Ty p e (USCS ) De p th (m ) 27.63 0.072 64.5 1.69 1.32 8 ML 2 23.61 0.121 51.8 1.69 1.37 8 ML 4 28.45 0.071 65.0 1.74 1.35 10 ML 6 0.5 32 26.54 0.148 45.7 1.82 1.44 14 SM 8 24.66 0.122 49.1 1.77 1.42 12 SM 10 26.77 0.122 52.8 1.64 1.29 7 ML 12 22.65 0.192 40.9 1.77 1.44 12 SM 14 25.17 0.116 53.3 1.8 1.44 13 ML 16 24.37 0.189 38.2 1.79 1.44 13 SM 18 22.87 0.198 33.0 1.77 1.44 12 SM 20 In the fourth and fifth columns of Table 2, the special weight of dry and wet soil is provided. The parameter of wet special weight is used in calculation of effective and total tension. P200 is the
percentage of passing particles through the No. 200 sieve. This parameter is used in order to consider the amendments related to the assessed soil fine grained measure to determine the cyclic resistance. D50 presents the particles diameter of soil that 50 percent of grains is
small than it or in other words D50 shows the average size of soil
grain in millimeters.
Table 3 shows the sample output of written program for liquefaction potential assessment. This analysis was performed for all boreholes and overall results related to the all boreholes are visible in Table 4. In this program, some soil parameters including special weight of soil and the percentage of fine-grained are known as a program input parameters.
Table 3. Sample output from a program written for liquefaction assessment
De p th (m ) N spt F 2 0 0 Ϭ Ϭ ’ dr CS R CN (N1 )6 0 (N1 )6 0 c Soil Ty p e (USCS ) De p th (m ) 2 8 63.5 3.28 2.8 0.98 0.26 1.7 10.2 17.24 ML 2 4 8 52 6.7 3.2 0.9 0.35 1.5 9.81 16.77 ML 4 6 10 65 10.2 5.7 0.95 0.39 1.32 11.3 18.46 ML 6 8 14 45 13.8 7.2 0.93 0.4 1.16 15.4 23.5 SM 8 10 12 49 17 8.9 0.9 0.4 1 12.0 19.48 SM 10 12 7 52 20 10 0.8 0.39 0.9 6.93 13.32 ML 12 14 12 2152 23.2 11.7 0.8 0.38 0.92 11.0 18.29 SM 14 16 12 38 27.8 13.3 0.75 0.35 0.87 11.2 18.51 ML 16 18 13 42 31.6 14.9 0.62 0.34 0.82 10.63 17.77 SM 18 20 12 -- 33.9 13.3 0.63 0.31 0.78 9.25 15.91 SM 20 CRR S afe ty F ac to r Iwa sa k i In d ex Ha eri In d ex Ch en In d ex S u n m ez In d ex 0.11 0.44 10.7 2.92 0.09 18.3 0.1 2 0.0 0.0 0.4 0.6 0.12 0.22 10.2 1.32 0.99 14.8 0.16 0.41 7.66 0.91 0.98 12.7 0.1 0.2 7.4 0.5 0.9 10 0.1 0.2 7 0.2 0.9 8.9 0.12 0.34 4.71 0.24 0.99 6.95 0.12 2 0.0 0.0 0.03 0.18
0.12 2 0.0 0.0 0.04 0.11 0.11 2 0.0 0.0 0.04 0.04
Table 4. Summary of Results Indicators boreholes and liquefaction zone Zone Borehole Number Iwasaki Index Haeri Index Sunmez Index A5 45 8.9 0.5 18.15 B3 18 44.05 2.63 55.54 32 31.12 4.88 48.44 29 57.17 6.11 76.62 Ave 44.11 4.54 60.20 B4 35 40.81 91.19 89.03 50 34.33 6.4 76.30 34 40.85 5.68 69.85 Ave 38.66 7.09 78.39 B5 11 20.96 5.49 56.96 B6 25 33.71 5.23 58.20 B7 36 44.19 3.32 64.80 C1 23 58.81 7.87 84.84 20 21.93 1.39 32.29 Ave 40.37 4.63 58.57 C4 4 24.11 2.17 43.23 16 50.29 4.80 68.72 39 57.46 7.54 84.73 Ave 43.95 4.84 65.56 D2 30 16.41 0.97 26.46 40 16.47 0.97 26.47 13 32.10 4.37 57.55 19 55.95 4.05 69.93 Ave 30.23 2.59 45.10 D3 41 62.27 8.21 89.77 48 28.73 7 55.87 Ave 45.50 7.60 72.82 D4 37 53.48 6.23 80.89 2 23 2.61 35 10 55.65 5.89 82.17 49 51.85 8.75 89.69 Ave 46 5.87 71.95 D5 28 40.70 3.95 63 9 0 0 2.66 Ave 20.30 1.98 32.86 D6 1 28.14 3.35 44.34 47 25.64 3.35 49.54 Ave 26.89 3.35 46.94 C2 21 36.63 6.09 59.92 43 43.15 5.80 63.38 31 33.95 4.38 52.23 5 32.32 4.53 53.58 Ave 36.51 5.20 57.53 C3 44 23.84 6.54 57.20 3 56.21 8.41 87.97 33 47.68 6.22 73.85 46 40.01 5.47 57.18 14 61.76 9 97.42 Ave 45.90 7.14 74.72 C5 38 68 7.4 98.8 42 62.33 9.12 98.27 Ave 65.19 8.26 98.54 C6 6 61.23 8.1 88.46 24 26.31 4.69 45 Ave 43.77 6.4 66.74 C7 15 52.2 5.53 72.21 D1 12 46.34 8 80.45 D7 26 52.51 5.29 73.99 17 43.72 4.4 59.36 Ave 48.11 4.85 66.68 E5 8 42.9 3.51 64.56 27 48.76 2.64 65 Information of all data in Babol city can be seen in Table 4. Each borehole was analyzed by three approaches and liquefaction indexed was obtained for each borehole. To calculate the liquefaction index of different zones in this table, average of boreholes result was calculated in the last line of each zone where there was in that zone and finally three liquefaction index has been obtained for each zone based on Sonmez, Haeri and Iwasaki methods.
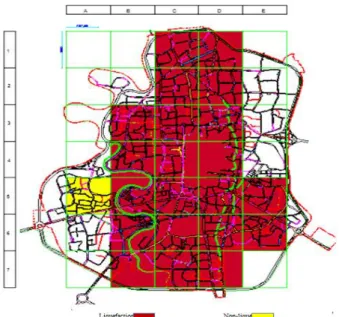
In this map which obtained from Iwasaki procedure which is showed in Figure 4, areas are categorized into three diverse parts as low liquefaction potential, high liquefaction potential and very high liquefaction potential that almost all zones in Babol city was considered as a very high severity of liquefaction and just one zone was recognized as high liquefaction potential. Also there are four different liquefaction severities in Iwasaki’s approach; I can just two status of liquefaction as non-liquefaction and very high liquefaction potential. It seems that liquefaction will occur in almost all area of Babol city, based on obtained map from Iwasaki method
Figure 4. Microzonation Map of liquefaction severity of Babol City according to Iwasaki
In Haeri and Yasrebi’s approach, there are just two conditions for occurring or non-occurring liquefaction and the map which has been obtained from this approach are categorized into two sections as shown in Figure 5. In this method, almost all areas are recognized as liquefiable areas. In fact, Haeri method presents the presence or absence of liquefaction at surface, numbers of greater than 1 indicates presence of liquefaction in the surface and numbers of less than 1 indicates absence of liquefaction in the surface. This map provides information about liquefaction segments like Iwasaki procedure. In this map 22 zones have been evaluated in terms of determining liquefaction and non-liquefaction areas. Overall, liquefaction will occur in 21 zones and this issue indicates that liquefaction index is greater than 1 in these zones and one zone is recognized as non-liquefaction
segment that can represent that liquefaction index is lower than 1.
In Figure 6 which is obtained by Sonmez & Gokceoglu procedure, almost all existing zones on the map have been identified as areas of liquefaction except for zone E2, E3 and A6. On this map, just one zone (C6) in the center of the map is known as liquefaction zone with high intensity. Other areas that were identified with high-intensity liquefaction in previous procedures, in this method have been determined as liquefaction areas with high and medium intensity. Moreover, southern and central area of Babol are recognized as medium and high liquefaction potential whereas these segments were identified as very high liquefaction potential in Iwasaki approach.
Figure 5. Microzonation map of occurrence or non-occurrence of liquefaction in Babol city according to Haeri and Yasrebi approach
(1976)
Figure 6. Microzonation map of liquefaction severity of Babol city
according to Sunmez and Gukejlo (2005)
But non-liquefaction areas have almost been the same in all maps and almost all 3 zones map, A3 and E2, E3 are known as liquefaction. This issue indicates that to evaluate the
non-liquefaction areas, all three methods have acted in the same way, and the non-liquefaction areas are the same for all three approaches. By comparing the obtained map from the three proposed methods, it can be concluded that Iwasaki and Haeri’s method have an acceptable consistency because there are many similarities in the obtained maps from these two methods. On the other hand, the obtained liquefaction map from Sonmez’s approach gives different results. I can see similar results in Heidari et al(Heidari, Amel-Sakhi et al.), Farokhzad et al(Farrokhzad, Choobbasti et al. 2012) and choobbasti et al(Choobbasti, Farrokhzad et al. 2015) based on NCEER2001 and artificial neural network but the number data was not enough for receiving suitable results. In addition, for increasing the accuracy of results, the average of boreholes result was calculated for each zone. Finally, in this paper three maps were obtained from divers procedures were compared for enhancing validation of results. With evaluation and comparison of obtained maps with different methods can be concluded that the central and southern parts of the Babol city are known as liquefaction areas in almost all three maps, but there are some differences about northern parts of Babol city. Evaluation of obtained map from Haeri and Iwasaki method shows that all northern parts of Babol city are known as liquefaction point with high intensity, while in the obtained map from Sonmez procedure, northern parts of Babol city are known as liquefaction point with moderate intensity. However, about non-liquefaction areas, obtained maps have a lot of consistency.
6. CONCLUSIONS
The results of 50 bore holes from field experiments were used for preparing microzonation map of the city of Babol. The city has been divided to 35 separate zones for preparing microzonation map that 22 zones were used for zoning. The zoning maps were gained from the adjusted results in table 4, in which the liquefaction intensity zoning map of Babol city is provided according to Iwasaki’s procedure. Concerning the map was obtained by this approach, 21 zones were evaluated with very high liquefaction intensity and 1 zone with high liquefaction severity from the set of 22 searchable zones. Obtained map from Haeri & Yasrebi’s approach indicates liquefied and non-liquefied segments in Babol. From a total of 22 evaluable zones, the results show the liquefaction incidence at the surface for 21 zones and only one zone is determined with the lack of liquefaction incidence at the surface. The zoning map of liquefaction occurrence intensity in Babol city based on Sewmez and Gokojlou’s method illustrates that 2 zones with low liquefaction incidence severity, 9 zones with moderate liquefaction incidence severity, 10 zones with high liquefaction incidence intensity and only 1 zone with very high liquefaction incidence intensity were evaluated as shown in Figure 6. The zoning maps were obtained from Iwasaki and Haeri’s approach can confirm each other, so that 1 zone with low liquefaction intensity according to Iwasaki procedure is the same zone which is evaluated without liquefaction occurrence at surface in Haeri & Yasrebi’s approach. Due to the different divisions of Sewmez & Gokojlou’s method or in the 2 previous procedures, I cannot have an appropriate analogy for results correspondence, hence; it is reasonable to conclude that the maps which obtained from Iwasaki and Haeri’s approaches give us more valuable results and I can trust on these maps. In addition, the main criteria of Iwasaki and Haeri’s procedure are so similar and these methods have more compliance with soil in Iran.
7. ACKNOWLEGDMENT
I am using this opportunity to express my gratitude to everyone who supported me to complete this paper. I am thankful for their aspiring guidance, invaluably constructive criticism and friendly advice during the project work.
8. REFERENCES
Ceyhun, E. and L. Hilmi "Impact of Risk Based PML Estimation on Earthquake Insurance Rates for Industrial Buildings in Turkey."
Chen, C. J. and C. H. Juang (2000). "Calibration of SPT-and CPT-based liquefaction evaluation methods." Geotechnical Special Publication: 49-64.
Choobbasti, A., F. Farrokhzad, S. Rahim Mashaie and P. Azar (2015). "Mapping of soil layers using artificial neural network (case study of Babol, northern Iran)." Journal of the South African Institution of Civil Engineering 57(1): 59-66. Farrokhzad, F., A. Choobbasti and A. Barari (2012). "Liquefaction
microzonation of Babol city using artificial neural network." Journal of King Saud University-Science 24(1): 89-100. Gill, W. R. and G. E. V. Berg (1967). Soil dynamics in tillage and
traction, Agricultural Research Service, US Department of Agriculture.
Haeri, M. Y., SH. (1999). "New criteria for evaluating liquefaction effects on level ground." Fourth International Conference on Civil Engineering, Sharif University of Technology. Heidari, S. A., M. Amel-Sakhi, M. Mohammadi and Z. Soltani
"Zonation for Soil Liquefaction Potential Assessment in Babol City, Iran."
Idriss, I. and R. Boulanger (2006). "Semi-empirical procedures for evaluating liquefaction potential during earthquakes." Soil Dynamics and Earthquake Engineering 26(2): 115-130. Iwasaki, T., K. Tokida, F. Tatsuoka, S. Watanabe, S. Yasuda and H.
Sato (1982). Microzonation for soil liquefaction potential using simplified methods. Proceedings of the 3rd international conference on microzonation, Seattle.
Maurer, B. W., R. A. Green, M. Cubrinovski and B. A. Bradley (2014). "Evaluation of the liquefaction potential index for assessing liquefaction hazard in Christchurch, New Zealand." Journal of Geotechnical and Geoenvironmental Engineering 140(7): 04014032.
Maurer, B. W., R. A. Green and O.-D. S. Taylor (2015). "Moving towards an improved index for assessing liquefaction hazard: Lessons from historical data." Soils and Foundations 55(4): 778-787.
Rahman, M. Z., S. Siddiqua and A. M. Kamal (2015). "Liquefaction hazard mapping by liquefaction potential index for Dhaka City, Bangladesh." Engineering Geology 188: 137-147. Seed, H., K. Tokimatsu, L. Harder and R. Chung (1984). "The
influence of SPT procedures in soil liquefaction resistance evaluations: Berkeley, University of California." Earthquake Engineering Research Center Report UBC/EERC-84 15. Seed, H. B. and I. M. Idriss (1971). "Simplified procedure for
evaluating soil liquefaction potential." Journal of Soil mechanics & Foundations Div.
Seed, H. B. and I. M. Idriss (1982). Ground motions and soil liquefaction during earthquakes, Earthquake Engineering Research Institute.
Seed, R. B., K. O. Cetin, R. E. Moss, A. M. Kammerer, J. Wu, J. M. Pestana, M. F. Riemer, R. B. Sancio, J. D. Bray and R. E. Kayen (2003). Recent advances in soil liquefaction engineering: a unified and consistent framework. Proceedings of the 26th Annual ASCE Los Angeles Geotechnical Spring Seminar: Long Beach, CA.
Sonmez, H. and C. Gokceoglu (2005). "A liquefaction severity index suggested for engineering practice." Environmental Geology 48(1): 81-91.
Youd, T., I. Idriss, R. D. Andrus, I. Arango, G. Castro, J. T. Christian, R. Dobry, W. L. Finn, L. F. Harder Jr and M. E. Hynes (2001). "Liquefaction resistance of soils: summary report from the 1996 NCEER and 1998 NCEER/NSF workshops on evaluation of liquefaction resistance of soils." Journal of geotechnical and geoenvironmental engineering 127(10): 817-833.