HAL Id: hal-00296465
https://hal.archives-ouvertes.fr/hal-00296465
Submitted on 28 Feb 2008
HAL is a multi-disciplinary open access
archive for the deposit and dissemination of
sci-entific research documents, whether they are
pub-lished or not. The documents may come from
teaching and research institutions in France or
abroad, or from public or private research centers.
L’archive ouverte pluridisciplinaire HAL, est
destinée au dépôt et à la diffusion de documents
scientifiques de niveau recherche, publiés ou non,
émanant des établissements d’enseignement et de
recherche français ou étrangers, des laboratoires
publics ou privés.
Technical Note: Intercomparison of ILAS-II version 2
and 1.4 trace species with MIPAS-B measurements
G. Wetzel, T. Sugita, H. Nakajima, T. Tanaka, T. Yokota, F. Friedl-Vallon,
A. Kleinert, G. Maucher, H. Oelhaf
To cite this version:
G. Wetzel, T. Sugita, H. Nakajima, T. Tanaka, T. Yokota, et al.. Technical Note: Intercomparison
of ILAS-II version 2 and 1.4 trace species with MIPAS-B measurements. Atmospheric Chemistry and
Physics, European Geosciences Union, 2008, 8 (5), pp.1119-1126. �hal-00296465�
www.atmos-chem-phys.net/8/1119/2008/ © Author(s) 2008. This work is distributed under the Creative Commons Attribution 3.0 License.
Chemistry
and Physics
Technical Note: Intercomparison of ILAS-II version 2 and 1.4 trace
species with MIPAS-B measurements
G. Wetzel1, T. Sugita2, H. Nakajima2, T. Tanaka2, T. Yokota2, F. Friedl-Vallon1, A. Kleinert1, G. Maucher1, and H. Oelhaf1
1Institut f¨ur Meteorologie und Klimaforschung (IMK), Forschungszentrum Karlsruhe, Karlsruhe, Germany 2National Institute for Environmental Studies, Tsukuba, Japan
Received: 27 September 2007 – Published in Atmos. Chem. Phys. Discuss.: 22 November 2007 Revised: 25 January 2008 – Accepted: 31 January 2008 – Published: 28 February 2008
Abstract. The Improved Limb Atmospheric Spectrometer (ILAS)-II sensor aboard the Japanese ADEOS-II satellite was launched into its sun-synchronous orbit on 14 Decem-ber 2002 and performed solar occultation measurements of trace species, aerosols, temperature, and pressure in the po-lar stratosphere until 25 October 2003. Vertical trace gas profiles obtained with the balloon version of the Michelson Interferometer for Passive Atmospheric Sounding (MIPAS-B) provide one of the sparse data sets for validating ILAS-II version 2 and 1.4 data. The MIPAS-B limb emission spec-tra were collected on 20 March 2003 over Kiruna (Sweden, 68◦N) at virtually the same location that has been sounded by ILAS-II about 5.5 h prior to the sampling of MIPAS-B. The intercomparison of the new ILAS-II version 2 (North-ern Hemispheric sunrise) data to MIPAS-B vertical trace gas profiles shows a good to excellent agreement within the com-bined error limits for the species O3, N2O, CH4, H2O (above
21 km), HNO3, ClONO2, and CFC-11 (CCl3F) in the
com-pared altitude range between 16 and 31 km such that these data appear to be very useful for scientific analysis. With regard to the previous version 1.4 ILAS-II data, significant improvements in the consistency with MIPAS-B are obvi-ous especially for the species CH4 and H2O, but also for
O3, HNO3, ClONO2, NO2, and N2O5. However,
compar-ing gases like NO2, N2O5, and CFC-12 (CCl2F2) exhibits
only poor agreement with MIPAS-B such that these species cannot be assumed to be validated at the present time.
Correspondence to: G. Wetzel
1 Introduction
Satellite measurements are important for monitoring the at-mosphere within the context of naturally and anthropogeni-cally induced climate changes since atmospheric parame-ters can be derived from these remote sensing measurements over large areas of the Earth. The second version of the Japanese Advanced Earth Observing Satellite (ADEOS-II) was launched on 14 December 2002 and operated sporadi-cally between January and March 2003, followed by a con-tinuous and routinely operation between 2 April and 25 Oc-tober 2003. A malfunction of the solar power subsystem pre-vented a further operation after this date.
Apart from satellite observations, balloon-borne measure-ments are a valuable tool to obtain distributions of a large number of trace species with sufficiently high vertical reso-lution over most of the stratospheric altitude region. Due to the quasi-Lagrangian observation, long integration times are possible which significantly reduce the influence of noise in the recorded spectra. Since the number of balloon launches is restricted due to logistical and financial constraints the qual-ity of the spatial and temporal coincidence between the satel-lite measurement and the balloon observation is a crucial is-sue.
A flight of the balloon version of the Michelson Interfer-ometer for Passive Atmospheric Sounding (MIPAS-B) in-strument was carried out from Kiruna (Sweden, 68◦N) on 20/21 March 2003 as part of a validation campaign for the chemistry instruments MIPAS, GOMOS, and SCIAMACHY aboard the environmental satellite ENVISAT (see, e.g., Wet-zel et al., 2007). Owing to the long duration of this flight, a good match with observations of the Improved Limb Atmo-spheric Spectrometer (ILAS)-II sensor aboard the ADEOS-II satellite could be managed. Limb emission spectra were ob-served by MIPAS-B at virtually the same location inside the
1120 G. Wetzel et al.: ILAS-II intercomparison with MIPAS-B polar vortex that has been sounded by ILAS-II about 5.5 h
prior to the sampling of MIPAS-B. The mean horizontal dis-tance of the observed tangent points of both sensors was less than 100 km. In this paper, analysed data (version 1.4 and 2) of ILAS-II are compared to observations with the MIPAS-B instrument. The paper provides an assessment of these new ILAS-II version 2 data following up the earlier presented val-idation of version 1.4 data (Wetzel et al., 2006).
2 Instruments and data analysis
ILAS-II was one of five sensors aboard the ADEOS-II satel-lite and was designed similarly to its predecessor (Sasano et al., 1999; Nakajima et al., 2006) using the solar oc-cultation technique. Four spectrometers covered the in-frared (3–13 µm; including a narrow high-resolution chan-nel for the detection of ClONO2)and the near visible
re-gion (753–784 nm) with a spectral resolution from 0.129 µm up to 0.15 nm. Observations were confined to high-latitudes (57◦N to 73◦N and 64◦S to 90◦S) because of the geomet-rical relation of the solar occultation events with the sun-synchronous orbit. Measurements were performed approx-imately 14 times daily in each hemisphere. First sporadic soundings were carried out in January 2003. Routine mea-surements were taken from April to October 2003. Vertical profiles of species related to ozone chemistry, including O3,
HNO3, NO2, N2O, CH4, H2O, CFC-11 (CCl3F), CFC-12
(CCl2F2), ClONO2, and N2O5, as well as aerosol extinction
coefficients at 780 nm, temperature, and pressure can be de-rived from the measured spectra. Retrieval calculations were performed with an onion-peeling algorithm with a multipa-rameter least squares fitting procedure (Yokota et al., 2002). A total error is calculated as the root sum squares of the in-ternal and exin-ternal errors at each profile altitude. Inin-ternal errors are estimated from the final residuals in the spectral non-linear least squares fitting. External errors comprise un-certainties in the non-gaseous correction due to aerosols and temperature uncertainties. Spectroscopic parameters were chosen from the high-resolution transmission molecular ab-sorption database (HITRAN; Rothman et al., 2003, 2005). The retrieval grid was set to 1 km, while the typical vertical resolution ranges between 1.3 and 2.9 km.
As compared to version 1.4 data the following improve-ments have been applied for processing version 2: a trans-mittance correction has been adopted taking into account the changing spectrometer signal due to the distortion of the en-trance slit by solar heat energy during the sunrise occultation events (Northern Hemisphere). A new tangent height regis-tration method was applied using information of the gimbal mirror angle instead of the sun edge sensor method used for the version 1.4 data which was affected by the occurrence of polar stratospheric clouds (PSCs) in the lower stratosphere (Tanaka et al., 2007). Another major difference between ILAS-II version 2 and version 1.4 data is the use of HITRAN
2004 (Rothman et al., 2005) line parameters instead of HI-TRAN 2k (Rothman et al., 2003).
The balloon-borne Fourier transform spectrometer MIPAS-B is a limb-emission sounder which covers the mid-infrared spectral range (4 to 14 µm) and operates at cryogenic temperatures. Besides a high performance and flexibility of the pointing system the suitability of MIPAS-B to validate instruments like ILAS-II is based mainly on its high spectral resolution (about 0.07 cm−1after apodization) allowing the separation of individual spectral lines from continuum-like emissions in combination with a high radio-metric accuracy. A comprehensive overview and description of the instrument is given by Friedl-Vallon et al. (2004) and references therein. A MIPAS-B flight was carried out on 20/21 March 2003 from Kiruna (Sweden, 68◦N), dedicated mainly to ENVISAT validation tasks (see, e.g., Cortesi et al., 2007; H¨opfner et al., 2007; Ridolfi et al., 2007; Wang et al., 2007; Wetzel et al., 2007). The flight duration of more than 15 h from 18:22 UTC (20 March) to 09:38 UTC (21 March) also permitted a good match of the sunrise measurement of the ILAS-II sensor aboard ADEOS-II. Radiance spectra were observed at the same location ILAS-II had measured about 5.5 h prior to the sampling by MIPAS-B. Both in-struments measured nearly the same air masses inside the polar vortex over a wide altitude range in the absence of polar stratospheric clouds (Wetzel et al., 2006). The mean horizontal distance of the observed tangent points of both sensors was less than 100 km in the overlapping altitude region. Backward trajectory calculations have shown that air masses measured by MIPAS-B were within a 500 km horizontal distance to ILAS-II at the time of the ILAS-II observation. MIPAS-B measures all atmospheric parameters ILAS-II is covering. Retrieval calculations of atmospheric target parameters were performed with a least squares fitting algorithm using analytical derivative spectra calculated by the Karlsruhe Optimized and Precise Radiative transfer Algorithm (KOPRA; Stiller et al., 2002; H¨opfner et al., 2002). A Tikhonov-Phillips regularization approach was applied which was constrained with respect to the form of an a priori profile. The resulting vertical resolution for all intercomparison species lies between about 1.5 and 3 km and is therefore comparable to the vertical resolution of ILAS-II. The error estimation includes random noise as well as the mutual influence (covariance effects) of the fitted pa-rameters, temperature errors, and line of sight inaccuracies. Spectroscopic parameters chosen for the MIPAS-B retrieval are consistent with the database taken for the ILAS-II data analysis. More details of the MIPAS-B data analysis is given by Wetzel et al. (2006) and references therein.
3 Profile comparison of trace species
In this section, profiles of trace gases measured by MIPAS-B are compared to ILAS-II version 1.4 and 2 data. To account
35 30 25 20 15 10 0 1 2 3 4 5 6 7 35 30 25 20 15 10 0 1 2 3 4 5 6 7 -1.0 -0.5 0.0 0.5 1.0 10 15 20 25 30 35 -1.0 -0.5 0.0 0.5 1.0 Kiruna, 20 March 2003: MIPAS-B (22:06 UTC) ILAS-II v1.4 (16:23 UTC) ILAS-II v2 (16:23 UTC) O
3 Volume Mixing Ratio (ppmv)
Altitude (km)
ILAS-II - MIPAS-B Difference (solid) Comb. Err. (dashed)
mean abs. difference:
v1.4: 0.36 ppmv (11.6%)
v2: 0.20 ppmv ( 6.3%)
Diff./Err. (ppmv)
Fig. 1. Comparison of O3profiles as measured by MIPAS-B and
ILAS-II (data versions 1.4 (v1.4) and 2 (v2)) on 20 March 2003 above northern Scandinavia together with differences and combined total errors. Mean difference values are calculated over all coinci-dent altitudes.
for the small temporal and spatial mismatch of both obser-vations, ILAS-II measured quantities were linearly interpo-lated to the potential temperature levels corresponding to the MIPAS-B altitude grid. Volume mixing ratio (VMR) differ-ences of measured trace species are displayed together with the combined total errors of both instruments within a 95% confidence limit. They have been calculated by the root sum squares of the total errors of each instrument neglecting spec-troscopic inaccuracies since the same specspec-troscopic database and the same molecular bands have been used during the re-trieval process of both instruments. The comparison between the VMR difference and the combined total error of the two instruments is appropriate to identify unexplained biases in the ILAS-II data. These biases are considered to be signifi-cant when they exceed the combined error limits.
3.1 Ozone
The results for the comparison of the trace species ozone are shown in Fig. 1. The overall agreement between ILAS-II and MIPAS-B measured quantities is found to be quite good. The shapes of all measured profiles are very similar. The clear negative bias in the previous ILAS-II version 1.4 data is reduced significantly in the newer data version. Except for the region around 30 km, the differences calculated for the new version 2 data are clearly within the combined er-ror limits and the mean absolute difference averaged over all coincident altitudes amounts to only 6%.
3.2 Nitrous oxide and methane
Profile comparisons of N2O and CH4are considered together
since the behaviour of these long-lived trace gases in the stratosphere in terms of transport and lifetime is similar.
Fig-35 30 25 20 15 10 0 50 100 150 200 250 300 350 35 30 25 20 15 10 0 50 100 150 200 250 300 350 -60 -40 -20 0 20 40 60 10 15 20 25 30 35 -60 -40 -20 0 20 40 60 Kiruna, 20 March 2003: MIPAS-B (22:06 UTC) ILAS-II v1.4 (16:23 UTC) ILAS-II v2 (16:23 UTC) N
2O Volume Mixing Ratio (ppbv)
Altitude (km)
ILAS-II - MIPAS-B Difference (solid) Comb. Err. (dashed)
mean abs. difference:
v1.4: 4.3 ppbv (16.6%)
v2: 3.6 ppbv (18.1%)
Diff./Err. (ppbv)
Fig. 2. Comparison of N2O profiles as measured by MIPAS-B and
ILAS-II. Annotation as per Fig. 1.
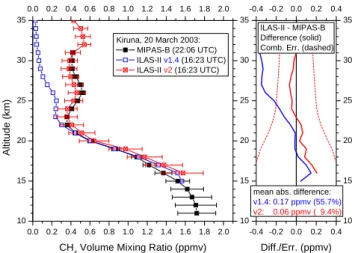
35 30 25 20 15 10 0.0 0.2 0.4 0.6 0.8 1.0 1.2 1.4 1.6 1.8 2.0 35 30 25 20 15 10 0.0 0.2 0.4 0.6 0.8 1.0 1.2 1.4 1.6 1.8 2.0 -0.4 -0.2 0.0 0.2 0.4 10 15 20 25 30 35 -0.4 -0.2 0.0 0.2 0.4 Kiruna, 20 March 2003: MIPAS-B (22:06 UTC) ILAS-II v1.4 (16:23 UTC) ILAS-II v2 (16:23 UTC) CH
4 Volume Mixing Ratio (ppmv)
Altitude (km)
ILAS-II - MIPAS-B Difference (solid) Comb. Err. (dashed)
mean abs. difference:
v1.4: 0.17 ppmv (55.7%)
v2: 0.06 ppmv ( 9.4%)
Diff./Err. (ppmv)
Fig. 3. Comparison of CH4profiles as measured by MIPAS-B and
ILAS-II. Annotation as per Fig. 1.
ures 2 and 3 display the intercomparison of N2O and CH4,
respectively. Both tracers exhibit very low values in the al-titude region around 22 and 23 km which point to strongly subsided air masses originating from the upper stratosphere or lower mesosphere (Engel et al., 2006). Both ILAS-II data versions reproduce the N2O profile observed by MIPAS-B
very well. Differences are clearly inside the combined er-rors and mean absolute deviations over all coincident alti-tudes amount only about 4 ppbv (∼17%) whereas the mean deviation even amounts only −0.1 ppbv (−11%) for the ver-sion 2 data.
Small differences inside the combined error limits are also obvious when looking at the CH4comparison with the
ILAS-II version 2 data. The negative bias visible in the version 1.4 data above 22 km has vanished in the newer data version such that the mean absolute difference diminished to 0.06 ppmv (9.4%). A positive bias for CH4, which is slightly increasing
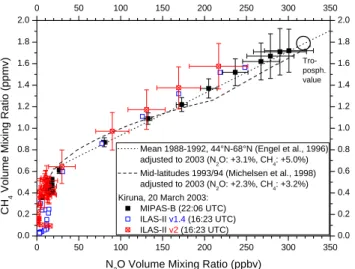
1122 G. Wetzel et al.: ILAS-II intercomparison with MIPAS-B 0 50 100 150 200 250 300 350 0.0 0.2 0.4 0.6 0.8 1.0 1.2 1.4 1.6 1.8 2.0 0 50 100 150 200 250 300 350 0.0 0.2 0.4 0.6 0.8 1.0 1.2 1.4 1.6 1.8 2.0 Tro-posph. value CH 4
Volume Mixing Ratio (ppmv)
N2O Volume Mixing Ratio (ppbv)
Mean 1988-1992, 44°N-68°N (Engel et al., 1996) adjusted to 2003 (N2O: +3.1%, CH4: +5.0%) Mid-latitudes 1993/94 (Michelsen et al., 1998) adjusted to 2003 (N2O: +2.3%, CH4: +3.2%) Kiruna, 20 March 2003:
MIPAS-B (22:06 UTC) ILAS-II v1.4 (16:23 UTC) ILAS-II v2 (16:23 UTC)
Fig. 4. N2O-CH4correlations as measured by MIPAS-B and
ILAS-II (ILAS-ILAS-II error bars for CH4values less than 0.3 ppmv are
omit-ted for clarity). Trend-correcomit-ted reference correlations observed by other instruments (in-situ, Engel et al., 1996, and Atmospheric Trace Molecule Spectroscopy Experiment, Michelsen et al., 1998) are shown for comparison. The Northern Hemispheric tropospheric correlation value of 2003 is marked by a black circle.
35 30 25 20 15 10 0 1 2 3 4 5 6 7 8 9 35 30 25 20 15 10 0 1 2 3 4 5 6 7 8 9 -2 -1 0 1 2 10 15 20 25 30 35 -2 -1 0 1 2 H
2O Volume Mixing Ratio (ppmv)
Altitude (km) Kiruna, 20 March 2003: MIPAS-B (22:06 UTC) ILAS-II v1.4 (16:23 UTC) ILAS-II v2 (16:23 UTC) ILAS-II - MIPAS-B Difference (solid) Comb. Err. (dashed)
mean abs. difference:
v1.4: 1.35 ppmv (28.4%)
v2: 0.55 ppmv (11.2%)
Diff./Err. (ppmv)
Fig. 5. Comparison of H2O profiles as measured by MIPAS-B and
ILAS-II. Annotation as per Fig. 1.
downwards, is visible below 23 km. Anyhow, the intercom-parison of N2O and CH4confirms that MIPAS-B and
ILAS-II actually sounded air masses with similar characteristics. Measured N2O-CH4 relationships serve as
self-consistency checks since they are not influenced by any mismatch of air masses with different degree of sub-sidence. Both measured correlations (see Fig. 4), ILAS-II and MIPAS-B, are quite close to the standard relationships deduced by Engel et al. (1996) and Michelsen et al. (1998) after trend-correction to the year 2003 taking into account mean increase rates of CH4and N2O. The positive bias in the
ILAS-II CH4 version 2 data in the lowermost stratosphere
35 30 25 20 15 10 0 2 4 6 8 10 12 14 35 30 25 20 15 10 0 2 4 6 8 10 12 14 -3 -2 -1 0 1 2 3 10 15 20 25 30 35 -3 -2 -1 0 1 2 3 Arctic winter 1999/2000 (Herman et al., 2002) Arctic winter 1991/1992 (Engel et al., 1996) H = [H
2O]+2[CH4] Volume Mixing Ratio (ppmv)
Altitude (km) Kiruna, 20 March 2003: MIPAS-B (22:06 UTC) ILAS-II v1.4 (16:23 UTC) ILAS-II v2 (16:23 UTC) ILAS-II - MIPAS-B Difference (solid) Comb. Err. (dashed)
mean abs. difference:
v1.4: 1.63 ppmv (28.4%)
v2: 0.47 ppmv ( 7.0%)
Diff./Err. (ppmv)
Fig. 6. Hydrogen budget H=[H2O]+2[CH4] as measured by MIPAS-B and ILAS-II. Balloon-borne observations (hatched grey bar) performed by Engel et al. (1996) and aircraft measurements (solid grey bar) carried out by Herman et al. (2002) are shown for comparison.
(cf. Fig. 3) yields to values which are slightly above the standard N2O-CH4correlations.
3.3 Water vapour and hydrogen budget
H2O profiles measured by MIPAS-B and ILAS-II are
pre-sented in Fig. 5. The strong vertical gradient in the MIPAS-B profile above the hygropause at 13 km reflects the subsi-dence of air masses in the polar vortex. The significant neg-ative bias in the ILAS-II version 1.4 data has disappeared in the newer data version above 21 km and deviations are now within the combined error limits in this altitude region. Griesfeller et al. (2008) show increased H2O values from
ver-sion 1.4 to verver-sion 2 even below 21 km due mainly to the transmittance correction. Although the correction was also applied for the pre-operational measurements in March 2003, it might be not adequate for those measurements.
The oxidation chain of CH4 in the stratosphere produces
about two molecules of H2O. The sum H=[H2O]+2[CH4]
is therefore a good measure for the hydrogen budget in the stratosphere because it is a quasi conserved quantity in this altitude region. Figure 6 displays the hydrogen budget as measured by ILAS-II and MIPAS-B in comparison to ear-lier observations (Engel et al., 1996; Herman et al., 2002). Inferred MIPAS-B volume mixing ratios are quite close to these observations. Above 21 km the agreement between MIPAS-B and ILAS-II data version 2 is pretty good. The negative bias of up to 1 ppmv in the ILAS-II data below this altitude is caused by the large negative bias in H2O which
is partly compensated by the small positive CH4bias in this
altitude region.
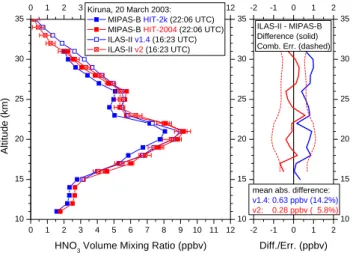
35 30 25 20 15 10 0 1 2 3 4 5 6 7 8 9 10 11 12 35 30 25 20 15 10 0 1 2 3 4 5 6 7 8 9 10 11 12 -2 -1 0 1 2 10 15 20 25 30 35 -2 -1 0 1 2 Kiruna, 20 March 2003:
MIPAS-B HIT-2k (22:06 UTC) MIPAS-B HIT-2004 (22:06 UTC) ILAS-II v1.4 (16:23 UTC) ILAS-II v2 (16:23 UTC)
HNO
3 Volume Mixing Ratio (ppbv)
Altitude (km)
ILAS-II - MIPAS-B Difference (solid) Comb. Err. (dashed)
mean abs. difference:
v1.4: 0.63 ppbv (14.2%)
v2: 0.28 ppbv ( 5.8%)
Diff./Err. (ppbv)
Fig. 7. Comparison of HNO3profiles as measured by MIPAS-B and
ILAS-II. MIPAS-B HNO3was retrieved with HITRAN 2k
(HIT-2k) and HITRAN 2004 (HIT-2004) spectroscopic data bases which have been used for the ILAS-II version 1.4 and 2 data retrievals, respectively.
3.4 Nitrogen species
Comparison results for the nitrogen reservoir species HNO3
are depicted in Fig. 7. Updates of HNO3spectroscopy were
performed from the HITRAN 2k to the HITRAN 2004 spec-troscopic database (Rothman et al., 2005). Hence, MIPAS-B retrieval calculations have been carried out with the same spectroscopic data base that was used for the ILAS-II data analysis. The shape of the profiles observed by both instru-ments is very similar, including the dip at 24 km. While there is a small positive bias visible in the ILAS-II version 1.4 data, this bias completely disappears in the new version 2 data. Residual differences between ILAS-II and MIPAS-B are now very small (mean absolute difference less than 6%; mean difference less than −2%).
The comparison for the temporary chlorine and nitrogen reservoir species ClONO2 is shown in Fig. 8. The profile
shape measured by MIPAS-B exhibiting high amounts of ClONO2of up to 2.3 ppbv, which are typical for the late
arc-tic winter vortex after passivation of active chlorine, is nicely reproduced by ILAS-II. Except the highest altitude region around 30 km where some deviations between ILAS-II and MIPAS-B are visible, the agreement between both sensors is excellent. The mean absolute difference is less than 10%.
The comparison of the short-lived nitrogen species NO2is
given in Fig. 9. As for HNO3, spectroscopic NO2updates
in the HITRAN databases had to be taken into account when performing the MIPAS-B retrieval. The molecule NO2
ex-hibits a strong diurnal variation in the stratosphere and is in photochemical equilibrium with NO and N2O5. To balance
these temporal variations the MIPAS-B results have been photochemically transferred to the time and location of the ILAS-II observations with the help of the three-dimensional
35 30 25 20 15 10 0.0 0.5 1.0 1.5 2.0 2.5 3.0 35 30 25 20 15 10 0.0 0.5 1.0 1.5 2.0 2.5 3.0 -2.0 -1.0 0.0 1.0 2.0 10 15 20 25 30 35 -2.0 -1.0 0.0 1.0 2.0 Kiruna, 20 March 2003: MIPAS-B (22:06 UTC) ILAS-II v1.4 (16:23 UTC) ILAS-II v2 (16:23 UTC) ClONO
2 Volume Mixing Ratio (ppbv)
Altitude (km)
ILAS-II - MIPAS-B Difference (solid) Comb. Err. (dashed)
mean abs. difference:
v1.4: 0.17 ppbv (19.0%)
v2: 0.09 ppbv ( 8.6%)
Diff./Err. (ppbv)
Fig. 8. Comparison of ClONO2profiles as measured by MIPAS-B
and ILAS-II. Annotation as per Fig. 1.
35 30 25 20 15 10 0 1 2 3 4 5 35 30 25 20 15 10 0 1 2 3 4 5 -2 -1 0 1 2 10 15 20 25 30 35 -2 -1 0 1 2 Kiruna, 20 March 2003: MIPAS-B HIT-2k (22:06 UTC) MIPAS-B HIT-2004 (22:06 UTC) ILAS-II v1.4 (16:23 UTC) ILAS-II v2 (16:23 UTC)
NO
2 Volume Mixing Ratio (ppbv)
Altitude (km)
mean abs. difference:
v1.4: 0.98 ppbv (120.7%)
v2: 0.65 ppbv ( 79.0%)
ILAS-II - MIPAS-B Difference (solid) Comb. Err. (dashed)
Diff./Err. (ppbv)
Fig. 9. Comparison of NO2 profiles as measured by MIPAS-B and ILAS-II. MIPAS-B NO2was retrieved with HITRAN 2k
(HIT-2k) and HITRAN 2004 (HIT-2004) spectroscopic data bases which have been used for the ILAS-II version 1.4 and 2 data retrievals, respectively. MIPAS-B mixing ratios have been photochemically corrected to the time and location of ILAS-II observations. Anno-tation as per Fig. 1.
Chemistry Transport Model (CTM) KASIMA (Karlsruhe Simulation model of the Middle Atmosphere; Kouker et al., 1999). The model was run in a 2.0◦
×2.0◦ horizontal
reso-lution. The MIPAS-B NO2values were corrected by
scal-ing them with the altitude dependent NO2ratio determined
from the modelled NO2profiles for the measurement times
and locations of both sensors. In spite of the photochemical correction, a significant negative bias of up to about 1 ppbv is visible regarding the ILAS-II version 2 data. Investiga-tions of the influence of different photolysis rates used in the CTM can only account for about 4% mean absolute differ-ences in NO2 above 22 km (Wetzel et al., 2006). It should
1124 G. Wetzel et al.: ILAS-II intercomparison with MIPAS-B
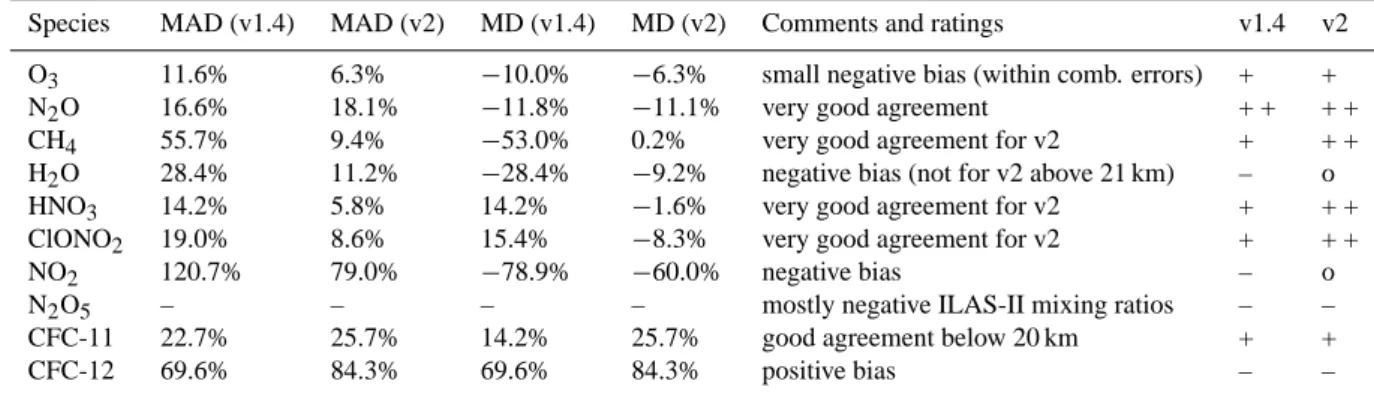
Table 1. Quality of agreement of ILAS-II data versions 1.4 (v1.4) and 2 (v2) compared to MIPAS-B independent observations on 20 March
2003. Results are given for different species; mean absolute difference (MAD), mean difference (MD), comments and ratings (++ very good; + good; o fair; – poor) are summarized. Mean difference values are calculated over all coincident altitudes.
Species MAD (v1.4) MAD (v2) MD (v1.4) MD (v2) Comments and ratings v1.4 v2 O3 11.6% 6.3% −10.0% −6.3% small negative bias (within comb. errors) + +
N2O 16.6% 18.1% −11.8% −11.1% very good agreement + + + +
CH4 55.7% 9.4% −53.0% 0.2% very good agreement for v2 + + +
H2O 28.4% 11.2% −28.4% −9.2% negative bias (not for v2 above 21 km) – o
HNO3 14.2% 5.8% 14.2% −1.6% very good agreement for v2 + + +
ClONO2 19.0% 8.6% 15.4% −8.3% very good agreement for v2 + + +
NO2 120.7% 79.0% −78.9% −60.0% negative bias – o
N2O5 – – – – mostly negative ILAS-II mixing ratios – –
CFC-11 22.7% 25.7% 14.2% 25.7% good agreement below 20 km + +
CFC-12 69.6% 84.3% 69.6% 84.3% positive bias – – 35 30 25 20 15 10 0 50 100 150 200 250 300 35 30 25 20 15 10 0 50 100 150 200 250 300 -200 0 200 10 15 20 25 30 35 -200 0 200 Tropospheric value Kiruna, 20 March 2003: MIPAS-B (22:06 UTC) ILAS-II v1.4 (16:23 UTC) ILAS-II v2 (16:23 UTC)
CFC-11 Volume Mixing Ratio (pptv)
Altitude (km)
ILAS-II - MIPAS-B Difference (solid) Comb. Err. (dashed)
mean abs. difference:
v1.4: 13.8 pptv (22.7%)
v2: 11.8 pptv (25.7%)
Diff./Err. (pptv)
Fig. 10. Comparison of CFC-11 profiles as measured by MIPAS-B
and ILAS-II. The Northern Hemispheric tropospheric value of 2003 is marked by a black half circle. Annotation as per Fig. 1.
be mentioned that no corrections of variations of the solar zenith angle along the line of sight of ILAS-II were per-formed. This may introduce some inaccuracies in the ILAS-II NO2data. Payan et al. (1999) estimated such VMR errors
for infrared solar occultation measurements to less than 6%. These effects can therefore only partly help to explain the remaining differences between ILAS-II and MIPAS-B mea-sured quantities (particularly below about 27 km where the diurnal variation of NO2decreases). Here, ILAS-II Northern
Hemispheric sunrise data are being discussed. In contrast, Randall et al. (2007) used ILAS-II version 2 Southern Hemi-spheric sunset NO2 data for their studies. They found this
data in qualitative agreement with NO2measured by POAM
III, although they also noticed a small negative bias in the ILAS-II mixing ratios compared to the POAM III observa-tions. 35 30 25 20 15 10 0 100 200 300 400 500 600 35 30 25 20 15 10 0 100 200 300 400 500 600 -200 0 200 10 15 20 25 30 35 -200 0 200 Tropospheric value Kiruna, 20 March 2003: MIPAS-B (22:06 UTC) ILAS-II v1.4 (16:23 UTC) ILAS-II v2 (16:23 UTC)
CFC-12 Volume Mixing Ratio (pptv)
Altitude (km)
ILAS-II - MIPAS-B Difference (solid) Comb. Err. (dashed)
mean abs. difference:
v1.4: 115.8 pptv (69.6%)
v2: 125.9 pptv (84.3%)
Diff./Err. (pptv)
Fig. 11. Comparison of CFC-12 profiles as measured by MIPAS-B
and ILAS-II. The Northern Hemispheric tropospheric value of 2003 is marked by a black half circle. Annotation as per Fig. 1.
As mentioned above, NO2is also photochemically linked
with N2O5such that the latter species exhibits a diurnal
vari-ation, too. This has to be taken into account when compar-ing N2O5data of both sensors. However, although ILAS-II
N2O5mixing ratios of the new version 2 have increased
com-pared to the old version 1.4 (leading to a smaller negative bias compared to MIPAS-B) they are still less than zero except at the altitude region near 30 km. Hence, a sound comparison to MIPAS-B measured N2O5quantities is not yet meaningful
for this molecule.
3.5 Chlorofluorocarbons
Figures 10 and 11 show the retrieved volume mixing ra-tios of the important chlorine source gases CFC-11 (CCl3F)
and CFC-12 (CCl2F2). For the species CFC-11, the
agree-ment between ILAS-II and MIPAS-B is pretty good below
20 km altitude. The increase of ILAS-II CFC-11 mixing ra-tios above 20 km which is not visible in the MIPAS-B data is far less pronounced in the newer data version and not sig-nificant with regard to the large error bars which seem to be overestimated for this molecule.
An increase of volume mixing ratios above 23 km is also seen in the new ILAS-II data version of the retrieved CFC-12 profile. Such an increase does not appear to be realistic be-cause mixing ratios reach more than 500 pptv at 35 km which corresponds to tropospheric values. The increase is also not visible in the MIPAS-B data. Below 22 km a significant pos-itive bias of at least 100 pptv in both ILAS-II data versions is clearly visible.
4 Conclusions
The intercomparison of ILAS-II trace species to MIPAS-B measurements has shown that the overall agreement between both sensors has significantly been improved for the new ILAS-II (Northern Hemispheric sunrise) data version 2 in comparison to the older version 1.4. This is fully consistent with the recent findings of Griesfeller et al. (2008) who com-pared ILAS-II H2O, N2O, CH4, O3, HNO3, and ClONO2
data to MIPAS on ENVISAT. A summary of the assessment of the individual comparisons is given in Table 1. For the species O3, N2O, CH4, HNO3, ClONO2, and CFC-11 a good
to excellent agreement between MIPAS-B and ILAS-II ver-sion 2 data could be identified in the compared altitude re-gion between 16 and 31 km. Hence, the new data version 2 of these molecules appears to be very useful for scientific studies. For the species H2O, a good agreement has been
achieved for altitudes above 21 km (version 2 data) while for altitudes below a significant negative bias of about 1 ppmv is still obvious. ILAS-II NO2 and N2O5 are widely
char-acterized by negative biases compared to MIPAS-B results although the magnitude of the biases has decreased from ILAS-II version 1.4 to version 2 data. In contrast, CFC-12 is still marked by a positive bias in comparison to the balloon-borne observations. Hence, these latter gases cannot be as-sumed to be validated at the present time. Reasons for these observed deviations are still speculative and need further in-vestigations. It should be mentioned that these gases provide only minor contributions to the transmittance spectrum in the low-resolution ILAS-II infrared channels and their spec-tral signatures are overlapped by strongly interfering gases. Hence, their detection and analysis is quite difficult given the ILAS-II spectral resolution.
Acknowledgements. We are grateful to the Centre National
d’Etudes Spatiales (CNES) launching team for excellent balloon operations, the Esrange team of the Swedish Space Corporation (SSC) for logistical support and the Free University of Berlin for meteorological support (especially K. Grunow). This work was funded in part by the Bundesministerium f¨ur Bildung und Forschung (BMBF), the European Space Agency (ESA), and the
Global Environment Research Fund (GERF) of the Ministry of the Environment, Japan (MOE).
Edited by: U. P¨oschl
References
Cortesi, U., Lambert, J. C., De Clercq, C., Bianchini, G., Blumen-stock, T., Bracher, A., Castelli, E., Catoire, V., Chance, K. V., De Mazi`ere, M., Demoulin, P., Godin-Beekmann, S., Jones, N., Jucks, K., Keim, C., Kerzenmacher, T., Kuellmann, H., Kuttip-purath, J., Iarlori, M., Liu, G. Y., Liu, Y., McDermid, I. S., Mei-jer, Y. J., Mencaraglia, F., Mikuteit, S., Oelhaf, H., Piccolo, C., Pirre, M., Raspollini, P., Ravegnani, F., Reburn, W. J., Redaelli, G., Remedios, J. J., Sembhi, H., Smale, D., Steck, T., Taddei, A., Varotsos, C., Vigouroux, C., Waterfall, A., Wetzel, G., and Wood, S.: Geophysical validation of MIPAS-ENVISAT opera-tional ozone data, Atmos. Chem. Phys., 7, 4807–4867, 2007, http://www.atmos-chem-phys.net/7/4807/2007/.
Engel, A., Schiller, C., Schmidt, U., Borchers, R., Ovarlez, H., and Ovarlez, J.: The total hydrogen budget in the Arctic winter strato-sphere during the European Arctic Stratospheric Ozone Experi-ment, J. Geophys. Res., 101, 14 495–14 503, 1996.
Engel, A., M¨obius, T., Haase, H.-P., B¨onisch, H., Wetter, T., Schmidt, U., Levin, I., Reddmann, T., Oelhaf, H., Wetzel, G., Grunow, K., Huret, N., and Pirre, M.: Observation of meso-spheric air inside the arctic stratomeso-spheric polar vortex in early 2003, Atmos. Chem. Phys., 6, 267–282, 2006,
http://www.atmos-chem-phys.net/6/267/2006/.
Friedl-Vallon, F., Maucher, G., Kleinert, A., Lengel, A., Keim, C., Oelhaf, H., Fischer, H., Seefeldner, M., and Trieschmann, O.: Design and characterization of the balloon-borne Michelson Interferometer for Passive Atmospheric Sounding (MIPAS-B2), Appl. Optics, 43, 3335–3355, 2004.
Griesfeller, A., von Clarmann, T., Griesfeller, J., H¨opfner, M., Milz, M., Nakajima, H., Steck, T., Sugita, T., Tanaka, T., and Yokota, T.: Intercomparison of ILAS-II Version 1.4 and Version 2 target parameters with MIPAS-Envisat measurements, Atmos. Chem. Phys., 8, 825–843, 2008,
http://www.atmos-chem-phys.net/8/825/2008/.
Herman, R. L., Drdla, K., Spackman, J. R., Hurst, D. F., Popp, P. J., Webster, C. R., Romashkin, P. A., Elkins, J. W., Weinstock, E. M., Gandrud, B. W., Toon, G. C., Schoeberl, M. R., Jost, H., Atlas, E. L., and Bui, T. P.: Hydration, dehydration, and the to-tal hydrogen budget of the 1999/2000 winter Arctic stratosphere, J. Geophys. Res., 108(D5), 8320, doi:10.1029/2001JD001257, 2002.
H¨opfner, M., Oelhaf, H., Wetzel, G., Friedl-Vallon, F., Klein-ert, A., Lengel, A., Maucher, G., Nordmeyer, H., Glatthor, N., Stiller, G., von Clarmann, T., Fischer, H., Kr¨oger, C., and Deshler, T.: Evidence of scattering of tropospheric radiation by PSCs in mid-IR limb emission spectra: MIPAS-B observa-tions and KOPRA simulaobserva-tions, Geophys. Res. Lett., 29(8), 1278, doi:10.1029/2001GL014443, 2002.
H¨opfner, M., von Clarmann, T., Fischer, H., Funke, B., Glatthor, N., Grabowski, U., Kellmann, S., Kiefer, M., Linden, A., Milz, M., Steck, T., Stiller, G. P., Bernath, P., Blom, C. E., Blumen-stock, Th., Boone, C., Chance, K., Coffey, M. T., Friedl-Vallon, F., Griffith, D., Hannigan, J. W., Hase, F., Jones, N., Jucks, K.
1126 G. Wetzel et al.: ILAS-II intercomparison with MIPAS-B W., Keim, C., Kleinert, A., Kouker, W., Liu, G. Y., Mahieu, E.,
Mellqvist, J., Mikuteit, S., Notholt, J., Oelhaf, H., Piesch, C., Reddmann, T., Ruhnke, R., Schneider, M., Strandberg, A., Toon, G., Walker, K. A., Warneke, T., Wetzel, G., Wood, S., and Zan-der, R.: Validation of MIPAS ClONO2 measurements, Atmos.
Chem. Phys., 7, 257–281, 2007,
http://www.atmos-chem-phys.net/7/257/2007/.
Kouker, W., Langbein, I., Reddmann, T., and Ruhnke, R.: The Karl-sruhe simulation model of the middle atmosphere (KASIMA), version 2, Rep. FZKA 6278, Forschungszentrum Karlsruhe GmbH, Karlsruhe, Germany, 1999.
Michelsen, H. A., Manney, G. L., Gunson, M. R., and Zander, R.: Correlations of stratospheric abundances of NOy, O3, N2O,
and CH4derived from ATMOS measurements, J. Geophys. Res.,
103, 28 347–28 359, 1998.
Nakajima, H., Sugita, T., Yokota, T., Ishigaki, T., Mogi, Y., Araki, N., Waragai, K., Kimura, N., Iwazawa, T., Kuze, A., Tanii, J., Kawasaki, H., Horikawa, M., Togami, T., Uemura, N., Kobayashi, H., and Sasano, Y.: Characteristics and performance of the Improved Limb Atmospheric Spectrometer-II (ILAS-II) on board the ADEOS-II satellite, J. Geophys. Res., 111, D11S01, doi:10.1029/2005JD006334, 2006.
Payan, S., Camy-Peyret, C., Jeseck, P. Hawat, T., Pirre, M., Re-nard, J.-B., Robert, C., Lef`evre, F., Kanzawa, H., and Sasano, Y.: Diurnal and nocturnal distribution of stratospheric NO2from
solar and stellar occultation measurements in the Arctic vortex: Comparison with models and ILAS satellite measurements, J. Geophys. Res., 104, 21 585–21 593, 1999.
Randall, C. E., Harvey, V. L., Singleton, C. S., Bailey, S. M., Bernath, P. F., Codrescu, M., Nakajima, H., and Russell III, J. M.: Energetic particle precipitation effects on the Southern Hemisphere stratosphere in 1992–2005, J. Geophys. Res., 112, D08308, doi:10.1029/2006JD007696, 2007.
Ridolfi, M., Blum, U., Carli, B., Catoire, V., Ceccherini, S., Claude, H., De Clercq, C., Fricke, K. H., Friedl-Vallon, F., Iarlori, M., Keckhut, P., Kerridge, B., Lambert, J.-C., Meijer, Y. J., Mona, L., Oelhaf, H., Pappalardo, G., Pirre, M., Rizi, V., Robert, C., Swart, D., von Clarmann, T., Waterfall, A., and Wetzel, G.: Geophysical validation of temperature retrieved by the ESA pro-cessor from MIPAS/ENVISAT atmospheric limb-emission mea-surements, Atmos. Chem. Phys., 7, 4459–4487, 2007,
http://www.atmos-chem-phys.net/7/4459/2007/.
Rothman, L. S., Barbe, A., Benner, D. C., et al.: The HITRAN molecular spectroscopic database: edition of 2000 including up-dates through 2001, J. Quant. Radiat. Transfer, 82, 5–44, 2003. Rothman, L. S., Jacquemart, D., Barbe, A., et al.: The HITRAN
2004 molecular spectroscopic database, J. Quant. Spectrosc. Ra-diat. Transfer, 96, 139–204, 2005.
Sasano, Y., Suzuki, M., Yokota, T., and Kanzawa, H.: Improved Limb Atmospheric Spectrometer (ILAS) for stratospheric ozone layer measurements by solar occultation technique, Geophys. Res. Lett., 26, 197–200, 1999.
Stiller, G. P., von Clarmann, T., Funke, B., Glatthor, N., Hase, F., H¨opfner, M., and Linden, A.: Sensitivity of trace gas abundances retrievals from infrared limb emission spectra to simplifying ap-proximations in radiative transfer modeling, J. Quant. Spectrosc. Radiat. Transfer, 72(3), 249–280, 2002.
Tanaka, T., Nakajima, H., Sugita, T., Ejiri, M. K., Irie, H., Saitoh, N., Terao, Y., Kawasaki, H., Usami, M., Yokota, T., Kobayashi, H., and Sasano, Y.: Tangent height registration method for the Version 1.4 data retrieval algorithm of the solar occultation sen-sor ILAS-II, Appl. Optics, 46, 7196–7201, 2007.
Wang, D. Y., H¨opfner, M., Blom, C. E., Ward, W. E., Fischer, H., Blumenstock, T., Hase, F., Keim, C., Liu, G. Y., Mikuteit, S., Oelhaf, H., Wetzel, G., Cortesi, U., Mencaraglia, F., Bianchini, G., Redaelli, G., Pirre, M., Catoire, V., Huret, N., Vigouroux, C., De Mazi`ere, M., Mahieu, E., Demoulin, P., Wood, S., Smale, D., Jones, N., Nakajima, H., Sugita, T., Urban, J., Murtagh, D., Boone, C. D., Bernath, P. F., Walker, K. A., Kuttippurath, J., Kleinb¨ohl, A., Toon, G., and Piccolo, C.: Validation of MIPAS HNO3 operational data, Atmos. Chem. Phys., 7, 4905–4934,
2007,
http://www.atmos-chem-phys.net/7/4905/2007/.
Wetzel, G., Oelhaf, H., Friedl-Vallon, F., Kleinert, A., Lengel, A., Maucher, G., Nordmeyer, H., Ruhnke, R., Nakajima, H., Sasano, Y., Sugita, T., and Yokota, T.: Intercompari-son and validation of ILAS-II version 1.4 target parameters with MIPAS-B measurements, J. Geophys. Res., 111, D11S06, doi:10.1029/2005JD006287, 2006.
Wetzel, G., Bracher, A., Funke, B., Goutail, F., Hendrick, F., Lam-bert, J.-C., Mikuteit, S., Piccolo, C., Pirre, M., Bazureau, A., Be-lotti, C., Blumenstock, T., De Mazi`ere, M., Fischer, H., Huret, N., Ionov, D., L´opez-Puertas, M., Maucher, G., Oelhaf, H., Pommereau, J.-P., Ruhnke, R., Sinnhuber, M., Stiller, G., Van Roozendael, M., and Zhang, G.: Validation of MIPAS-ENVISAT NO2operational data, Atmos. Chem. Phys., 7, 3261–3284, 2007,
http://www.atmos-chem-phys.net/7/3261/2007/.
Yokota, T., Nakajima, H., Sugita, T., Tsubaki, H., Itou, Y., Kaji, M., Suzuki, M., Kanzawa, H., Park, J. H., and Sasano, Y.: Im-proved Limb Atmospheric Spectrometer (ILAS) data retrieval al-gorithm for Version 5.20 gas profile products, J. Geophys. Res., 107, 8216, doi:10.1029/2001JD000628, 2002.