HAL Id: hal-00317962
https://hal.archives-ouvertes.fr/hal-00317962
Submitted on 23 Mar 2006
HAL is a multi-disciplinary open access
archive for the deposit and dissemination of
sci-entific research documents, whether they are
pub-lished or not. The documents may come from
teaching and research institutions in France or
abroad, or from public or private research centers.
L’archive ouverte pluridisciplinaire HAL, est
destinée au dépôt et à la diffusion de documents
scientifiques de niveau recherche, publiés ou non,
émanant des établissements d’enseignement et de
recherche français ou étrangers, des laboratoires
publics ou privés.
J. Wanliss
To cite this version:
J. Wanliss. Substorm onset location and dipole tilt angle. Annales Geophysicae, European Geosciences
Union, 2006, 24 (2), pp.577-588. �hal-00317962�
www.ann-geophys.net/24/577/2006/ © European Geosciences Union 2006
Annales
Geophysicae
Substorm onset location and dipole tilt angle
J. Wanliss
Department of Physical Sciences, Embry-Riddle Aeronautical University, Daytona Beach, Florida, USA
Received: 16 July 2005 – Revised: 19 December 2005 – Accepted: 21 December 2005 – Published: 23 March 2006
Abstract. From an initial data set of over 200 substorms we have studied a subset of 30 magnetospheric substorms close to magnetic midnight to investigate, in a statistical fashion, the source region of the auroral arc that brightens at the onset of expansive phase. This arc is usually identified as the iono-spheric signature of the expansive phase onset that occurs in the magnetotail. All the substorm onsets were identified via ground-based magnetometer and photometer data from the CANOPUS array. Various Tsyganenko global magnetic field models were used to map magnetic field lines from the lo-cation of the onset arc out to its greatest radial distance in the magnetotail. The results appear to favour the current dis-ruption model of substorms since the average onset location has an average of 14.1 Earth radii (RE) and is therefore more
consistent with theories that place the onset location in the inner magnetotail. For the narrow range of tilts available our modeling indicates the parameter that appears to strongly in-fluence the location of the substorm onset is the dipole tilt an-gle; as tilt becomes less negative onsets occur further down-tail.
Keywords. Magnetospheric physics (Magnetotail; Solar wind-magnetosphere interactions; Storms and substorms)
1 Introduction
Magnetospheric substorms feature localized but highly dy-namic activity in the magnetosphere-ionosphere system. Ob-servations show that substorm activity includes the stretch-ing and subsequent dipolarization of magnetic field lines, particle injections at geosynchronous orbit, fast magnetotail plasma flows, development of ionospheric currents and in-tensifications thereof, auroral brightenings with steady equa-torward motion followed by rapid intensification and pole-ward motion, and geomagnetic pulsations (Samson et al., 1992; Baker et al., 1996; Reeves and Henderson, 2001; Reeves et al., 2003; Baker and Li, 2003). The most dramatic fingerprint of the magnetospheric substorm occurs at the on-set of expansive phase, characterized in its ionospheric foot-print by the explosive brightening and dynamic motion of the
Correspondence to: J. Wanliss
most equatorward auroral arc (Samson et al., 1992; Samson, 1994). Substorms comprise a sequence of dynamic events in the magnetosphere of the Earth, usually associated with the initiation of intense auroral displays at high latitudes. They begin with a growth phase, during which energy is stored in the magnetotail in the form of increased magnetic flux. Fol-lowing this the expansive phase onset is heralded by rapid dissipation of this stored tail energy in the form of enhanced Joule heating and particle precipitation in the ionosphere, and particle acceleration and transport in the magnetotail. Recov-ery phase is identified by a return of magnetospheric activity to pre-growth phase levels. In terms of a space weather point of view understanding the dynamics of magnetospheric sub-storms is crucial, especially for the expansive phase, because substorms are phenomena associated primarily with the inner magnetosphere, a region where most operational spacecraft reside.
In the past numerous event studies considered the location in the magnetotail of the expansive phase ignition site or zone (Samson et al., 1992; Pulkkinen et al., 1991, 1995; Kubyshk-ina et al., 1999; Erickson et al., 2000; Frank and Sigwarth, 2000; Dubyagin, 2003). Several of these studies used satel-lite data and the Tsyganenko models to study various aspects related to substorms, for example to map ionospheric auro-ral brightenings to the distant location in the magnetotail. The statistical samples were very small, so for example, in their work Pulkkinen et al. (1995) found it difficult to paint a coherent picture in mapping of individual substorm auro-ral arcs. While event studies have included estimates of the magnetospheric location of the onset initiation, there is no published report of statistically large and systematic studies that use magnetospheric models to accurately locate the on-set site. Neither have there been systematic studies to deter-mine magnetotail onset location as a function of solar cycle, or dipole tilt, which affect the spatial location of important magnetospheric parameters (Zhou et al., 1999). In this pa-per these issues will be addressed through the use of data from a large number of substorms compiled over the most recent solar cycle. Ground-based optical data will be used to determine onset locations since substorm onsets are most reliably determined through the simultaneous use of both of these data types (Liou et al., 1999; Friedrich et al., 2001).
Even though it has been the subject of many studies the mechanism that triggers expansive phase onset, and its mag-netospheric location, remains unresolved. Distinguishing be-tween the competing models has been difficult because of the lack of data and partly because most studies use moments that are rarely interpreted in terms of kinetic effects. The near-Earth neutral line model (NENL) proposes that a neu-tral line is formed a few minutes prior to onset, between 22 to 30 RE). The neutral line causes acceleration of plasma
towards the earth. When this flux encounters pressure gra-dients from the strong dipole magnetic field, a flux pile-up occurs that causes an instability and expansive phase onset (Birn and Hesse, 1996; Shiokawa et al., 1997; Baumjohann et al., 1999; Sch¨odel at al., 2001). A competing model, the current disruption model (CD), proposes that expansive phase onset begins via a current disruption near geosyn-chronous orbit, followed by the tailward expansion of the current disruption region toward the site of the neutral line in the midtail (Lui, 1991; Ohtani, 1992; Samson, 1998).
The magnetospheric location of the expansive phase onset is important since mechanisms that may be responsible for the onset of instability, for example the Kelvin-Helmholtz instability (Yoon et al., 1996) or the kinetic ballooning insta-bility (Cheng and Lui, 1998), to name only two possible can-didates, are strongly dependent upon spatially variable pa-rameters such as plasma density and magnetic field strength. Frank and Sigwarth (2000) and Erickson et al. (2000) used the Polar and CRRES satellites, respectively, to present evi-dence that expansive phase is triggered as close as 4 to 7 RE
from the Earth. This was in addition to the evidence from ground-based data presented by Samson et al. (1992), which suggested expansive phase onset occurs between 6 to 10 RE.
Recently, Dubyagin et al. (2003) used data from the FAST satellite and ground-based instruments, along with a map-ping via the Tsyganenko magnetic field model (Tsyganenko, 1995) to provide evidence of a near-earth breakup location. Jayachandran et al. (2002) investigated the ionospheric lo-cation for a large sample of individual substorm events de-termined from radar. They found that substorms can be ini-tiated near the equatorward boundary of the proton auroral oval, when the interplanetary magnetic field (IMF) is pre-dominantly southward during the growth phase. However, if the IMF was predominantly northward during growth phase, onset occurred far poleward of the equatorward boundary of the proton auroral oval. All indications are that the onset lo-cation is usually very close to the Earth.
Auroral particle precipitations and their resulting lumi-nosity signatures form an important key to understanding aspects of coupling between the magnetosphere and iono-sphere. Since magnetic field lines in the magnetosphere and ionosphere are topologically connected, in some sense the ionospheric luminosity variations at high latitudes can be thought of as a screen to monitor magnetospheric ac-tivity. Charged particles are strongly affected by the ge-omagnetic field, thus the ionospheric location where these
particles precipitate can be used to provide important infor-mation about their source in the magnetosphere. The config-uration of the magnetosphere determines how particles move in the magnetosphere, and changes in that configuration can contribute to particle acceleration. The ionospheric footprint of the auroral substorm onset indicates the location of one end of a magnetic field line that ultimately maps to the ig-nition region in the magnetotail. A minimum requirement for high quality mapping is accurate magnetospheric mod-els since the geometry of the magnetosphere implies that small ionospheric footprints, especially at high latitudes, can map to large spatial regions in the magnetosphere. Impre-cise magnetic field models can result in predictions of igni-tion site locaigni-tion that are wayward by many earth radii. The difficulty in pinpointing the ignition site exists because sin-gle spacecraft in the magnetosphere cannot reliably locate and time the onset, and two-dimensional ionospheric obser-vations must rely on magnetospheric models to map along magnetic field lines.
Rather than considering detailed event studies, this paper describes the extension of mapping efforts that include mul-tiple substorms from an ionospheric perspective. As was the case for previous small sample event studies (e.g. Samson et al., 1992; Pulkkinen et al., 1991, 1995; Lu et al., 1999; Erick-son et al., 2000; Frank and Sigwarth, 2000; Dubyagin, 2003), we trace back from the ionosphere along the magnetic field lines to pinpoint the magnetospheric location of the ignition site. Although it is difficult to accurately map the onset loca-tion to the magnetotail, we believe that the statistical nature of the investigation will provide an average onset location consistent with reality. In addition, mapping of the onset arcs from the ionosphere to the plasma sheet was performed with several different models than those used in the studies men-tioned above. We employed the empirical magnetospheric magnetic field models of Tsyganenko (1987; 1989; 1995; 2002a, b), and make comparisons between mappings pro-duced by the various models (hereinafter referred to as T87, T89, T96, T01).
2 Data selection and analysis procedure
Data from the CANOPUS magnetometer and photometer ar-rays (Rostoker et al., 1995) were used to identify the lo-cation of substorm expansive phase onset. Most previous studies used Pi2 pulsations to determine onset (e.g. Nagai et al. (1998) and Miyashita et al. (1999) and references therein). But these signatures must be supplemented by additional techniques (Lui et al., 1998; Liou et al., 1999). Friedrich et al. (2001) accurately determined onsets via a combina-tion of Pi2 signatures, ground magnetic latitude profiles, and the onset of dipolarization as observed in the 486.1 nm pro-ton emissions. Samson et al. (1992) showed that 486.1 and 557.7-nm emissions from auroral photometers are an ex-cellent visual source for timing onset, with a resolution of
∼1 min. This, along with the Pi2 signatures was used as our criteria.
All the events studied here were “isolated” in the sense that the substorms featured a broad period of quiescence prior to the growth and expansive phases. Next, the growth phases all featured no significant activity such as pseudobreakups prior to expansive phase onset, or PBIs close to the onset time. Substorms are associated with a localized region of auroral enhancement that initiates inside the equatorward region of the nightside auroral oval. At onset this region expands pole-ward and azimuthally. The electron arc that brightens at the expansive phase onset is located in the region of intense pro-ton aurora (486.1 nm). PBIs are different from substorms in that they are localized in longitude and move equatorward. They do not expand poleward and azimuthally as substorms do. They are thus a relatively local effect, compared to sub-storms. Their auroral signature typically moves equatorward from the magnetic separatrix (Lyons et al., 2000) and thus originate near the poleward edge of the 630.0-nm emissions (Blanchard et al., 1997). The ionospheric footprint of the plasma sheet can be approximated by the latitudinal extent of the 630.0-nm emission region (Samson, 1994). In conse-quence the relative latitudinal motions of the meridian scan-ning photometer 486.1, 557.7, and 630.0-nm emissions usu-ally allows one to discriminate between the different types of activity. Since the photometers are not necessarily always in the proximity of the actual auroral breakup, we chose to analyze events for which the substorm onset occurred within about 90 min of the Churchill line of the instrument array. Previous studies indicate that this allows the photometers a good view of the onset region and provides clear substorm signatures in the Churchill chain of eight magnetometer sta-tions. On this basis we selected a subset of 30 substorms from the original larger set of several hundred magneto-spheric substorms identified in a previous survey of 10 years of photometer data from the CANOPUS array.
As mentioned above, two approaches were followed to identify the substorms. Initially, substorms were identi-fied with data from the Gillam and Rankin photometer sta-tions. Their locations are, respectively, at (56.4◦, 265.4◦) and (62.8◦, 267.9◦) geographic latitude and longitude. Fig-ure 1 shows an example of data for one such substorm, mea-sured during the early hours of 15 November 1992. The photometer data are in the form of emission intensity ver-sus invariant latitude and time, and have a 1-min tempo-ral resolution. The top keogram shows Hβ emissions at 486.1 nm from precipitation of protons (tens of keV). The middle keogram shows emissions at 557.7 nm resulting from precipitation of high-energy electrons (several keV). The fi-nal keogram shows emissions at 630.0 nm from the precipita-tion of low-energy electrons (hundreds of eV). Growth phase features slow equatorward motion of the aurora.
To qualify as a substorm expansive phase onset, a clear brightening of the most equatorward auroral arc was re-quired, immediately followed by rapid poleward motion of
the aurora, which indicates dipolarization. For this event, expansive phase onset was at 05:33 UT, and the arc that brightened at onset had its center at about 67.2◦. The
on-set location is indicated by the black box. Brightening of the 557.7-nm emissions, from the high-energy precipitat-ing electrons, along with the poleward motion of the 486.1-nm proton emissions, is an excellent marker for expansive phase onset (Samson et al., 1992; Friedrich et al., 2001). Although other substorm onset identifiers exist, for exam-ple high-latitude magnetic bays, Pi2 pulsations, dispersion-less injections of high-energy particles, several recent stud-ies have shown that timing of onset via these identifiers alone is uncertain due to propagation-related delay (Ohtani, 1999; Liou et al., 1999, 2000, 2001); use of auroral breakup is prob-ably the most accurate of onset signatures. It is prudent not to rely on only one dataset to time expansive phase onset, so the second identifier used was the onset of Pi2 pulsations (not shown). Even though there are timing uncertainties as-sociated with propagation of Pi2 pulsations, these impulsive magnetic signatures, along with the optical indicators, fre-quently serve as an excellent source for timing the onset (Samson et al., 1992; Friedrich et al., 2001). Figure 2 il-lustrates the X-component magnetic data from the Churchill magnetometer line on 15 November 1992, with a clear neg-ative magnetic bay signature associated with the expansive phase onset. The bay is clearest in the BACK and FCHU station data.
3 Magnetic field models
The most widely used empirical magnetospheric models are those developed by N. A. Tsyganenko and his collabora-tors (Tsyganenko, 1987; Tsyganenko, 1989; Tsyganenko and Peredo, 1994; Tsyganenko, 1995; Tsyganenko, 1996; Tsyga-nenko, 2002ab). Since substorm time scales are so fast, and the Tsyganenko models are averages, it is not strictly appro-priate to use them to study substorms, even though they have been commonly used in this manner, as noted above by many references. During the expansive and recovery phases of sub-storms it is almost certainly inappropriate to use the Tsyga-nenko models, since this is when dramatic and highly dy-namic processes such as dipolarization and particle injections occur. But the growth phase is quite different. Steady equa-torward motion of the auroral oval during growth phase is associated with slow stretching of the inner magnetotail field (Voronkov et al., 1999). We assume that during the growth phase stretching of the tail and plasma sheet thinning take place without a major reconfiguration of magnetic field lines. This is not an unreasonable assumption, and several stud-ies have shown how this is consistent with data observations (Kaufmann, 1987; Wanliss et al., 2000). The important thing to note is that mapping is done during substorm growth phase when slow changes ensure that the models are most likely to provide results within reason. In the past numerous event
65 70 0 50 100 65 70 0 2 4 6 8 x 10⁴ 4:50 5:00 5:10 5:20 5:30 5:40 62 64 66 68 70 72 74 0 1000
Fig. 1. Meridian scanning photometer keograms from the Gillam photometer on 15 November 1992. The latitudes are expressed in AACGM coordinates, and the brightness scale is measured in Rayleighs. The top panel shows the 486.1-nm emissions, the middle panel shows the 557.7-nm emissions, and the bottom panel shows the 630.0-nm emissions. The location of the onset is indicated by the black boxes in the keograms. 4:50 5:00 5:10 5:20 5:30 5:40 X Time (UT) RANK ESKI FCHU BACK GILL ISLL PINA
Fig. 2. X-component magnetometer traces from the Churchill line of magnetometer stations on 15 November 1992. A large magnetic bay signature is observed just after 05:30 UT and is particularly clear in the FCHU and BACK data.
studies considered substorms and the location in the magne-totail of the expansive phase ignition site or zone (Samson et al., 1992; Pulkkinen et al., 1991, 1995; Lu et al., 1999; Kubyshkina et al., 1999; Erickson et al., 2000; Frank and Sigwarth, 2000; Dubyagin, 2003). As mentioned previously, the Tsyganenko models were used in several of these sub-storm studies.
For the purposes of this work we have used T87 (Tsyga-nenko, 1987), T89 (Tsyga(Tsyga-nenko, 1989), T96 (Tsyga(Tsyga-nenko, 1996), and T01 (Tsyganenko, 2002a, b). T01 is supposed to be the most realistic model, especially in mapping the in-ner magnetotail. We used the other models since T01 is only
strictly valid earthward of 15 RE, and onset sites could be
further downtail where the other models are valid. Secondly, even though T01 is ostensibly the best model, it is also the least used. It was not used in any of the event studies listed above, so the results found here could cast a different light on previous work.
Whereas the models prior to T96 did not have a pre-defined magnetopause and were calibrated exclusively by the magnetic dipole tilt and Kp index, the T96 and T01 mod-els explicitly include (i) the solar-wind controlled magne-topause, (ii) region 1 and 2 Birkeland currents, and (iii) the interconnection of the magnetospheric and solar wind fields at the boundary. They include further parameterization with the solar wind dynamic pressure, DST-index, and interplan-etary magnetic field Byand Bz.
The earlier models appear to be too stretched in the inner magnetosphere as compared to in-situ observations, partic-ularly during active times. The most recent model, namely T01, is probably the best suited to determine onset locations, since previous observations suggest that substorm onset oc-curs in the inner magnetotail. In fact, T01 was intended primarily to improve the description of the inner magneto-spheric field (X>–15 RE), and unlike the previous models,
includes in the modeling database measurements from within geostationary orbit. T01 follows the same approach as in T96, but uses an improved approximation for the ring cur-rent field (Tsyganenko, 2000).
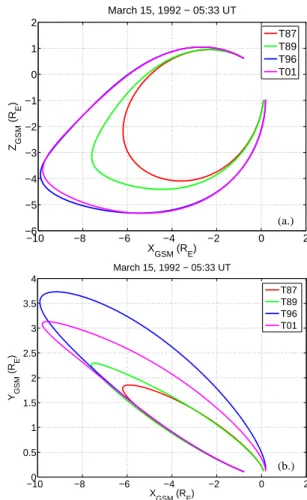
Figure 3 shows two different cross-sectional views of model magnetic field lines that map from the ionospheric onset position for the 15 November 1992 substorm. The
magnetospheric source of the auroral precipitation is under-stood to map along the corresponding magnetic field line to its greatest radial distance from the Earth. The T87 and T89 models map much closer than do the T96 and T01 models. The latter two models include field-aligned currents which may be responsible for the mapping differences. Further-more, when mappings are so close to the Earth, it has been shown that T87 and T89 require modifications to take into ac-count the behavior of the inner magnetotail and plasma sheet, which call into question the validity of these earlier models unless suitably modified during late growth phase (Pulkki-nen, 1991; Pulkkinen et al., 1995; 1999).
4 Statistical results
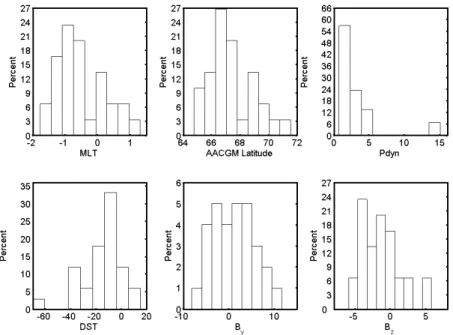
We performed similar fits as shown above for each of the 30 substorms. Figure 4 shows the distribution of the data for the various variables. The majority of the onsets oc-curred pre-midnight (71%), between 65◦–72◦ in AACGM coordinates (Baker and Wing, 1989). The range for DST was between –40 nT and +15 nT for 96% of the data. This means that the vast majority of the substorms we analyzed do not occur during storms. At the time of onset the interplanetary magnetic field, propagated to the magnetopause, had values for Bybetween –10 nT and +10 nT, and Bzranges between –
5 nT and +5 nT. There is a slight tendency for Bz<0 nT. The
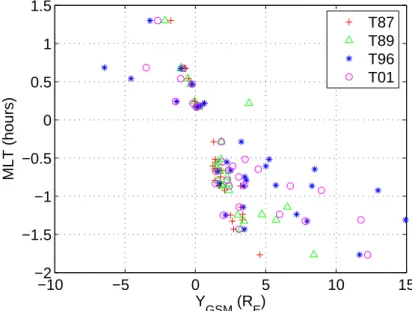
dynamic pressure was predominantly less than 5 nPa (94%). Figures 5–9 show how the onset locations are influenced by the various independent parameters. In Fig. 5 the model onset locations are projected onto the X-Y plane. Uncertain-ties are also indicated; these were computed by mapping the field lines from the ionosphere that were 0.25◦poleward and equatorward of the arc that brightens at onset. Several inter-esting features are immediately evident; for all models 77% of the onsets occur on the dusk side of the magnetotail, and each of the pre-midnight onsets map to the dusk side. This means that about 20% of the postmidnight onsets also map to the dusk side. There is therefore a small, but clear preference for substorms to be initiated in the dusk side magnetotail. This dependence is made more clear in Fig. 6 which shows the onset location for the dawn-dusk coordinate (Y) against magnetic local time. Best fit straight-lines were least-squares fit to these data, and there were strong linear correlations for these data; correlation coefficients were –0.96, –0.84, –0.78, –0.81 for T87, T89, T96, T01, respectively. The relation-ship is clearest for T87 and T89, but not so clear for MLT<– 1 h before midnight for T96 and T01. In general, the best fit straight-lines indicate that for all models, substorms that are initiated before 30 min after midnight are initiated on the dusk side of the magnetotail (Y>0). This is an interesting result that indicates some twisting or asymmetry of the mag-netotail. Whereas all of the onsets for T87 and T89 occur relatively close to the Earth (within 19 RE), the more recent
−10 −8 −6 −4 −2 0 2 −6 −5 −4 −3 −2 −1 0 1 2 X GSM (RE) ZGSM (R E ) March 15, 1992 − 05:33 UT T87 T89 T96 T01 −100 −8 −6 −4 −2 0 2 0.5 1 1.5 2 2.5 3 3.5 4 X GSM (RE) YGSM (R E ) March 15, 1992 − 05:33 UT T87 T89 T96 T01 (a.) (b.)
Fig. 3. Meridian plots of the model magnetic field lines mapped from the ionospheric onset location to the magnetotail for the 15 March 1992 substorm.
models that include field-aligned currents feature onsets over a wider range, especially T96.
Because the differences in the field configuration during quiet and disturbed times are large, it is essential that the ef-fects of varying geomagnetic activity be taken into account in the mapping studies. However, the T87 and T89 models are parameterized by the Kpindex which is a three-hour
av-erage. Thus the veracity of these two models are expected to be inferior to results from T96 and T01. For comparison, for all substorms, the closest onset distance of the magnetic field line which threads the auroral onset position as computed with T87 is 5.3 RE, compared to 6.0 REfor T89. The furthest
onset distance for T87 and T89 was 16.0 RE and 18.4 RE,
respectively. The mean onset distances for all substorms were 7.3 RE and 9.1 RE, respectively. These results are
con-sistent with those of Frank and Sigwarth (2000) whose re-sults suggested that substorms may be initiated within the ring current. The statistical results from T96 and T01 were quite different. In some cases the magnetic field lines were very stretched and mapped far downtail, in particular for T96. For all substorms, the minimum and maximum onset
Fig. 4. Histograms showing the distribution of data for various parameters. Abscissas are percent of total number of events. −70 −60 −50 −40 −30 −20 −10 0 −5 0 5 10 15 X GSM (RE) Y GSM (R E )
Fig. 5. Location of the model onsets in X-Y plane.
distances for T96 and T01, respectively, were 5.9 RE and
5.5 RE, and 65.8 RE and 29.3 RE. These results are
sum-marized in Table 1. For all the models, average substorm onset location was inside 20 RE. Errors for X, Y, Z are
in-dicated on the earthward (positive values, top) and tailward (negative values, bottom) sides of the ignition location. The errors are uneven due to the nonlinear nature of the mapping from the ionosphere to the magnetotail; an error of ±0.25◦
can be associated with the onset location in the ionosphere, and because of the stretching of the magnetotail, the error on the high latitude side will typically be larger than for the
low latitude. Since there are large outliers, the median values are also important. For the downtail X-position the median values for each model is –6.2, –7.1, –12.3, and –10.2 RE,
respectively.
A few general conclusions are also in order. We found that in general as activity increased as indicated by an increase in
Kp, the location of the substorm onset tends to occur closer
to the Earth for T87 and T89 (Fig. 7). A similar qualitative trend is also evident for solar wind dynamic pressure and Bz
for the T96 and T01 models (Figs. 8, 9), although there is considerable scatter.
−10 −5 0 5 10 15 −2 −1.5 −1 −0.5 0 0.5 1 1.5 Y GSM (RE) MLT (hours) T87 T89 T96 T01
Fig. 6. Onset location for the dawn-dusk coordinate (Y) against magnetic local time.
−20
0
−15
−10
−5
0
1
2
3
4
5
X
GSM(R
E)
Kp
T87
T89
Fig. 7. Dependence of onset location versus Kpindex.
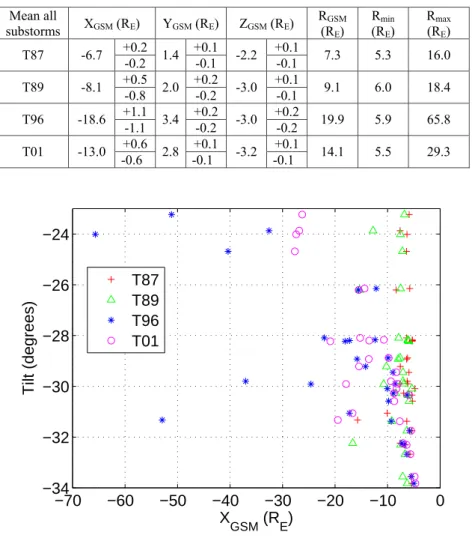
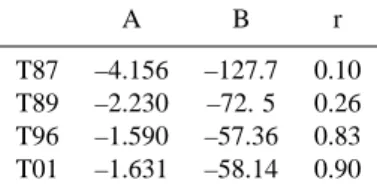
An interesting relationship appears between onset location and dipole tilt, as indicated in Fig. 10. Close to the Earth an approximately linear trend emerges, and inside 15 RE we
have modeled onset distance as a function of dipole tilt. The regression coefficients were fitted using a least-squares mini-mization routine. The results are shown in Table 2, including a notable strong correlation for T96 and T01. Similar com-parisons with Kp, Dst, Bz and dynamic pressure reveal no
coherent picture and negligible correlation.
5 Discussion and conclusions
From an initial data set of over 200 substorms we have stud-ied a subset of 30 magnetospheric substorms close to mag-netic midnight to investigate, in a statistical fashion, the source region of the auroral arc that brightens at the onset of expansive phase. This arc is usually identified as the iono-spheric signature of the expansive phase onset that occurs in the magnetotail. All the substorm onsets were identified
−70
0
−60
−50
−40
−30
−20
−10
0
1
2
3
4
5
6
X
GSM(R
E)
P
dyn(nPa)
T96
T01
Fig. 8. Dependence of onset location with solar wind dynamic pressure.
−70 −60 −50 −40 −30 −20 −10 0 −6 −4 −2 0 2 4 6 X GSM (RE) B z (nT) T96 T01
Fig. 9. Dependence of onset location with southward component of interplanetary magnetic field.
via ground-based magnetometer and photometer data from the CANOPUS array. The various Tsyganenko (1987, 1989, 1996, 2002ab) global magnetic field models were used to map magnetic field lines from the location of the onset arc out to its greatest radial distance in the magnetotail.
Previous modeling attempts using the Tsyganenko models have typically indicated undue stretching in the inner mag-netotail during substorms. Hence, as the growth phase pro-gresses, mappings from the model magnetotail to the iono-sphere result in model ionospheric footprints slightly further
north than actually was the case. Mapping from the iono-sphere to the magnetotail would correspondingly result in magnetotail locations somewhat closer than actually was the case. They have also indicated that thin current sheets in the inner tail are an important governing component of the over-all growth phase dynamics (Pulkkinen et al., 1999; Wanliss et al., 2000, 2002). At substorm onset, the initial disturbance location and timing is sensitively dependent on the stability properties of the thin current sheet (Baker et al., 1996). Be-cause we wished to compare the results from the zero order
J. Wanliss: Substorm onset location and dipole tilt angle 585
Table 1. Average (X,Y,Z)GSMonset locations determined for the T87, T89, T96, and T01 models. The final three columns give the average,
minimum, and maximum radial distance of substorm onsets determined for each model.
Yoon, P. H., J. F. Drake, A. T. Y. Lui, Theory and simulation of Kelvin-Helmholtz instability in the geomagnetic tail, J. Geophys. Res., 101, 27327--27339, 1996.
Zhou, X.-W., C. T. Russell, G. Le, et al.: The polar cusp location and its dependence on dipole tilt, Geophys. Res. Lett, 26 , 3 , 42--45, 1999.
Mean all substorms XGSM (RE) YGSM (RE) ZGSM (RE) R(RGSM E) Rmin (RE) Rmax (RE) +0.2 +0.1 +0.1 T87 -6.7 -0.2 1.4 -0.1 -2.2 -0.1 7.3 5.3 16.0 +0.5 +0.2 +0.1 T89 -8.1 -0.8 2.0 -0.2 -3.0 -0.1 9.1 6.0 18.4 +1.1 +0.2 +0.2 T96 -18.6 -1.1 3.4 -0.2 -3.0 -0.2 19.9 5.9 65.8 +0.6 +0.1 +0.1 T01 -13.0 -0.6 2.8 -0.1 -3.2 -0.1 14.1 5.5 29.3
Table 1. Average (X,Y,Z)GSM onset locations determined for the T87, T89, T96, and T01
models. The final three columns give the average, minimum, and maximum radial distance of substorm onsets determined for each model.
A B r T87 -4.156 -127.7 0.10
T89 -2.230 -72. 5 0.26
T96 -1.590 -57.36 0.83 T01 -1.631 -58.14 0.90
Table 2. Model coefficients of the best fit between onset location and dipole tilt. The
model wasXGSM =Aθ+B, where θ is the dipole tilt angle. The third column indicates
the correlation coefficient for the best fit.
−70 −60 −50 −40 −30 −20 −10 0 −34 −32 −30 −28 −26 −24 X GSM (RE) Tilt (degrees) T87 T89 T96 T01
Fig. 10. Dependence of onset location with dipole tilt angle.
Tsyganenko models no modifications were attempted, such as the addition of thin current sheets, even though these are known to produce fields that better mimic the inner mag-netotail magnetospheric magnetic field during growth phase (Pulkkinen et al., 1999).
The T96 and T01 models are expected to be the most ac-curate, partly because they are the most recent models thus more realistic, and partly because they include field-aligned electric currents which are known to strongly affect the mag-netic field. In addition, the T87 and T89 models are not, strictly speaking, models of the inner magnetotail for they were not parameterized with data from these regions. The same is true for T96. The only model that is actually param-eterized with inner magnetotail data is T01, and we therefore expect that this model will produce results that are most rea-sonable, especially since we have a priori reason to believe that the onset region is in the inner magnetotail. However, since T01 is not designed to be valid beyond 15 RE, it is not
clear how much further downtail it remains a better model than T96.
Because the differences in the field configuration during quiet and disturbed times are large, it is essential that the ef-fects of varying geomagnetic activity be taken into account in the mapping studies. However, the T87 and T89 models are parameterized by the Kpindex which is a three-hour average.
Thus we have another reason to expect that the veracity of these two models is inferior to results from T96 and T01. By comparison, for all the substorms studied, the closest onset distance of the magnetic field line which threads the auroral onset position as computed with T87 was 5.3 RE, compared
to 6.0 RE for T89. The furthest onset distance was 16.0 RE
and 18.4 RE, respectively. The mean onset distances for all
substorms were 7.3 RE and 9.1 RE, respectively. The mean
distances are consistent with results of Frank and Sigwarth (2000). The statistical results from T96 and T01 were quite different since some cases mapped far downtail because of
Table 2. Model coefficients of the best fit between onset loca-tion and dipole tilt. The model wasXGSM=Aθ +B, where θ is the
dipole tilt angle. The third column indicates the correlation coeffi-cient for the best fit.
A B r
T87 –4.156 –127.7 0.10 T89 –2.230 –72. 5 0.26 T96 –1.590 –57.36 0.83 T01 –1.631 –58.14 0.90
very stretched magnetic field lines. This could be related to the field-aligned currents in these models, since these have been shown to significantly modify the tail geometry (Dono-van, 1993). For all substorms, the minimum and maximum onset distances for T96 and T01, respectively, were 5.9 RE
and 5.5 RE, and 65.8 RE and 29.3 RE. The range of the
re-sults for T01 encompass previous observations (Nishida et al., 1996) that place the average neutral line near 30 RE, but
are not consistent in the sense that the onset location from T01 is much closer to the earth with an average of 14.1 RE.
They are therefore more consistent with other results that place the onset location near the ring current (Samson et al, 1992; Frank and Sigwarth, 2000); i.e. the results support the CD model, not the NENL model.
The results of this research provide a possible explanation for sometimes contentious discussions about the location of substorm onset which is indicated most clearly in its iono-spheric footprint. Within the narrow range of dipole tilts examined (only 20% of parameter space was examined) we found that the downtail distance of the substorm onset was strongly dependent on the dipole tilt for T96 and T01. The more negative the dipole tilt the closer to the Earth the on-set typically occurred. This result also has interesting im-plications regarding the cause of magnetospheric substorms. Substorms are known to occur during almost all levels of magnetospheric activity, especially during active times. The question of whether they are externally driven or primarily an internal magnetospheric instability is one that remains unre-solved. It is clear that solar wind conditions influence sub-storms, for example, as is well-known and indicated again in this study, one can see that there is a higher probability for substorms during southward interplanetary magnetic field (Fig. 4), but this says nothing about the location of the onset. For the range considered our modeling indicates dipole tilt angle strongly influences the location of the substorm onset.
Our results can be summarized as follows:
1. There are onset dependencies on dipole tilt/Pdyn/Bzfor
T96 and T01; the trend with Pdynand Bzis qualitative
but the relationship is strong for tilt, with a large corre-lation coefficient. Less clear dependencies are observed
for T89 (with Kp) and nothing can be said about
depen-dencies for T87.
2. For T96 and T01 there is a strong linear dependence between tilt and downtail distance; as tilt becomes less negative onsets occur further downtail.
3. Substorm ignition occurs preferentially before mid-night.
4. Substorms that are initiated before 30 min after mid-night map to the dusk side of the magnetotail (Y>0). This indicates some twisting or asymmetry of the mag-netotail.
5. The model that provides the expected best estimate (T01) for onset location typically gives onsets on the duskside at an average downtail distance of R=14.1 RE.
6. Substorms can be initiated in the magnetotail from within the ring current region to approximately 30 RE.
It should be emphasized that our results should be inter-preted with caution since all of the substorms considered here occurred during the winter months, and featured negative dipole tilts. As such, one should be cautious about extrap-olating this trend. For example, as the dipole tilt approaches 0◦the onset location is close to –60 RE, which is completely
unrealistic. It is more likely that the true relationship is non-linear and the results given here fit a only a small subsection of parameter space where a linear relationship holds. It is well known that there are seasonal effects related to space weather (Russell and McPherron, 1973) and we will need to perform similar analysis to examine whether the observed relations are the same for a larger range of dipole tilts that occur during other seasons when photometer data are more difficult to obtain. Second, the results are dependent on Tsy-ganenko models that are based on averages and are there-fore inherently inaccurate, although this weakness is perhaps ameliorated by the statistical approach we have followed.
Acknowledgements. The CANOPUS array is funded by the
Cana-dian Space Agency. This material is based on work supported by the National Science Foundation under Grants No. ATM-0449403 and DMS-0417690. SDG.
Topical Editor T. Pulkkinen thanks M. Fillingim and J. Bortnik for their help in evaluating this paper.
References
Baker, K. B. and Wing, S.: A new magnetic coordinate system for conjugate studies at high latitudes, J. Geophys. Res., 94, 9139– 9143, 1989.
Baker, D. N., Pulkkinen, T. I., Angelopoulos, V., Baumjohann, W., and McPherron, R. L.: The neutral line model of substorms: Past results and present view, J. Geophys. Res., 101, 12 975–13/,010, 1996.
Baker, D. N. and Li, X.: Relativistic electron flux enhancements during strong geomagnetic activity, in: Disturbances in Geospace The Storm-Substorm Relationship, (edited by: Sharma, A. S., Kamide, Y. and Lakhina, G. S., AGU monograph, 217–230, 2003.
Baumjohann, W., Kokubun, S., Mukai, T., et al.: Substorm dipo-larization and recovery, J. Geophys. Res., 104, 24 995–25 000, 1995.
Birn, J. and Hesse, M.: Details of current disruption and diversion in simulations of magnetotail dynamics, J. Geophys. Res., 101, 15 345–15 358, 1996.
Blanchard, G. T., Lyons, L. R., and Samson, J. C.: Accuracy of using 6300 ˚A auroral emission to identify the magnetic separatrix on the nightside of Earth, J. Geophys. Res., 102(A5), 9697–9704, doi:10.1029/96JA04000, 1997.
Cheng, C. Z. and Lui, A. T. Y.: Kinetic ballooning instabil-ity for substorm onset and current disruption observed by AMPTE/CCE, Geophys. Res. Lett., 25, 4091–4094, 1998. Donovan, E. F. : Modeling the magnetic effects of field-aligned
currents, J. Geophys. Res., 98, 13 529–13 543, 1993.
Dubyagin, S. V., Sergeev, V. A., Carlson, C. W., Marple, S. R., Pulkkinen, T. I., and Yahnin, A. G.: Evidence of near-Earth breakup location, Geophys. Res. Lett., 30, 1282, doi:10.1029/2002GL016569, 2003.
Erickson, G. M., Maynard, N. C., Burke, W. J., Wilson, G. R., and Heinemann, M. A.: Electromagnetics of substorm onsets in the near-geosynchronous plasma sheet, J. Geophys. Res., 105, 25 265–25 290, 2000.
Frank, L. A. and Sigwarth, J. B.: Findings concerning the positions of substorm onsets with auroral images from the Polar spacecraft, J. Geophys. Res., 105, 12 747–12 761, 2000.
Friedrich, E., Samson, J. C., Voronkov, I., Rostoker, G. et al.: Dy-namics of the substorm expansive phase, J. Geophys. Res., 106, 13 145–13 163, 2001.
Jayachandran, P. T., MacDougall, J. W., St-Maurice, J.-P., Moor-croft, D. R., Newell, P. T., and Prikryl, P.:Coincidence of the ion precipitation boundary with the HF E region backscatter bound-ary in the dusk-midnight sector of the auroral oval, Geophys. Res. Lett., 29(8), 1256, doi:10.1029/2001GL014184, 2002. Kan, J. R., Craven, J. D., and Akasofu,S.-I.: MHD simulations of
substorm dynamics including an inner magnetotail, in: Proceed-ings of the 2nd International Conference on Substorms, edited by: Hesse, M., Birn, J., Baker, D. N., and Pulkkinen, T. I., Uni-versity of Alaska press, Fairbanks, 237–243, 1994.
Kaufmann, R. L.: Substorm currents: growth phase and onset, J. Geophys. Res., 92, 7471–7486, 1987.
Kubyshkina, M. V., Sergeev, V. A., and Pulkkinen, T. I.: Hybrid Input Algorithm: An event-oriented magneto-spheric model, J. Geophys. Res., 104(A11), 24977–24994, doi:10.1029/1999JA900222, 1999.
Liou, K., Meng, C.-I., Lui, A. T. Y., Newell, P. T., Brittnacher, M., Parks, G., Reeves, G. D., Anderson, R. R., and Yumoto, K.: On relative timing in substorm onset signatures, J. Geophys. Res., 104(A10), 22 807–22 818, 10.1029/1999JA900206, 1999. Liou, K., Meng, C.-I., Newell, P. T., Takahashi, K., Ohtani, S.-I.,
Lui, A. T. Y., Brittnacher, M., and Parks, G.: Low-latitude Pi 2 pulsations as possible indicators of substorm onset: A survey using Polar ultraviolet imagery, J. Geophys. Res., 105, 2495– 2505, 2000.
Liou, K., Meng, C.-I., Newell, P. T., Lui, A. T. Y., Reeves, G. D., and Belian, R. D.: Substorm injections with auroral expansions, J. Geophys. Res., 106, 5873–5882, 2001.
Lu, G., Tsyganenko, N. A., Lui, A. T. Y., Singer, H. J., Nagai, T., and Kokubun, S.: Modeling of time-evolving magnetic fields during substorms, J. Geophys. Res., 104(A6), 12 327–12 338, 1999.
Lui, A. T. Y.: A synthesis of magnetospheric substorm models, J. Geophys. Res., 96, 1849–1856, 1991.
Lui, A. T. Y., Williams, D. J., McEntire, R. W., Ohtani, S., Zanetti, L. J., Bristow, W. A., Greenwald, R. A., Newell, P. T., Chris-ton, S. P., Mukai, T., Tsuruda, K., Yamamoto, T., Kokubun, S., Matsumoto, H., Kojima, H., Murata, T., Fairfield, D. H., Lep-ping, R. P., Samson, J. C., Rostoker, G., Reeves, G. D., Rodger, A. L., and Singer, H. J.: Multipoint study of a substorm on February 9, 1995, J. Geophys. Res., 103(A8), 17 333–17 344, doi:10.1029/97JA02632, 1998.
Lyons, L. R., Zesta, E., Samson, J. C., and Reeves, G. D.: Auroral disturbances during the January 10, 1997 magnetic storm, Geophys. Res. Lett., 27(20), 3237–3240, doi:10.1029/1999GL000014, 2000.
Miyashita, Y., Machida, S., Nishida, A., Mukai, T., Saito, Y., and Kokubun, S.: GEOTAIL observations of total pressure and electric field variations in the near and mid-distant tail associ-ated with substorm onsets, Geophys. Res. Lett., 26(6), 639–642, doi:10.1029/1999GL900031, 1999.
Nagai, T., Fujimoto, M., Saito, Y., Machida, S., Terasawa, T., Nakamura, R., Yamamoto, T., Mukai, T., Nishida, A., and Kokubun, S.: Structure and dynamics of magnetic reconnection for substorm onsets with Geotail observations, J. Geophys. Res., 103(A3), 4419–4440, doi:10.1029/97JA02190, 1998.
Nishida, A., Mukai, T., Yamamoto, T., Saito, Y., and Kokubun, S.: Magnetotail convection in geomagnetically active times, 1. Dis-tance to the neutral lines, J. Geomag. Geoelectr., (48), 489–501, 1996.
Ohtani, S., Takahashi, K., Sanetti, L. J., McEntire, R. W., et al.: Initial signatures of magnetic field and energetic particle fluxes at tail reconfiguration: Explosive growth phase, J. Geophys. Res., 97, 19 311–19 324, 1992.
Ohtani, S., Creutzberg, F., Mukai, T., Singer, H., Lui, A. T. Y., Nakamura, M., Prikryl, P., Yumoto, K.,and Rostoker, G.: Sub-storm onset timing: The December 31, 1995, event, J. Geophys. Res., 104(A10), 22 713–22 728, doi:10.1029/1999JA900209, 1999.
Pulkkinen, T. I., Baker, D. N., Wiltberger, M., Goodrich, C., et al.: Pseudobreakup and substorm onset: Observations and MHD simulations compared, J. Geophys. Res., 103, 14 847–14 854, 1998.
Pulkkinen, T. I.: A study of magnetic field and current configura-tions in the magnetotail at the time of a substorm onset, Planet. Space. Sci., 39, 833–845, 1991.
Pulkkinen, T. I.,. Baker, D. N, Pellinen, R. J., Murphree, J. S., and Frank, L. A.: Mapping of the auroral oval and individual arcs during substorms, J. Geophys. Res., 100, 21 987–21 994, 1995. Pulkkinen, T. I., Baker, D. N., Cogger, L. L., Frank, L. A.,
Sig-warth, J. B., Kokubun, S., Mukai, T., Singer, H. J., Slavin,J. A., and Zelenyi, L.: Spatial extent and dynamics of a thin current sheet during the substorm growth phase on December 10, 1996, J. Geophys. Res., 104, 28 475–28 490, 1999.
Reeves, G. D. and Henderson, M. G.: the storm-substorm rela-tionship: ion injections in geosynchronous measurements and composite energetic neutral atom images, J. Geophys. Res., 106, 5833–5844, 2001.
Reeves, G., Henderson, M. G., Skoug, R. M., Thomsen, M. F., et al.: IMAGE, POLAR, and geosynchronous observations of substorm and ring current ion injection, in: Disturbances in Geospace The Storm-Substorm Relationship, edited by: Sharma, A. S., Kamide, Y., and Lakhina, G. S., AGU monograph, 91–102, 2003. Rostoker, G., Samson, J. C., Creutzberg, F., Hughes, T. J., et al.: CANOPUS – A ground-based instrument array for remote sens-ing the high latitude ionosphere dursens-ing the ISTP/GGS program, Space Sci. Rev., 71, 743–760, 1995.
Russell, C. T. and McPherron, R. L.: Semiannual variation of geo-magnetic activity, J. Geophys. Res., 78, 92–108, 1973.
Samson, J. C., Lyrons, L. R., Newell, P. T., Creutzberg, F., et al.: Proton aurora and substorm intensifications, Geophys. Res. Lett., 19, 2167–2174, 1992.
Samson, J. C.: Mapping substorm intensifications from the iono-sphere to the magnetoiono-sphere, in: Proceedings of the International Conference on Substorms 2, edited by: Kan, J. R., Craven, J. D., and Akasofu, S.-I., Univ. Alaska, 189, 1994.
Samson, J. C.: Nonlinear, hybrid, magnetohydrodynamic instabili-ties associated with substorm intensifications near the Earth, in: Substorms-4: International Conference on Substorms-4, Lake Hamana, Japan, March 9th-13, 1998, edited by: Kokubun, S. and Kamide, Y., Kluwer Academic, Norwell, Mass., 505-509, 1998. Sch¨odel, R., Nakamura, R., Baumjohann, W., Mukai, T., et al.:
Rapid flux transport and plasma sheet reconfiguration, J. Geo-phys. Res., 106, 8381–8390, 2001.
Shiokawa, K., Baumjohann, W., Haerendel, G., et al.: Breaking of high-speed flows in the near-Earth tail, Geophys. Res. Lett., 24, 1179–1182, 1997.
Tsyganenko, N. A.: Global Quantitative Models of the Geomag-netic Field in a Cislunar Magnetosphere for Different Distur-bance Levels, Planet. Space. Sci., 35, 1347–1358, 1987.
Tsyganenko, N. A.: A magnetospheric magnetic field model with a warped tail current sheet, Planet. Space. Sci., 37, 5–20, 1989. Tsyganenko, N. A.: Modelling the Earth’s magnetospheric
mag-netic field confined within a realistic magnetopause, J. G. R., 100, 5599–5612, 1995.
Tsyganenko, N. A.: Effects of the solar wind conditions on the global magnetospheric configuration as deduced from data-based models, in: Proceedings: Third International Conference on Sub-storms (ICS-3), edited by: Rolfe, E. J. and Kaldeich, B., Euro-pean Space Agency Spec. Publ., ESA SP-399, 181–185, 1996. Tsyganenko, N. A.: A model of the near magnetosphere with a
dawn-dusk asymmetry, 1. Mathematical structure, J. Geophys. Res., 107, doi:10.1029/2001JA000219, 2002a.
Tsyganenko, N. A.: A model of the near magnetosphere with a dawn-dusk asymmetry, 2. Parameterization and fitting to ob-servations, J. Geophys. Res., 107, doi:10.1029/2001JA000220, 2002b.
Voronkov, I., Friedrich, E., and Samson, J. C.: Dynamics of the Substorm Growth Phase as Observed using CANOPUS and Su-perDARN Instruments, J. Geophys. Res., 104, 28 491–28 505, 1999.
Wanliss, J. A., Samson, J. C., and Friedrich, E.: On the use of pho-tometer data to map dynamics of the magnetotail current sheet during substorm growth phase, J. Geophys. Res., 105, 27 673– 27 684. 2000.
Wanliss, J. A., Rankin, R., and Samson, J. C.: Field line resonances in a stretched magnetotail: CANOPUS optical and magnetometer observations, J. Geophys. Res., 107(0), doi:10.1029/2001JA000257, 2002.
Yoon, P. H., Dreake, J. F., Lui, A. T. Y., et al.: Theory and simu-lation of Kelvin-Helmholtz instability in the geomagnetic tail, J. Geophys. Res., 101, 27 327–27 340, 1996.
Zhou, X.-W., Russell, C. T., Le, G., Fuselier, S. A., and Scudder, J. D.: The polar cusp location and its dependence on dipole tilt, Geophys. Res. Lett, 26, 3, 429–432, 1999.