HAL Id: hal-00316199
https://hal.archives-ouvertes.fr/hal-00316199
Submitted on 1 Jan 1997
HAL is a multi-disciplinary open access archive for the deposit and dissemination of sci-entific research documents, whether they are pub-lished or not. The documents may come from teaching and research institutions in France or abroad, or from public or private research centers.
L’archive ouverte pluridisciplinaire HAL, est destinée au dépôt et à la diffusion de documents scientifiques de niveau recherche, publiés ou non, émanant des établissements d’enseignement et de recherche français ou étrangers, des laboratoires publics ou privés.
The electric field response to the growth phase and
expansion phase onset of a small isolated substorm
R. V. Lewis, M. P. Freeman, A. S. Rodger, G. D. Reeves, D. K. Milling
To cite this version:
R. V. Lewis, M. P. Freeman, A. S. Rodger, G. D. Reeves, D. K. Milling. The electric field response to the growth phase and expansion phase onset of a small isolated substorm. Annales Geophysicae, European Geosciences Union, 1997, 15 (3), pp.289-299. �hal-00316199�
The electric field response to the growth phase
and expansion phase onset of a small isolated substorm
R. V. Lewis1, M. P. Freeman1, A. S. Rodger1, G. D. Reeves2, D. K. Milling3
1British Antarctic Survey, Natural Environment Research Council, High Cross, Madingley Road, Cambridge, CB3 0ET, UK 2
NIS-2, MS D-436, Los Alamos National Laboratory, Los Alamos, NM 87545, USA
3Department of Physics, University of York, Heslington, York YO1 5DD, UK
Received: 11 March 1996 / Revised: 25 September 1996 / Accepted: 8 October 1996
Abstract. We capitalise on the very large field of view of
the Halley HF radar to provide a comprehensive description of the electric field response to the substorm growth phase and expansion phase onset of a relatively simple isolated substorm ( |AL| < 250 nT) which oc-curred on 13 June 1988. The substorm phases are identified by their standard ground magnetic and spacecraft energetic particle signatures, which provide a framework for the radar measurements. The substorm is preceded by a prolonged period (>12 h) of magnetic quiescence, such that prior to the start of the growth phase, the apparent latitudinal motion of the radar backscatter returns is consistent with the variation in latitude of the quiet-time auroral oval with magnetic local time. The growth phase is characterised by an increasing, superimposed equatorward motion of the equatorward edge of the radar backscatter as the auroral oval expands. Within this backscatter region, there is a poleward gradient in the Doppler spectral width, which we believe to correspond to latitudinal structure in auroral emissions and magnetospheric precipitation. During the growth phase the ionospheric convection is dominated by a relatively smooth large-scale flow pattern consistent with the expanding DP2 (convection) auroral electrojets. Immediately prior to substorm onset the ionospheric convection observed by the radar in the midnight sector has a predominantly equatorward flow component. At substorm onset a dramatic change occurs and a poleward flow component prevails. The timing and location are quite remarkable. The timing of the flow change is within one minute of the dispersionless injection observed at geostationary orbit and the Pi2 magnetic signature on the ground. The location shows that this sudden change in flow is due to the effect of the upward field aligned current of the substorm current wedge imposed directly within the Halley radar field of view.
1 Introduction
More than three decades ago, Akasofu (1964) presented his seminal work on the spatial and temporal develop-ment of the auroral substorm as observed by ground-based all-sky cameras. In the intervening years, a great deal of progress has been made. An important step has been a description of the substorm signatures seen by other remote sensing and in-situ instruments, e.g. ground magnetometers and spacecraft (see e.g. McPher-ron et al., 1973; Rostoker et al., 1980; Baker et al., 1993; and references therein).
In terms of all these signatures, the substorm incor-porates three phases: the growth phase, the expansion phase and the recovery phase. During the course of the growth phase, the auroral oval expands equatorward and there is an increase in the strength of the DP2 auroral electrojets. The brightening of the most equa-torward auroral arc signals the onset of the expansion phase, accompanied by a Pi2 pulsation and the injection of energetic particles into the inner magnetosphere. The substorm current wedge (SCW) is established in the magnetosphere and the westward travelling surge (WTS) forms to carry the upward field aligned current at its western edge in the auroral ionosphere. The associated aurora expands reaching its maximum poleward extent at the end of the expansion phase, whence the recovery phase begins. The recovery phase is not so well described or understood, and although activity may diminish in the midnight sector, much activity occurs in the morning sector, where for example large-scale auroral omega bands develop and drift eastward.
Any individual substorm can be more complex than this simple sequence of growth, onset and recovery, and may include pseudo-breakups, intensifications and mul-tiple onsets. Also, a series of parallel effects occur in the magnetosphere during the course of a substorm, but these will not be considered here.
By comparison with the familiar signatures just described, the electric field response (directly related to the plasma velocity at F-region altitudes) has received less attention: the most thorough descriptions have been provided by a series of papers comprising detailed data analysis and modelling work using the STARE VHF radar (Baumjohann et al., 1981; Inhester et al., 1981; Opgenoorth et al., 1983). Recently, two separate studies have used the Halley HF radar to investigate the ionospheric convection associated with substorm activ-ity: Morelli et al., (1995) discussed the plasma flows in the auroral zone during a very complicated multiple on-set substorm, whereas Yeoman and Pinnock (1996) were more concerned with the timing between the magneto-tail response and the ionospheric plasma motion.
This study contributes further to this area of research. It concentrates on a relatively simple isolated substorm, which occurred on 13 June 1988, and provides a descrip-tion of the electric field response to the substorm growth phase and the expansion phase onset. Firstly, the growth phase is of particular interest because the substorm is preceded by a prolonged interval of magnetic quiet, so that the magnetosphere must have been close to a rare ‘‘ground state’’ prior to the activity. Secondly, at the exact time of substorm onset, the data show that the upward field-aligned current (FaC) of the SCW has a dramatic effect on the ionospheric plasma flow.
2 Instrumentation
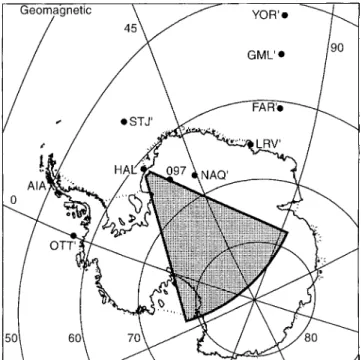
Figure 1 is a map of the southern polar region, showing the actual or projected locations of the instruments used in this study. The key instrument is the Halley HF radar, which is part of the Southern Hemisphere Auroral Radar Experiment (SHARE), itself a component of the Super Dual Auroral Radar Network (SuperDARN) (see Greenwald et al., 1985; Baker et al., 1989; Greenwald et al., 1995). The radar operates in the high frequency band and is sensitive to coherent backscatter from deca-meter-scale ionospheric irregularities, which at F-region altitudes drift with the ambient plasma (Ruohoniemi et al., 1987). The measured parameters are the back-scattered power, the line-of-sight Doppler velocity and the Doppler spectral width. The mode of operation of the radar for the interval studied on this occasion is to scan through sixteen beam positions in a total of 96 s, giving a dwell time of 6 s in each position. The beams sweep out an area of about 65°– 85°PACE geomagnetic latitude and 4 h of local time, with a typical spatial resolution along the beam of 45 km. The field of view (FoV) is shown in Fig. 1 by the grey shaded area.
Data from a number of other sources are utilised in order to provide a substorm framework in which to interpret the radar data. On the ground, magnetometer data are available from Halley (HAL) station in the Southern Hemisphere, and from the Canadian Magnetic Observatory Network, the Greenland magnetometer chain (Friis-Christensen et al., 1988) and the UK Sub-Auroral Magnetometer Network (SAMNET) (Yeoman et al., 1990) in the Northern Hemisphere. The conjugate
mapping of several Northern Hemisphere sites is shown in Fig. 1: note particularly Narssarssuaq (NAQ’) and St. Johns (STJ’). Also available is the auroral electrojet (AE) index (Davis and Sugiura, 1966), which yields a measure of global (Northern Hemisphere) auroral electrojet activity. At geostationary orbit, energetic particle data are available from the Los Alamos National Laboratory (LANL) spacecraft (e.g. Baker et al., 1979). The magnetic footprint of LANL geosta-tionary spacecraft 1987–097 is shown in Fig. 1.
3 Observations
3.1 Overview
Figure 2 presents an overview both of the geomagnetic activity and the ionospheric convection associated with a small, isolated substorm that occurred on 13 June 1988. Data are plotted for the interval 00:00 UT to 05:00 UT. Unfortunately no interplanetary magnetic field data are available for this interval.
In the top panel of Fig. 2, we show the auroral electrojet upper (AU) and lower (AL) indices, as derived from 12 magnetometers in the Northern Hemisphere in the usual manner (WDC-2 for Geomagnetism, Data Book Number 23, AE 1988a, September 1994). There is an initial rise in AU at about 00:25 UT, before a larger rise in AU between 01 UT and 02 UT. This corresponds
Fig. 1. A map of the Southern Hemisphere polar region overlaid with
the PACE geomagnetic co-ordinate grid (Baker and Wing, 1989) showing the field of view of the Halley HF radar (grey shaded area), magnetometer stations in the Southern Hemisphere (HAL, AIA), magnetometer stations mapped from the Northern Hemisphere (OTT′, STJ′, NAQ′, LRV′, FAR′, GML′, YOR′) and the magnetic footprint of LANL spacecraft 1987–097 (097). The latter is mapped from geostationary orbit using the Tsyganenko (1987) field model for the lowest Kp range
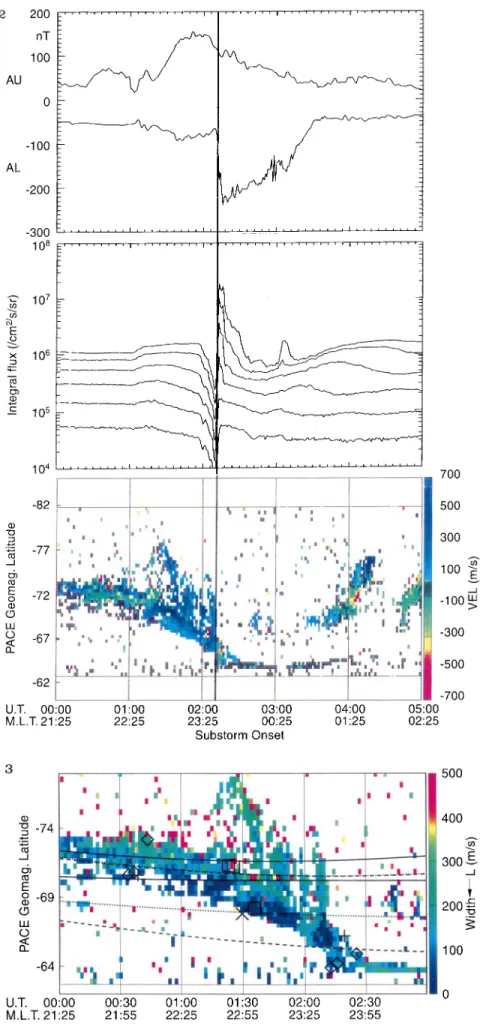
Fig. 2. Overview of the substorm interval
between 00:00 UT and 05:00 UT on 13 June 1988. The panels show the AU and AL indices (top panel ), integrated electron fluxes from LANL spacecraft 1987–097 (30-300 keV) (middle panel ) and the line-of-sight Doppler velocity of the Halley HF radar backscatter on the meridian beam as a function of PACE geomagnetic latitude (bottom panel ). Substorm onset is marked by the vertical line
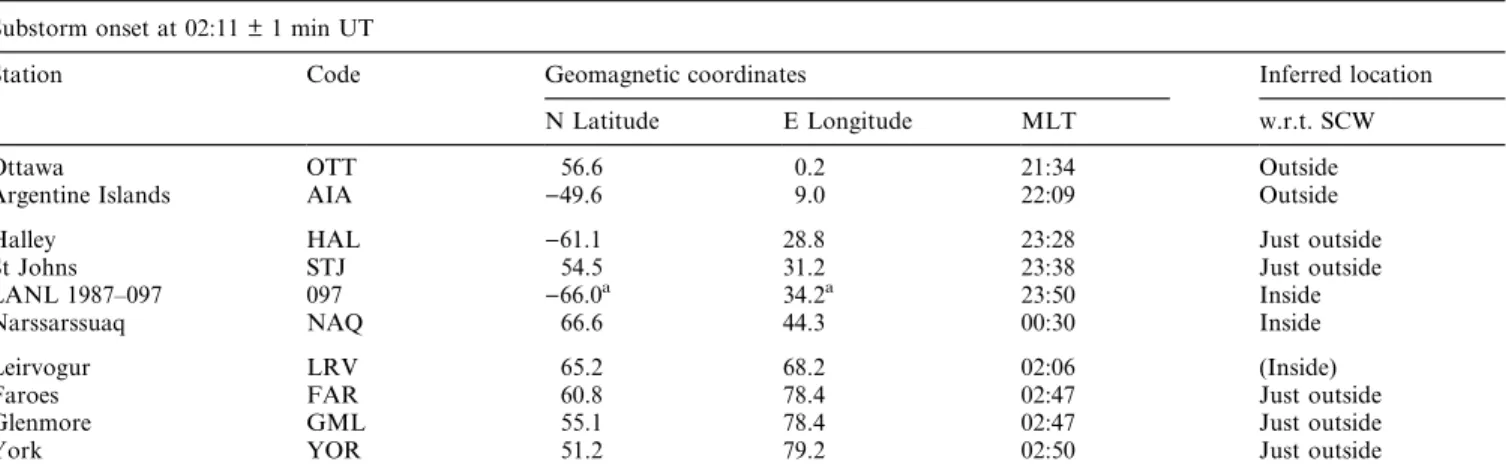
Fig. 3. The spectral width observed by the
Halley HF radar on the meridian beam between 00:00 UT and 03:00 UT on 13 June 1988. The locus of the Feldstein oval is overlaid for Q 0 (solid lines), Q 1 (dotted
lines) and Q 2 (dashed lines). The diamonds
(squares) represent the location in the Southern (Northern) Hemisphere of the boundary plasma sheet (bp)/central plasma sheet (cp) boundary detected by DMSP and projected to the Halley MLT using the first ‘‘auroral oval offset’’ method described in the text. The plus (multiply) symbols represent the location in the Southern (Northern) Hemisphere of the boundary plasma sheet (bp)/central plasma sheet (cp) boundary detected by DMSP and projected to the Halley MLT using the second ‘‘auroral circle fit’’ method described in the text
to an increase in the strength of the eastward electrojet and defines the substorm growth phase. Simultaneously with the latter rise in AU there is a slight decrease in AL corresponding to an increase in the strength of the west-ward electrojet. It is also worth noting that there is over twelve hours of magnetic quiescence prior to the growth phase, Kp values are low ranging from 0+ to 1+, and AE does not exceed 100 nT.
The onset of the substorm expansion phase occurs at 02:11 ± 1 min UT, as indicated by the very sudden decrease in AL from about )60 nT to about )240 nT within a few minutes. At this stage, the contributing stations to AL are first briefly Leirvogur (LRV) and then Narssarssuaq (NAQ). This is an indication of the DP1 electrojet of the SCW being established in the 00 to 03 MLT sector. Thereafter AL begins to recover and by 03:35 UT both AL and AU have returned to their pre-expansion phase levels. We take this to indicate the end of substorm activity.
Corroborating evidence for the timing of the sub-storm onset is provided by a clear Pi2 signature (not shown), which is observed at 02:10 UT in the Southern Hemisphere at HAL and by the SAMNET magneto-meter array located in the Northern Hemisphere. We infer from the H and D component bays that the westernmost stations of the array (FAR, GML, YOR) lie close to the eastern edge of the SCW before 03 MLT. Likewise, the western edge of the SCW is inferred to be after 22 MLT, the MLT sector of magnetometers at Faraday, Argentine Islands (AIA) in the Southern Hemisphere and Ottawa (OTT) in the Northern Hemi-sphere.
Energetic electron and proton (not shown) data from Los Alamos National Laboratory (LANL) geostation-ary spacecraft 1987–097 at)38°E longitude also confirm the timing of the isolated substorm by a well-defined dispersionless injection at 02:11 ± 1 min UT (see middle panel of Fig. 2). Thus, the spacecraft, situated just before midnight MLT, is inside the injection region.
In the bottom panel of Fig. 2, we show observations by the Halley HF radar. The data plotted are the line-of sight velocities along the magnetic meridian as a function of PACE geomagnetic latitude and time. The line-of-sight velocities are colour coded to indicate flow towards (positive values) and away from (negative values) the radar. There are several important features to highlight in the data. During the growth phase, the backscatter recorded by the radar moves equatorward. The line-of-sight Doppler velocities are initially away from the radar, i.e. poleward, and then from 01:10 UT are generally towards the radar, i.e. equatorward. Finally, at 02:11 UT (substorm onset) the flow reverses from equatorward to poleward. At this time, Halley is at approximately 23:30 MLT, close to the inferred location of the western edge of the SCW. A few minutes after substorm onset, there is a general loss of backscatter across all range gates.
We now explore the observations in greater detail, which divide neatly into the traditional substorm growth phase and expansion phase onset.
3.2 Growth phase
3.2.1 Relationship of the radar backscatter to the auroral oval boundaries. Figure 3 shows the Doppler spectral width of the Halley HF radar backscatter as a function of PACE geomagnetic latitude and time from 00:00 UT to 03:00 UT on 13 June 1988. This parameter is a measure of the flow variability within the backscattering volume. There are two key features. Firstly, there is a poleward gradient in the Doppler spectral width – a region of mainly low spectral width (K100 ms)1– blue colour) lies equatorward of a region of mainly high spectral width (J200 ms)1 – green colour). We shall return to the Doppler spectral width in the discussion section. Secondly, note again the equatorward expan-sion of the backscattered signal.
In order to put these HF radar observations into context we overlay the position of a mathematical representation of the Feldstein oval for three levels of geomagnetic activity, Q 0, 1 and 2 (Feldstein, 1963; Holzworth and Meng, 1975, and references therein). The poleward edge and equatorward edge are plotted for the three Q values as a function of PACE geomagnetic latitude and the MLT of Halley (which varies from 20:27 MLT to 00:27 MLT for this interval). All three statistical ovals show the latitudinal variation that one would ex-pect for these MLT values, i.e. an equatorward motion in the pre-midnight sector. Note that as the level of activity increases (higher Q value), the width of the oval increases because of the greater expansion of the equatorward edge to lower latitudes relative to the poleward edge.
By comparing the location and variation in latitude of the radar backscatter returns with the Feldstein ovals, we show that the rate of equatorward motion of the radar backscatter during the substorm growth phase exceeds that due to the diurnal variation in latitude of the auroral oval for a fixed level of activity. Initially, between 00:00 UT on 13 June 1988 and 01:00 UT on 13 June 1988, the majority of the backscatter is within or even poleward of the Q 0 oval. As the growth phase progresses, the location of the backscatter becomes more consistent with the Q 1 oval (sec. 01:40 UT) and then later with the Q 2 oval (sec. 02:00 UT). We attribute both the increasing width of and the equator-ward motion of the radar backscatter during the substorm growth phase to the effect of an expanding auroral oval superimposed on the diurnal variation.
We provide some further confirmation for the rela-tionship between the HF radar backscatter and the auroral precipitation by utilising data from two Sun-synchronous satellites, DMSP F8 and DMSP F9. Two different analysis methods are employed.
In the first method, we map across MLT using the best available Feldstein oval:
1. For the interval 00:00 UT to 03:00 UT on 13 June 1988, we note the MLT and the geomagnetic latitude for those occasions when the satellite crossed a boundary plasma sheet (bp)/central plasma sheet (cp) boundary as indicated by the DMSP neural net (Newell et al., 1991). (Between 00:33 UT and 00:44 UT, there are DMSP crossings of the bp/cp boundary at 18.5, 19.3 and 6.0
MLT. Between 01:24 UT and 01:36 UT, there are crossings at 5.1, 7.0 and 23.8 MLT and between 02:13 UT and 02:26 UT, there are crossings at 18.9, 20.8 and 5.4 MLT.) The bp/cp boundary is likely to correspond to the equatorward edge of the Feldstein oval, i.e. the equatorward edge of the discrete aurora.
2. At the MLT of the boundary crossing, we compare the geomagnetic latitude of the satellite with the geomag-netic latitude of the equatorward edge of the ‘‘nearest Q’’ Feldstein oval and calculate the offset between the DMSP latitude and the Feldstein oval latitude.
3. Knowing the MLT of Halley at the UT of the DMSP observations (at 00:39 UT, the MLT of Halley is 22.1; at 01:30 UT, the MLT of Halley is 22.9 and at 02:20 UT, the MLT of Halley is 23.8), we find the latitude of the equatorward edge of the Feldstein oval at the MLT of Halley for the same Q value as in (2). Then we add the offset calculated in (2) to this latitude. In Fig. 3, the diamonds (squares) represent results of this method for the Southern (Northern) Hemisphere.
In the second method, we utilise the fact that between them the DMSP satellites happen to make three crossings of the bp/cp boundary within several minutes of each other on each polar pass:
1. We calculate the unique circle that fits these three points. That is, we associate the bp/cp boundary with the equatorward edge of the Feldstein auroral oval, which can be approximated by a circle whose centre is in general offset from the geomagnetic pole (Holzworth and Meng, 1975).
2. We calculate the latitude of this circle at the MLT of Halley. This latitude is plotted (at the mid-time of the three boundary crossings) as a plus (multiply) symbol for each Southern (Northern) Hemisphere pass.
For both analysis methods, the satellite data show that the equatorward edge of the discrete aurora expands equatorward during the growth phase in the same manner as the radar backscatter. Also, the DMSP crossings closest in MLT to Halley, when projected along the nearest Feldstein oval, lie systematically on the equatorward edge of the radar backscatter. (The cross-ings further away in MLT lie further poleward.) Thus, this edge seems most likely to be associated with the bp/cp boundary.
3.2.2 Ionospheric convection response. As described in the previous overview section and shown in the bottom panel of Fig. 2, there are two flow regimes during the growth phase. Firstly, between 00:25 UT and 01:10 UT there is a weak poleward component to the flow (green region of backscatter, )50 m s)1 to )300 m s)1), and from the variation of the line-of-sight component across the FoV (not shown) we infer that there is also a larger westward component to the flow. The flow direction is consistent with flow aligned with a Feldstein auroral oval, which at this MLT is tilted slightly with respect to a geomagnetic latitude circle (see Fig. 3). Secondly, between 01:25 UT and 02:10 UT there is an equatorward component to the flow (blue region of backscatter, 50 m s)1to ~ 400 m s)1), and the flow is inferred to have still a westward
component. (Between 01:10 UT and 01:25 UT, there is a transitional period.) Thus, after 01:25 UT an equator-ward flow component of at least 200 m s)1 has been superimposed on the previously existing auroral oval-aligned flow. We attribute this equatorward flow com-ponent mainly to the equatorward expansion of the auroral oval of order 200 m s)1 that occurs in this interval.
3.3 Expansion phase onset
3.3.1 Location of the substorm current wedge. We now consider in greater detail the ground-based observations of ionospheric currents used to determine the location of the SCW. Figure 4 shows a composite plot of magne-tometer data from three stations: Narssarssuaq (NAQ), Halley (HAL) and St. Johns (STJ). The data are dis-played in local magnetic co-ordinates at 1 min resolu-tion.
Substorm onset occurs at NAQ at approximately 02:12 ± 1 min UT on 13 June 1988. The dominant response to the SCW occurs in the H component, which recorded a decrease of approximately 250 nT between onset and the maximum epoch of the expansion phase compared with a decrease of around 100 nT in the D component. The Z component decreased slightly at substorm onset and subsequently fluctuated about its pre-substorm level, but by never more than about ± 50 nT. Therefore, these variations (and those at stations in the Greenland magnetometer chain further poleward, not shown) indicate that after substorm onset, NAQ is situated beneath a westward and slight-ly poleward directed horizontal current. In other words, NAQ observed the intense DP1 electrojet of the SCW, which arises from the so-called Cowling effect (e.g. Baumjohann, 1983).
In the conjugate hemisphere, HAL maps to the magnetic west of NAQ (see Fig. 1). The effect of a north-east equivalent current is observed at 02:11 ± 1 min UT, as indicated by an increase of about 20 nT in the H component with a simultaneous decrease of about 50 nT in the D component. We interpret the equivalent current as being part of the vortical horizontal ionospheric current outside the upward FaC of the SCW (e.g., Opgenoorth et al., 1983). Thus, initially at substorm onset HAL is located slightly westward and equator-ward of the upequator-ward FaC of the SCW. (Note that the same conclusion would be reached if we interpreted the magnetic perturbation at HAL as a sub-auroral signa-ture of the SCW, Clauer and McPherron, 1974.)
Supporting evidence for the location of the upward FaC of the SCW comes from mid-latitude magnetome-ters. St. Johns (STJ) in the Northern Hemisphere is close to the magnetic longitude of HAL (see Fig. 1). We inter-pret the STJ magnetic perturbations (Fig. 4) in the H and D components at substorm onset as those from a sub-auroral station (Clauer and McPherron, 1974). By this argument, the upward FaC is close to the STJ magnetic longitude, i.e. about 23:38 MLT. In any case,
as mentioned in the overview sub-section, the upward FaC is definitely after 22 MLT.
The information gained from the magnetometers together with the observations at geostationary orbit are summarised in Table 1. From this, it is concluded that substorm onset occurs at 02:11 ± 1 min UT with the eastern edge of the SCW located between 02:10 MLT and 02:50 MLT and the western edge of the SCW
located at ~ 23:40 MLT just to the east of the Halley magnetic meridian. The Halley HF radar is therefore in an ideal location to observe the effect of the upward FaC on the ionospheric convection.
3.3.2 Ionospheric convection response. In order to describe the ionospheric convection around the time of
Fig. 4. Stacked magnetograms of the H, D, and Z components from
Narssarssuaq (NAQ), Halley (HAL) and St Johns (STJ ) between 00:00 UT and 05:00 UT on 13 June 1988. Note the different scale for NAQ. The data are in local magnetic coordinates where the
quiet-time magnetic field is in the H-Z plane. Positive H points to local magnetic north, positive D to local magnetic east, and positive Z to nadir for NAQ and STJ and zenith for HAL
Table 1. The positions of ground magnetometers and geostationary spacecraft used to infer the location of the substorm current wedge
Substorm onset at 02:11 ± 1 min UT
Station Code Geomagnetic coordinates Inferred location
N Latitude E Longitude MLT w.r.t. SCW
Ottawa OTT 56.6 0.2 21:34 Outside
Argentine Islands AIA )49.6 9.0 22:09 Outside
Halley HAL )61.1 28.8 23:28 Just outside
St Johns STJ 54.5 31.2 23:38 Just outside
LANL 1987–097 097 )66.0a 34.2a 23:50 Inside
Narssarssuaq NAQ 66.6 44.3 00:30 Inside
Leirvogur LRV 65.2 68.2 02:06 (Inside)
Faroes FAR 60.8 78.4 02:47 Just outside
Glenmore GML 55.1 78.4 02:47 Just outside
York YOR 51.2 79.2 02:50 Just outside
aMagnetic footprint in the Southern Hemisphere mapped from geostationary orbit using the Tsyganenko (1987) field model for the lowest
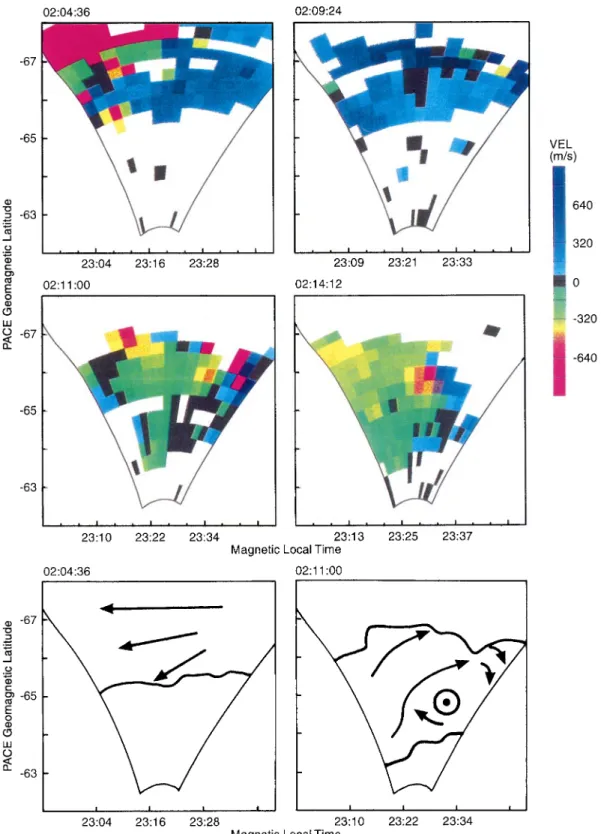
substorm onset, data from the Halley HF radar are shown in Fig. 5. The panel of radar data is divided into four (not all consecutive) radar scans. Each scan displays line-of-sight velocities, colour coded to indicate flow towards (positive velocities) and away from (neg-ative velocities) the radar.
The line-of-sight velocities in the first scan, starting at 02:04:36 UT (approx. 6–7 min before substorm onset), are negative in the western beams at higher latitudes, that is flow with a component away from the radar, and then traverse the colour scale so that they are positive in the western beams at lower latitudes and also positive in
Fig. 5. Colour coded radar maps of the line-of-sight Doppler velocity
measured by the Halley HF radar around the time of substorm onset.
Positive (negative) velocities indicate a flow component towards (away
from) the radar. The cartoons illustrate ionospheric convection con-sistent with the radar observations at 02:04:36 UT and 02:11:00 UT (i.e. The data panels on the left hand side).
the eastern beams, that is flow with a component towards the radar. At the bottom of the figure is a cartoon which is consistent with the radar observations. It suggests that the radar observes the return flow at the edge of the dusk convection cell associated with the DP2 auroral electrojets.
The second scan, starting at 02:09:24 UT (the last scan prior to substorm onset), illustrates that flow with an equatorward component dominates across the FoV. The cartoon that fits the 02:04:36 UT observations is consistent also with the second scan if the generally westward flow in this cartoon is rotated by about 15° equatorward.
The next available scan starting at 02:11:06 UT demonstrates that immediately after substorm onset, there has been a dramatic change to the flow pattern: the predominantly equatorward component that exists im-mediately prior to onset has been replaced by a predominantly poleward flow component. The timing is quite remarkable: the sudden change in flow is at exactly the same time as substorm onset when the SCW is established in the auroral ionosphere. The accompa-nying cartoon illustrates the effect that this current system has on the flow in the radar FoV. The upward FaC of the SCW is on the eastern side of the FoV and drives an ionospheric flow around it. Such a flow is not inconsistent with the observed line-of-sight velocities and a current system similar to this may well exist after substorm onset. However, it should be emphasised that the situation could well be more complicated than this idealised cartoon.
The final scan starting at 02:14:12 UT displays the flow pattern that is observed a few minutes after substorm onset. The region of predominantly poleward flow appears to have moved to the west, suggesting possible expansion of the SCW. Eastward of this region of poleward flow, there is an absence of backscatter. The loss of backscatter may be attributed to either the absorption or screening by sporadic E of the HF radar signal caused by energetic electron precipitation in the equatorward part of the radar FoV. Screening may be more likely as data from the Halley Advanced Iono-spheric Sounder show auroral sporadic E precipitation poleward of Halley in association with the upward FaC carried out of the western end of the SCW.
4 Discussion
The ground magnetometer and geostationary spacecraft data show very clearly the development of the substorm through the traditional growth, expansion and recovery phases. In this study, the key issues concern new observations by the Halley HF radar of the electric field response to the growth phase and the expansion phase onset. The growth phase is preceded by a prolonged interval of magnetic quiescence, such that prior to substorm activity, the magnetosphere is likely to be close to a ground state configuration. During the growth phase, an equatorward motion of the equatorward edge
of the radar backscatter is observed. At substorm onset, the radar is ideally located to observe the sudden reversal in the ionospheric convection from equator-ward to poleequator-ward directed flow, as the western edge of the SCW is imposed upon the auroral ionosphere.
Firstly, we discuss the equatorward expansion of the HF radar backscatter during the substorm growth phase. A clue to the most plausible explanation for this comes from the substorm study of Samson (1994). He reports an equatorward motion of 630.0 nm, 557.7 nm and 486.1 nm emissions in the midnight sector during the substorm growth phase (see his Fig. 3 or alterna-tively Fig. 1 of Samson et al., 1992), which is very similar to the equatorward expansion of the HF radar backscatter described in this work. Not only does it look the same but we believe it has the same underlying physical cause. Previously, we linked the backscatter to the Feldstein auroral oval and to the region around the bp/cp boundary. It is known that precipitation from this region causes the auroral emissions observed by Samson (1994). Thus, the auroral emissions and the HF radar backscatter can be expected to be coincident. Samson (1994) suggests that the equatorward motion ‘‘probably results from the increase in the cross-tail current near the Earth and the stretching of field lines.’’ Consequent-ly we propose the same explanation of the equatorward expansion of the HF radar backscatter.
Secondly, we comment on the structure within the HF radar backscatter. We noted before that there is a poleward gradient in the Doppler spectral width of the backscatter (see Fig. 3). Given the relationship between the backscatter and the auroral emissions, the gradient in the Doppler spectral width presumably corresponds to a similar gradient in the spectrum and variability of the precipitation, and hence the conductivity and electric fields of the discrete aurora. The physical significance of this spectral width gradient for the coupling between the ionosphere and the magnetosphere is the subject of further work. It is a common feature within the HF radar dataset.
Thirdly, we summarise the evolution of the iono-spheric flow during the growth phase. To begin with, the radar backscatter lay along the quiet-time Feldstein oval and the flow was inferred to be aligned with it. Subsequently, the radar backscatter began to expand equatorward and a corresponding equatorward compo-nent was added to the flow.
This growth phase signature is not unique within the Halley HF radar dataset. We note that low Kp values prevailed prior to the substorm. We believe that this signature corresponds to a particular class of growth phase that requires an extended quiet-time configuration of the magnetosphere prior to substorm activity. Under these conditions, the ring current density is at a minimum level (we note Dst is positive throughout the interval studied) and thus least effective at screening the magnetospheric cross-tail electric field from lower lati-tudes (Southwood, 1977). We shall leave this interesting point open to further investigation.
Finally, we discuss the implications of our observa-tions at the time of substorm onset. STARE VHF radar
observations analysed by Inhester et al. (1981) and Opgenoorth et al. (1983) showed that the electric field centred about the head of the WTS had an inwardly directed radial component. In the study by Opgenoorth et al. (1983), simultaneous measurements from a rocket flight revealed the electric field was weak inside the surge.
The STARE data were complemented with data from the Scandinavian Magnetometer Array. The ground magnetometers provided concurrent spatial information on the ionospheric equivalent currents. Using the electric field data, detailed models of the WTS and the SCW were developed by varying the assumed conduc-tivity distribution until the model currents agreed roughly with the observed equivalent currents. It was found that within the WTS, an intense westward Cowling current fed a net upward FaC at its western edge. Within the surge itself, there was high conductivity which resulted in a weak electric field that was lower than the threshold required for VHF backscatter. Further to this, we note that outside the highly conducting Cowling channel, the radial component to the electric field drove a Pedersen current toward the centre of the surge head, which also feeds the upward FaC. Therefore, a vertical Hall current flows perpen-dicular to the Pedersen current. This vortical current can be seen in the equivalent current pattern.
It is easy to envisage the observations presented here within this framework. This is sketched in the right-hand cartoon of Fig. 5. At substorm onset, the radar observed a sudden change from equatorward to poleward direct-ed flow as an immdirect-ediate consequence of the establish-ment of the SCW in the auroral ionosphere. This is consistent with the previous STARE work. The plasma flow at F-region altitudes is driven perpendicular to the electric field, which points radially to the centre of the surge. Thus, outside the WTS the flow is in a clockwise direction and, to the west of the upward FaC, the flow should have a poleward component, as is observed by the Halley HF radar in the present example. This in turn is confirmation for the location of the SCW as deduced from the ground magnetometer data.
We now compare our results with the HF radar observations of Morelli et al. (1995) and Yeoman and Pinnock (1996). These authors claimed to observe char-acteristics of a WTS with the Halley HF radar, and whilst there are similarities in the results, there are several important differences.
Morelli et al. (1995) described a region of low flow as the signature of the WTS. Ahead of the WTS (i.e. to the west) they observed enhanced equatorward flows, in contrast to the enhanced poleward flows observed in the present example and in the STARE work. Morelli et al. (1995) argue that the high conductivity region of the WTS creates an obstacle which diverts the background flow around it. In their example, the background flow has a large equatorward component, which is therefore enhanced west of the WTS. In their model, the effect of the upward FaC of the WTS is not included. As discussed already, this current draws a radial Pedersen current driving a clockwise vortical flow around the
upward FaC. To the west of the FaC this contributes a poleward flow component. Thus we conclude that in the study by Morelli et al. (1995) the vortical flow driven by the upward FaC must have been weak compared to the background equatorward flow, such that the primary effect of the WTS on the flow was that due to the conductivity enhancement alone. In our study and others (i.e. Inhester et al., 1981; Opgenoorth et al., 1983), the effect of the upward FaC is dominant, yielding the poleward flow component to the west of the WTS. Certainly in our study the background current would have been relatively weak because the ionosphere poleward of Halley was in 24 hour darkness on this day. For the example studied by Yeoman and Pinnock (1996), which occurred much closer to dusk (19:20 MLT as opposed to 22:00 MLT), enhanced poleward flow is observed to the west of the WTS (as in this study). In their example, this may be the vortical flow associated with the upward FaC of the WTS. Alternatively, it could meet the requirements of the Morelli et al. (1995) obstacle argument if there was a background eastward flow. This would mean that the WTS would have to propagate along the convection reversal boundary in the evening sector.
Herein lies another difference between our observa-tions and these previous. The data presented here have demonstrated that the flow reconfiguration occurred as an immediate consequence of the establishment of the upward FaC of the SCW in the Halley MLT sector, but both Morelli et al. (1995) and Yeoman and Pinnock (1996) reported a WTS propagating into the FoV of the radar. This difference may be important also in under-standing the behaviour of the flow (to the WTS).
5 Conclusions
The electric field response to the growth phase and expansion phase onset of a simple isolated substorm has been comprehensively described by the Halley HF radar. The availability of the AE index provided an overview of the substorm growth and expansion phases, whereas more precise information on the timing of the expansion phase onset and the location of the SCW was deduced from the injection of energetic particles at geostationary orbit and from magnetic bay and Pi2 pulsation activity on the ground.
During the growth phase, the backscatter recorded by the Halley HF radar was observed to move to lower latitudes as well as widen in latitudinal range. This signature is not unique within the radar dataset and seems to occur following an extended period of magnetic quiet. It is very similar to the behaviour of auroral emissions reported by Samson (1994). The equatorward expansion of the backscatter was described by a series of Feldstein auroral ovals of progressively higher geomag-netic activity: it was not consistent with that expected for the variation of the auroral oval with MLT for a fixed activity level.
Also during the growth phase, the flow adopted a more equatorward component. This change was broadly
consistent with the rate of expansion of the equatorward backscatter boundary.
An additional interesting aspect to the radar data was a poleward gradient in the Doppler spectral width, which may map to a magnetospheric boundary. DMSP data indicated that the backscatter region corresponded to the region of magnetospheric precipitation around the bp/cp boundary. Understanding the relationship between Doppler spectral width and night-side magne-tospheric precipitation is a priority for our future work. Immediately before substorm onset, the ionospheric convection observed by the Halley HF radar was governed by the DP2 auroral electrojets. However, immediately after onset a sudden change occurred as the flow direction reversed from an equatorward to a poleward component. The observations were shown to be consistent with the effect of the upward FaC contained with the WTS of the SCW having been imposed directly with the Halley FoV.
We have identified key features in the Halley HF radar observations during the substorm growth phase and expansion phase onset. Moreover at onset, the radar was ideally located to sense the establishment of the upward FaC of the SCW in the auroral ionosphere. The prospect of combining similar observations from the SuperDARN network of HF radars with ISTP mission spacecraft should further enhance our under-standing of the magnetospheric substorm process.
Acknowledgements. We would like to thank Mike Pinnock at the
British Antarctic Survey (BAS) and Mark Lester and Tim Yeoman at the University of Leicester for useful discussions. We thank Nick Mattin (BAS) for the excellent software support that he continues to provide for the Halley HF radar and Alex Graham (BAS) for help with the production of Fig. 1. We are grateful to Pat Newell at the Applied Physics Laboratory, Maryland, USA for use of the DMSP neural network and to Dick Belian, principal investigator on the Los Alamos spacecraft instruments. We wish also to thank Toshi Iyemori at the World Data Centre C2 for Geomagnetism, Kyoto, Japan for providing the AE index, Teresa Moretto at the Danish Meteorological Institute, Copenhagen, Denmark for pro-viding the Greenland magnetometer data and Gerrit Jansen van Beek at the Geological Survey of Canada, Ottawa, Canada for providing the Canadian magnetometer data. The Halley HF radar is funded jointly by the UK Natural Environment Research Council and the US National Science Foundation, Department of Polar Programmes under grant DPP-8602975. SAMNET is de-ployed and operated by the University of York.
Topical Editor K.H. Glaßmeier thanks J.S. Murphree and C. Senior For their help in evaluating this paper.
References
Abasofu, S.-I., The development of the auroral substorm, Planet.
Space Sci., 12, 273, 1964.
Baker, D. N., R. D. Belian, P. R. Higbie, and E. W. Hones,
High-energy magnetospheric protons and their dependence on geomagnetic and interplanetary conditions, J. Geophys. Res.,
84, 7138, 1979.
Baker, D. N., T. I. Pulkkinen, R. L. McPherron, J. D. Craven, L. A. Frank, R. D. Elphinstone, J. S. Murphree, J. F. Fennell, R. E. Lopez, and T. Nagai, CDAW 9 analysis of magnetospheric
events on May 3, 1986: event C, J. Geophys. Res., 98, 3815, 1993.
Baker, K. B., and S. Wing, A new magnetic coordinate system for
conjugate studies at high latitudes, J. Geophys. Res., 94, 9139, 1989.
Baker, K. B., R. A. Greenwald, J. M. Ruoboneimi, J. R. Dudeney, M. Pinnock, N. Mattin, and J. M. Leonard, PACE, Polar
Anglo-American Conjugate Experiment, Eos, 70, 785, 1989.
Baumjohann, W., Ionospheric and field-aligned current systems in
the auroral zone: a concise review, Adv. Space Res., 2, 55, 1983.
Baumjohann, W., R. J. Pellinen, H. J. Opgenoorth, and E. Nielsen,
Joint two-dimensional observations of ground magnetic and ionospheric electric fields associated with auroral zone currents: current systems associated with local auroral break-ups, Planet.
Space Sci., 29, 431, 1981.
Clauer, C. R., and R. L. McPherron, Mapping the local
time-universal development of magnetospheric substorms using mid-latitude magnetic observatories, J. Geophys. Res., 79, 2811, 1974.
Davis, T. N., and M. Sugiura, Auroral electrojet activity index AE
and its Universal Time variations. J. Geophys. Res., 71, 785, 1966.
Feldstein, Y. I., On morphology of auroral and magnetic
distur-bances at high latitudes, Geomagn. Aeron., 3, 183, 1963.
Friis-Christensen, E., M. A. McHenry, C. R. Clauer, and S. Ve-nnerstrøm, Ionospheric traveling convection vortices observed
near the polar cleft: a triggered response to sudden changes in the solar wind, Geophys. Res. Lett., 15, 253, 1988.
Greenwald, R. A., K. B. Baker, R. A. Hutchins, and C. Hanuise, An
HF phased array radar for studying small-scale structure in the high-latitude ionosphere, Radio Sci., 20, 63, 1985.
Greenwald, R. A., K. B. Baker, J. R. Dudeney, M. Pinnock, T. B. Jones, E. C. Thomas, J.-P. Villian, J.-C. Cerisier, C. Senior, C. Hanuise, R. D. Hunsucker, G. Sofko, J. Koehler, E. Nielsen, R. Pellinen, A. D. M. Walker, N. Sato, and H. Yamagishi, DARN/SuperDARN: a global view of the
dynamics of high-latitude convection, Space Sci. Rev., 71, 761, 1995.
Holzworth, R. H., and C.-I Meng, Mathematical representation of
the auroral oval, Geophys. Res. Lett., 2, 377, 1975.
Inhester, B., W. Baumjohann, R. A. Greenwald, and E. Nielsen,
Joint two-dimensional observations of ground magnetic and ionospheric electric fields associated with auroral zone currents, 3, Auroral zone currents during the passage of a westward travelling surge, J. Geophys., 49, 155, 1981.
McPherron, R. L., C. T. Russell, and M. P. Aubry, Satellite studies
of magnetospheric substorms on August 15, 1968: 9. Phenom-enological model for substorms, J. Geophys. Res., 78, 3131, 1973.
Morelli, J. P., R. J. Bunting, S. W. H. Cowley, C. J. Farrugia, M. P. Freeman, E. Friis-Christensen, G. O. L. Jones, M. Lester, R. V. Lewis, H. Lu¨hr, D. Orr, M. Pinnock, G. D. Reeves, P. J. S. Williams, and T. K. Yeoman, Radar observations of
auroral zone flows during a multiple-onset substorm, Ann.
Geophysicae, 13, 1144, 1995.
Newell P. T., S. Wing, C.-I. Meng, and V. Sigillito, The auroral
oval position, structure and intensity of precipitation from 1984 onward: an automated on-line database, J. Geophys. Res., 96, 5877, 1991.
Opgenoorth H. J., R. J. Pellinen, W. Baumjohann, E. Nielsen, G. Marklund, and L. Eliasson, Three dimensional current flow
and particle precipitation in a westward travelling surge (observed during the Barium-GEOS rocket experiment),
J. Geophys. Res., 88, 3138, 1983.
Rostoker, G., S.-I. Akasofu, J. Foster, R. A. Greenwald, Y. Kamide, K. Kawasaki, A. T. Y. Lui, R. L. McPherron, and C. T. Russell,
Magnetospheric substorms – definitions and signatures,
J. Geophys. Res., 85, 1663, 1980.
Ruohoniemi, J. M., R. A. Greenwald, K. B. Baker, and J. P. Villian,
Drift motions of small-scale irregularities in the high-latitude F region: an experimental comparison with plasma drift motions,
J. Geophys. Res., 92, 4553, 1987.
Samson, J. C., Mapping substorm intensifications from the
of the Second International Conference on Substorms, Fairbanks,
Alaska, USA, p237, 1994.
Samson, J. C., L. R. Lyons, P. T. Newell, F. Creutzberg, and B. Xu,
Proton aurora and substorm intensifications, Geophys. Res.
Lett, 19, 2167, 1992.
Southwood, D. J., The role of hot plasma in magnetospheric
convection, J. Geophys. Res., 82, 5512, 1977.
Tsyganeko, N. A., Global quantitative models of the geomagnetic
field in the cislunar magnetosphere for different disturbance levels, Planet. Space Sci., 35, 1347, 1987.
Yeoman, T. K., and M. Pinnock, The high-latitude convection
response to an interval of substorm activity, Ann. Geophysicae,
14, 518, 1996.
Yeoman, T. K., D. K. Milling, and D. Orr, Pi2 pulsation
polariza-tion patterns on the UK. sub-auroral magnetometer network (SAMNET), Planet. Space Sci., 38, 589, 1990.