HAL Id: hal-03138096
https://hal.archives-ouvertes.fr/hal-03138096
Submitted on 11 Feb 2021
HAL is a multi-disciplinary open access
archive for the deposit and dissemination of
sci-entific research documents, whether they are
pub-lished or not. The documents may come from
teaching and research institutions in France or
abroad, or from public or private research centers.
L’archive ouverte pluridisciplinaire HAL, est
destinée au dépôt et à la diffusion de documents
scientifiques de niveau recherche, publiés ou non,
émanant des établissements d’enseignement et de
recherche français ou étrangers, des laboratoires
publics ou privés.
Understanding the Dynamics of the Oxic-Anoxic
Interface in the Black Sea
Emil Stanev, Pierre-marie Poulain, Sebastian Grayek, Kenneth Johnson,
Hervé Claustre, James Murray
To cite this version:
Emil Stanev, Pierre-marie Poulain, Sebastian Grayek, Kenneth Johnson, Hervé Claustre, et al..
Under-standing the Dynamics of the Oxic-Anoxic Interface in the Black Sea. Geophysical Research Letters,
American Geophysical Union, 2018, 45 (2), pp.864-871. �10.1002/2017gl076206�. �hal-03138096�
Understanding the Dynamics of the Oxic-Anoxic
Interface in the Black Sea
Emil V. Stanev1,2 , Pierre-Marie Poulain3 , Sebastian Grayek1 , Kenneth S. Johnson4 , Hervé Claustre5 , and James W. Murray6
1
Institute of Coastal Research, Helmholtz-Zentrum Geesthacht, Geesthacht, Germany,2Research Department, University of Sofia, Sofia, Bulgaria,3Istituto Nazionale di Oceanografia e di Geofisica Sperimentale – OGS, Trieste, Italy,4Monterey Bay
Aquarium Research Institute, Moss Landing, CA, USA,5Laboratoire d’Océanographie de Villefranche, Villefranche-sur-Mer, France,6School of Oceanography, University of Washington, Seattle, WA, USA
Abstract
The Black Sea, the largest semienclosed anoxic basin on Earth, can be considered as an excellent natural laboratory for oxic and anoxic biogeochemical processes. The suboxic zone, a thin interface between oxic and anoxic waters, still remains poorly understood because it has been undersampled. This has led to alternative concepts regarding the underlying processes that create it. Existing hypotheses suggest that the interface originates either by isopycnal intrusions that introduce oxygen or the dynamics of manganese redox cycling that are associated with the sinking of particles or chemosynthetic bacteria. Here we reexamine these concepts using high-resolution oxygen, sulfide, nitrate, and particle concentration profiles obtained with sensors deployed on profiling floats. Our results show an extremely stable structure in density space over the entire basin with the exception of areas near the Bosporus plume and in the southern areas dominated by coastal anticyclones. The absence of large-scale horizontal intrusive signatures in the open-sea supports a hypothesis prioritizing the role of biogeochemical processes.1. Introduction
The Black Sea is characterized by sulfidic deep waters. This anoxic zone is separated from the oxic upper waters by a suboxic zone, where the concentrations of both oxygen and free sulfide are below reliable method detection limits. Murray et al. (1989)first identified this suboxic layer, and it has been the subject of extensive investigation ever since (references follow). Oxygen and sulfide are the dominant redox species above and below the suboxic layer. However, the downwardflux of oxygen does not appear to be sufficient to oxidize the upwardflux of sulfide (Brewer & Murray, 1973). The existence of the suboxic zone requires that alternative redox processes control this system, particularly the upwardflux of highly toxic sulfide. Here we report data collected over 2 years using a robotic observing system based on profiling floats equipped with chemical sensors for oxygen, sulfide, nitrate, and biomass to study this system. This builds on earlier work in the Black Sea using profiling floats with oxygen and bio-optical sensors (Stanev et al., 2013, 2017), which have become the dominant source of data for this region (Capet et al., 2016).
The suboxic zone has been delimited by oxygen concentration limits ranging from 3μM to 20 μM (Glazer et al., 2006; Murray et al., 1989, 1995; Konovalov & Murray, 2001; Lam et al., 2007; Trouwborst et al., 2006). This zone occurs at different depths in the Black Sea, but everywhere occurs in a narrow density interval, approximately between the isopycnals ofσθ15.20 and 16.40 (Codispoti et al., 1991; Lewis & Landing, 1991; Tugrul et al., 1992; Vinogradov & Nalbandov, 1990).
Several hypotheses have been proposed to explain the origin of the suboxic zone and its role in suppressing the upward sulfide flux (Konovalov et al., 2003, 2006; Murray & Yakushev, 2006; Trouwborst et al., 2006). One class of hypotheses focuses on the role of biogeochemistry (H-BGC), while the second is based on lateral transport by ocean physics of suboxic water masses formed near the Bosporus (H-PHYS). The biogeochemical mechanisms may include either chemosynthesis (Jørgensen et al., 1991; Murray et al., 1995) or a redox shuttle based on manganese oxidation/reduction that is coupled with sulfide/elemental sulfur/sulfate cycling (Luther III et al., 1991; Trouwborst et al., 2006). Rate measurements suggest that the phototropic chemosynth-esis plays only a small role (Overmann & Manske, 2006), yet there are other nonphototrophic chemosynthchemosynth-esis pathways (Brewer & Murray, 1973). Yilmaz et al. (2006) measured dark uptake of14C in the suboxic zone at two stations, and the integrated rates due to chemosynthesis were 30% and 90% of the total water
PUBLICATIONS
Geophysical Research Letters
RESEARCH LETTER
10.1002/2017GL076206
Key Points:
• Existing hypotheses explaining the formation of suboxic zone are validated
• Biogeochemical processes provide the dominant mechanism controlling dynamics of suboxic zone • The profiling float data provide an
unprecedented view of the spatial and temporal variability in the redox structure of the Black Sea
Supporting Information: • Supporting Information S1 Correspondence to: E. V. Stanev, [email protected] Citation:
Stanev, E. V., Poulain, P.-M., Grayek, S., Johnson, K. S., Claustre, H., & Murray, J. W. (2018). Understanding the dynamics of the oxic-anoxic interface in the Black Sea. Geophysical Research Letters, 45, 864–871. https://doi.org/10.1002/ 2017GL076206
Received 28 OCT 2017 Accepted 9 JAN 2018
Accepted article online 19 JAN 2018 Published online 24 JAN 2018
©2018. American Geophysical Union. All Rights Reserved.
column biological production. Manganese reactions, which generate particulate manganese oxides, may also be significant (Yakushev et al., 2007). In this mechanism, manganese acts as a redox shuttle that consumes both sulfide and oxygen (Figure 1a). An upward flux of dissolved Mn(II,III) passes through the suboxic zone into the oxic layer where it is oxidized to particulate Mn(III,IV), which removes the remnants of oxygen not consumed by organic matter (Konovalov et al., 2005). The particulate Mn(III,IV) oxides then sink back through the suboxic zone to the anoxic layer where they serve as an oxidant for sulfide. The oxidized sulfide ends up as elemental sulfur (S°)(Konovalov et al., 2003). S° is reduced back to H2S by bacteria such
as Shewanella (Perry et al., 1993). Mn (II,III) is regenerated, which completes the redox shuttle (Johnson, 2006; Luther III et al., 1991; Tebo, 1991; Trouwborst et al., 2006). Dissolved forms of iron can also contribute to oxidation (Dellwig et al., 2010; Pakhomova et al., 2009; Yemenicioglu et al., 2006), but thefluxes of iron are less important than for manganese (Brewer & Murray, 1973; Konovalov et al., 2006).
In the H-PHYS (Konovalov et al., 2003, 2005; Murray et al., 1995) model, the suboxic zone was envisioned as a rapidly, well-mixed box. The concentrations of O2and H2S within the box were controlled by the balance Figure 1. The dominant reactions around (a) the suboxic zone and (b) the trajectory offloat WMO#6901866. The circles in Figure 1b identify the surfacing position. The white circles (B, G, and EB) show specific positions discussed in the text. The timing of observations is given approximately once per 3 months, respectively; the circle-symbol there is bigger. AC indicates the position of the anticyclone mentioned in text. The inset shows the position of studied Black Sea region.
between the sources and sinks at the upper, lower, and side boundaries. Oxygen had transport sources across the upper and side boundaries and a sink at the lower boundary where it was consumed during oxidation of sulfide. This model, with horizontal fluxes, was proposed because calculated vertical fluxes of reductants and oxidants across the upper and lower boundaries alone appeared insufficient to maintain the redox balance of the suboxic zone.
The relative importance of the mechanisms encapsulated by H-BGC and H-PHYS in the creation of the suboxic layer is not entirely clear. Konovalov et al. (2003) and Glazer et al. (2006) found strong evidence for lateral intrusions of water from the Bosporus within the suboxic region. They suggest that lateral transport is a dominant mechanism in the redox budget. A numerical model developed by Konovalov et al. (2006) quantified the role for lateral transport of oxygen as a mechanism to remove sulfide in the suboxic zone. Konovalov et al. (2005) suggested that two thirds of the sulfide was oxidized due to lateral inputs from the Bosporus. However, Yakushev et al. (2009, 2007) developed a vertical 1-D model that closely replicates the complex Black Sea vertical structure using measured redox reaction rates. This model had no lateral transport and suggested a limited role for H-PHYS, relative to H-BGC. We focus on the implications of the profiling float data for these two classes of hypotheses. Furthermore, we analyze the concentrations of particles, oxygen, and sulfide with the aim of better understanding the relationships between physical and biogeochemical processes in the Black Sea. Our major interest is on the specific structure and evolution of the suboxic zone as an interface between the oxic and anoxic waters.
2. Description of Observations
On 27 May 2015 a BGC-Argo profiling float, WMO#6901866, was deployed in the western Black Sea (Figure 1b). This NKE Provor-CTS4float was equipped with a Seabird SBE 41 CTD, an Aanderra 4330 optode to measure dissolved oxygen, a Satlantic SUNA sensor for measurement of sulfide and nitrate (Johnson et al., 2013; Johnson & Coletti, 2002), and a WETLabs ECO Triplet Puck measuring particulate backscattering at 700 nm bbp(700). The latter is a proxy for particle concentration between submicroscopic and ~10μm size range
(Stanev et al., 2017), which includes inorganic particles, heterotrophic bacteria, and coccoliths. However, bbp(700) cannot allow identifying specific bacteria types or inorganic particles, so the in-depth biogeochemical
interpretation of our observations would require careful analysis in the future. More details about observations, signal processing, and definitions are given in section S1 in the supporting information.
As of 15 October 2017 (last sampling date included here) thefloat had completed 176 profiles with maximum depths of 1,000 m. Thefloat did one and a half loops in the western gyre (Figure 1b) following approximately the main cyclonic Rim Current. Between the Rim Current and the coast a number of coastal anticyclonic eddies occur (e. g., the anticyclone AC in Figure 1b), which play an essential role for Black Sea biogeochem-istry and ventilation of its anoxic waters (Stanev et al., 2014). At the end of 2016 thefloat moved along the southern coast into the eastern basin. White color is used in Figure 1b to define specific positions along thefloats’ trajectory discussed in text.
3. The Physical and Biogeochemical Properties
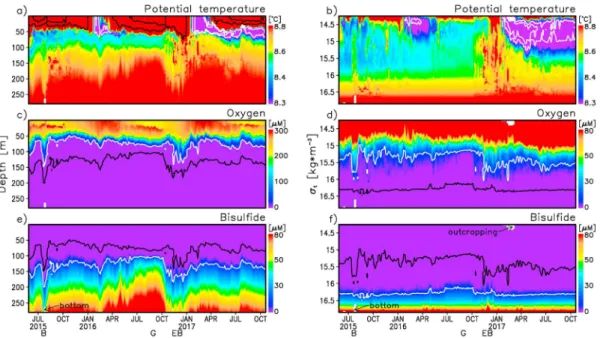
The profiling float data were measured continuously over more than 2 years, thus enabling a broad scale presentation of the interdependencies between different properties. The observations in depth and density coordinates are shown in Figure 2. The seawaterflowing out of the Bosporus is a high temperature and sali-nity end-member. Another thermohaline end-member is the cold intermediate layer (CIL) between 50 and 150 m (Figures 2a and 2b). Water below the core of CIL is made by linear mixing between these two end-members (Murray, 1991). These end-end-members are variable in time, as seen by the dramatic cooling in 2016–2017 after two milder winters; thus, the T-S properties are not strictly linear.
A subsurface oxygen maximum at ~20–30 m, which has been observed with earlier BGC-Argo missions (Stanev et al., 2013), appears as a robust seasonal characteristic (Figure 2c). Large changes in the sulfide concentrations (Figure 2e) identify dynamically different areas observed by thefloat, in which vertical motion brings anoxic waters to shallower or deeper positions. This is proven by the presentation of temporal evolu-tion in density coordinates where sulfide concentrations almost follow the isopycnals. Furthermore, the presentation in density coordinates reveals thermal intrusions affecting biogeochemical patterns. Below the core of the CIL, the thermal properties do not follow density surfaces (Figure 2b), which illustrates the
role of diapycnal mixing. The deepest most temperature intrusions are in the vicinity of the Bosporus Strait (location“B”) and when the float enters the eastern basin (location “EB”). These times and locations are shown in Figures 1b and 2. The onset of the suboxic zone is approximately at the bottom of the CIL, which is at σt
~15.4–15.6 that is in the zone of mixing between two end-members. The extreme cooling in 2016–2017 is obviously the reason for the deepening of suboxic zone in 2017. Sulfide profiles shoal in the center of cyclonic gyre (timing is indicated as “G” in Figure 2e; the respective position is shown Figure 1b) illustrating their displacement due to upwelling. The uncorrelated changes of the two boundaries of suboxic zone (Figures 2d and 2f) (see also Konovalov & Murray, 2001) reflect the isopycnal/diapycnal character of processes at its bottom/top, respectively.
The vertical offsets between the oxic zone, defined here by oxygen concentrations more than 0.7μM above background values in the anoxic zone, and the top of the anoxic zone defined by sulfide concentrations greater than 0.5μM above values in the upper 50 m are shown in Figure 3. These concentrations correspond to a robust estimate of detection limits of the sensors. From thisfigure the densi-ties and depths at which concentrations of oxygen reach 0.7μM and sulfide reaches 0.5 μM above background are well revealed. The lowest oxygen concentrations observable were displaced above the top of the anoxic zone by a mean distance of 21 m (Figure 3, bottom). The concentrations of sulfide and oxygen never crossed; the suboxic zone was present in all of the 176 profiles. In extreme cases of strong mixing (e. g., locations B and EB, see Figure 1 for their position) suboxic zone was very thin (Figures 4b and 4c), and oxygen or sulfide lenses were detected (Figure 2). The offset in the lowest detectable Figure 2. Vertical and temporal change of temperature, oxygen, and sulfide. (a, c, and e) Depth scale. (b, d, and f) Density (σt) scale. The following isolines are plotted: 10 and 20°C in Figure 2a in order to better see the stratification in the seasonal thermocline and 7.5 and 8°C in Figures 2a and 2b in order to better see the core of CIL, and 10μM for oxygen and sulfide in Figures 2c–2f to approximately show the boundaries of suboxic zone. Letters B, G, and EB on the bottom show times discussed in text (the respective positions are shown in Figure 1).
Figure 3. The vertical offsets between the oxic zone, defined here by oxygen concentrations more than 0.7μM above background values in the anoxic zone, and the top of the anoxic zone defined by sulfide concentrations greater than 0.5μM above values in the upper 50 m shown in (top) density and (bottom) depth coordinates.
nitrate concentrations from the top of the anoxic zone averaged 14 m (not shown), consistent with expectations that it is generally deeper than the oxic boundary (see Fuchsman et al., 2008, for more details about profiles of nitrogen species and related processes).
While the densities on which the oxic and anoxic boundaries lie are relatively more constant than the corre-sponding depths, there is a clear trend of the anoxic and oxic boundaries to lower densities during the summer of 2016 (Figure 3, top), when thefloat was in the center of the western basin (see location G in Figure 1b). The anoxic boundary density anomaly varies from 15.82 to 16.25 after smoothing the individual values in Figure 3 (top) with a 5-point running mean. The anoxic boundary in the eastern basin lies on a simi-lar density surface as found when thefloat was following the Rim Current in the western basin. Variability in the isopycnal surface on which the anoxic boundary is found has been observed before (Glazer et al., 2006; Konovalov et al., 2003; Murray & Yakushev, 2006). The density anomaly values on which the 0.5μM sulfide values were found spanned a range of 0.69 (0.43 after smoothing; Table 1). This range was larger than observed in prior studies (Table 1), which had many fewer profiles. The large range of conditions on which the anoxic boundary was observed in this study, relative to prior work, suggests that thefloat has sampled all of the conditions observed in the previous 30 years. We believe that our data represent the only high-resolution observations of systematic variability in the isopycnal of the upper anoxic boundary.
The top of the anoxic zone is characterized by a maximum in light scattering by particles (Figure 4). The core of this bbp(700) maximum near a density anomaly of 16.2 kg m 3follows the isopycnal variations with depth and corresponds closely to the 3μM sulfide contour (Figure S1b). This particle maximum layer is decoupled from the surface maximum in light scattering at density anomalies less than 14.5 kg m 3by a well-defined minimum in bbp(700). The surface maximum in bbp(700) is produced by phytoplankton. Particle maxima Figure 4. Vertical profiles in density coordinates shown as (a) scatterplots of bbp(700), all data, or individual profiles of temperature (blue), oxygen (green), sulfide (red), and bbp(700) (dark yellow) in locations (b) B, (c) G, and (d) EB, respectively.
in suboxic and anoxic zones in the Arabian Sea (Naqvi et al., 1993) and in the Eastern Tropical South Pacific (Ulloa et al., 2012; Whitmire et al., 2009) were attributed to bacterial populations that were oxidizing organic carbon using nitrate as a terminal electron acceptor. Here it is likely that the particle maximum consists of chemoautotrophic bacterial populations that are oxidizing sulfide and the sinking MnOx particles. A relationship between the bbp(700) profile curvature and the intensity of the biogeochemical reactions (Stanev et al., 2014, give an interpretation of this relationship) also suggests that chemo-synthetic bacteria dominate the light scattering. Light scattering is greatest when thefloat reached location B (see Figure 1), 200 km NE of the Bosporus. However, elevated light scattering at the top of the anoxic zone is found over the entire transect (Figure S1).
4. H-BGC Versus H-PHYS
The present observations provide important constraints on the processes that create the suboxic zone. During August–September 2015 just after the float left the Bosporus region (Figure 1b), oxygen lenses in or below the suboxic zone were observed as small-scale anomalies in Figures 2d and 2f, suggesting interleav-ing of water layers (see also Figure 4b). However, this seems to be a local effect. When thefloat’s trajectory was in the open sea, traces of oxygen below the upper boundary of the suboxic zone, directly linked to the Bosporus inflow, were not observed. This conclusion is reinforced by the characteristic times correspond-ing to the major terms in the tracers’ equations. For characteristic scales of horizontal velocity at 200 m of 0.07 m/s (Korotaev et al., 2006), horizontal/vertical scales of 105m and 5 × 101m, and coefficients of horizon-tal and vertical diffusion of 5 × 10²m2/s and 2 × 10 6m2/s (molecular diffusion; Gregg & Yakushev, 2005), characteristic times are tadv= 12 days, thor diff= 200 days, and tvert diff= 104days. The half-time of oxidation
of sulfide by oxygen is ~1 day (Millero, 1991); thus, it is questionable whether horizontal (isopycnal) diffusion can dominate the oxidation basin-wide. In regions away from the Bosporus the upwardflux of sulfide must be oxidized by some other electron acceptor than oxygen.
Further, the trend for the upper boundary of the anoxic zone to migrate to lower densities within the center of the western basin (location G in Figure 1b), which is clear in thefloat data (Figure 3, top), has also been seen in earlier studies (Glazer et al., 2006; Konovalov et al., 2003; Murray & Yakushev, 2006). If the migration of the upper limit of the anoxic zone across isopycnals is a persistent feature, then this would also argue that the lateral injection mechanism of H-PHYS is primarily a local effect. Such injections combined with very low rates of vertical mixing would constrain the top of the anoxic zone to a constant isopycnal. Given the clear and, apparently persistent, migration of the anoxic boundary across isopycnals (Figures 4b–4d), our observations tend to support the modeling results of Yakushev et al. (2007), which reproduce observed chemical distribu-tions without requiring lateral transport.
Support for H-BGC is found in the light scattering data. Unlike oxygen or sulfide, backscattering by particles (bbp(700)) provides a measurable signal within the suboxic zone. Gravitational settling would tend to sepa-rate particles from a given isopycnal. The consistent relationship, throughout both basins, between the deep backscattering maximum near a density anomaly of 16.2 and the 3μM sulfide contour suggests that this is an active, biological feature. Consistent with observations in other suboxic regions (Naqvi et al., 1993; Ulloa et al., 2012; Whitmire et al., 2009), the redox boundary of Black Sea appears to support an observable biomass. Such a feature would be consistent with an active population of bacteria that derives its energy from the sharp, redox gradient.
5. Conclusions
The profiling float data provide an unprecedented view of the spatial and temporal variability in the redox structure of the Black Sea. The observations are similar to a suite of prior observations. The redox conditions observed in the 2 year period sampled by thefloats are consistent with the entire variability observed over the past 30 years (Konovalov et al., 2005). This suggests that much of the previous variability that has been assigned to decadal-scale processes is present at all times in the Black Sea, but not well recognized due to undersampling. Furthermore, with itsfine temporal sampling, present observations reveal a number of Table 1
Maximum and Minimum Density Anomaly Values (kg m 3) at the Top of the Anoxic Zone and Range (Maximum Minimum)
Reference Density anomaly at anoxic zone Range This work 15.74–16.43 (15.82–16.25) 0.69 (0.43) (Konovalov et al., 2003) 16.20–16.38 0.18 (Murray & Yakushev, 2006) 15.97–16.23 0.26 (Glazer et al., 2006) 16.04–16.33 0.29 Note. Values in parentheses were smoothed with a 5-point running mean.
variability patterns associated either with the regional oceanographic conditions (e.g., general circulation, coastal processes, and intrusions) or with the response of interannual change in atmospheric forcing (severe winter cooling). The latter appeared clearly during the extremely cold winter of 2017 when the anoxic waters were displaced to deeper density layers.
The structure of the chemical properties observed across the major redox gradients in the Black Sea appears to be most consistent with biogeochemical processes, such as chemosynthesis or Mn cycling, as the domi-nant control mechanisms.
Finally, the data demonstrate the potential of profiling floats with chemical sensors to meet the objectives outlined by Capet et al. (2016) for a system that would observe temporal variability in the oxygen inventory and sulfide gradient of the Black Sea.
References
Brewer, P. G., & Murray, J. W. (1973). Carbon, nitrogen and phosphorus in the Black Sea. Deep Sea Research and Oceanographic Abstracts, 20, 803–818.
Capet, A., Stanev, E. V., Beckers, J.-M., Murray, J., & Gregoire, M. (2016). Decline of the Black Sea oxygen inventory. Biogeosciences, 13(4), 1287–1297. https://doi.org/10.5194/bg-13-1287-2016
Codispoti, L. A., Friederich, G. E., Murray, J. W., & Sakamoto, C. (1991). Chemical variability in the Black Sea: Implications of data obtained with a continuous vertical profiling system that penetrated the oxic-anoxic interface. Deep-Sea Research Part II: Topical Studies in Oceanography, 38, S691–S710.
Dellwig, O., Leipe, T., März, C., Glockzin, M., Pollehne, F., Schnetger, B.,… Brumsack, H.-J. (2010). A new particulate Mn-Fe-P-shuttle at the redoxcline of anoxic basins. Geochimica et Cosmochimica Acta, 74(24), 7100–7115. https://doi.org/10.1016/j.gca.2010.09.017
Fuchsman, C. A., Murray, J. W., & Konovalov, S. K. (2008). Concentration and natural stable isotope profiles of nitrogen species in the Black Sea. Marine Chemistry, 111, 90–105.
Glazer, B. T., Luther, G. W., III, Konovalov, S. K., Friederich, G. E., Nuzzio, D. B., Trouwborst, R. E.,… Romanov, A. S. (2006). Documenting the suboxic zone of the Black Sea via high-resolution real-time profiling. Deep Sea Research Part II: Topical Studies in Oceanography, 53, 1740–1755. https://doi.org/10.1016/j.dsr2.2006.03.011
Gregg, M. C., & Yakushev, E. (2005). Surface ventilation of the Black Sea’s cold intermediate layer in the middle of the western gyre. Geophysical Research Letters, 32, L03604. https://doi.org/10.1029/2004GL021580
Hiscock, W. T., & Millero, F. J. (2006). Alkalinity of the anoxic waters in the Western Black Sea. Deep Sea Research Part II: Topical Studies in Oceanography, 53, 1787–1801.
Johnson, K. S. (2006). Manganese Redox Chemistry Revisited. Science, 313(5795), 1896–1897. https://doi.org/10.1126/science.1133496 Johnson, K. S., & Coletti, L. J. (2002). In situ ultraviolet spectrophotometry for high resolution and long-term monitoring of nitrate, bromide
and bisulfide in the ocean. Deep Sea Research Part I: Oceanographic Research Papers, 49(7), 1291–1305. https://doi.org/10.1016/S0967-0637(02)00020-1
Johnson, K., Coletti, L., Jannasch, H., Sakamoto, C., Swift, D., & Riser, S. (2013). Long-term nitrate measurements in the ocean using the in situ ultraviolet spectrophotometer: Sensor integration into the Apex profiling float. Journal of Atmospheric and Oceanic Technology, 30(8), 1854–1866. https://doi.org/10.1175/JTECH-D-12-00221.1
Jørgensen, B. B., Fossing, H., Wirsen, C. O., & Jannasch, H. W. (1991). Sulfide Oxidation in the anoxic Black Sea chemocline. Deep Sea Research Part A. Oceanographic Research Papers, 38, S1083–S1103. https://doi.org/10.1016/S0198-0149(10)80025-1
Konovalov, S. K., Luther, G. W. III, Friederich, G. E., Nuzzio, D. B., Tebo, B. M., Murray, J. W.,… Romanov, A. S. (2003). Lateral injection of oxygen with the Bosporus plumefingers of oxidizing potential in the Black Sea. Limnology and Oceanography, 48(6), 2369–2376. https://doi.org/ 10.4319/lo.2003.48.6.2369
Konovalov, S. K., & Murray, J. W. (2001). Variations in the chemistry of the Black Sea on a time scale of decades (1960–1995). Journal of Marine Systems, 31(1-3), 217–243. https://doi.org/10.1016/S0924-7963(01)00054-9
Konovalov, S. K., Murray, J. W., & Luther, G. W., III (2005). Basic processes of the Black Sea biogeochemistry. Oceanography, 18(2), 28–35.
Konovalov, S. K., Murray, J. W., Luther, G. W., & Tebo, B. M. (2006). Processes controlling the redox budget for the oxic/anoxic water column of the Black Sea. Deep Sea Research Part II: Topical Studies in Oceanography, 53(17-19), 1817–1841.
Korotaev, G., Oğuz, T., & Riser, S. (2006). Intermediate and deep currents of the Black Sea obtained from autonomous profiling floats. Deep Sea Research Part II: Topical Studies in Oceanography, 53(17-19), 1901–1910. https://doi.org/10.1016/j.dsr2.2006.04.017
Lam, P., Jensen, M. M., Lavik, G., McGinnis, D. F., Müller, B., Schuber, C. J.,… Kuypers, M. M. M. (2007). Linking crenarchaeal and bacterial nitrification to anammox in the Black Sea. Proceedings of the National Academy of Sciences of the United States of America, 104(17), 7104–7109. https://doi.org/10.1073pnas.0611081104
Lewis, B. L., & Landing, W. N. (1991). The biogeochemistry of manganese and iron in the Black Sea. Deep Sea Research Part A. Oceanographic Research Papers, 38, S773–S803. https://doi.org/10.1016/S0198-0149(10)80009-3
Luther, G. W. III, Church, T. M., & Powell, D. (1991). Sulfur speciation and oxidation in Black Sea waters. Deep Sea Research Part A. Oceanographic Research Papers, 38, S1121–S1137. https://doi.org/10.1016/S0198-0149(10)80027-5
Millero, F. J. (1991). The oxidation of H2S with O2in the Black Sea. In E. Izdar & J. W. Murray (Eds.), Black Sea oceanography (pp. 205–227).
Netherlands: Kluwer Academic Publishers. https://doi.org/10.1007/978-94-011-2608-3_12
Murray, J. W. (1991). Hydrographic variability in the Black Sea. In E. Izdar & J. W. Murray (Eds.), Black Sea oceanography (pp. 1–16). Netherlands: Kluwer Academic Publishers.
Murray, J. W., Codispoti, L. A., & Friederich, G. E. (1995). Oxidation-reduction environments: The suboxic zone in the Black Sea. In C. P. Huang, C. R. O’Melia, & J. J. Morgan (Eds.), Aquatic chemistry: Interfacial and interspecies processes, ACS Advances in Chemistry Series (Vol. 224, pp. 157–176). Washington DC: American Chemical Society.
Murray, J. W., Jannasch, H. W., Honjo, S., Anderson, R. F., Reeburgh, W. S., Top, Z.,… Izdar, E. (1989). Unexpected changes in the oxic/anoxic interface in the Black Sea. Nature, 338(6214), 411–413. https://doi.org/10.1038/338411a0
Geophysical Research Letters
10.1002/2017GL076206
Acknowledgments
This study was performed in the frame of the PERSEUS project, funded by the EC, grant agreement 287600. Partial support was provided by the Italian Ministry of Education, University and Research through the Argo-Italy programme. E. V. S. acknowledges support from the EC project E-AIMS (grant 312 642) and H. C. the ERC project remOcean (grant agreement 246777). K. S. J. was supported by the David and Lucile Packard Foundation. Authors are grateful to V. Slabakova for the technical assistance in the observation part. A. Poteau and C. Schmechtig are acknowledged for their assistance in float mission operation and float data management. The data that support the findings of this study are available from ftp://ftp.ifremer.fr/ifremer/argo/dac/cor-iolis/6901866/.
Murray, J., & Yakushev, E. (2006). The suboxic transition zone in the Black Sea. In L. N. Neretin (Ed.), Past and Present Water Column Anoxia, NATO Science Series, (pp. 105–138). Netherlands: Springer. https://doi.org/10.1007/1-4020-4297-3_05
Naqvi, S. W. A., Kumar, M. D., Narvekar, P. V., De Souza, S. N., George, M. D., & D’Silva, C. (1993). An intermediate nepheloid layer associated with high microbial metabolic rates and denitrification in the Northwest Indian Ocean. Journal of Geophysical Research, 98(C9), 16,469–16,479. https://doi.org/10.1029/93JC00973
Ogura, N., & Hanya, T. (1966). Nature of ultra-violet absorption in sea water. Nature, 212(5063), 758. https://doi.org/10.1038/212758a0 Overmann, J., & Manske, A. K. (2006). Anoxygenic phorotrophic bacteria in the Black Sea chemocline. In L. N. Neretin (Ed.), Past and Present
Water Column Anoxia, (pp. 523–541). Dordrecht, Netherlands: Springer.
Pakhomova, S. V., Rozanov, A. G., & Yakushev, E. V. (2009). Dissolved and particulate forms of iron and manganese in the redox zone of the Black Sea. Oceanology, 49(6), 773–787. https://doi.org/10.1134/S0001437009060046
Perry, K. A., Kostka, J. E., Luther, G. W., III, & Nealson, K. H. (1993). Mediation of sulfur speciation by a Black Sea facultative anaerobes. Science, 259(5096), 801–803. https://doi.org/10.1126/science.259.5096.801
Sakamoto, C. M., Johnson, K. S., & Coletti, L. J. A. (2009). Improved algorithm for the computation of nitrate concentrations in seawater using an in situ ultraviolet spectrophotometer. Limnology and Oceanography: Methods, 7(1), 132–143. https://doi.org/10.4319/lom.2009.7.132 Schmechtig C., Poteau A., Claustre H., D’Ortenzio F., Dall’Olmo G. & Boss E. (2016). Processing Bio-Argo particle backscattering at the DAC
level. https://doi.org/10.13155/39459
Stanev, E. V., Grayek, S., Claustre, H., Schmechtig, C., & Poteau, A. (2017). Water intrusions and particle signatures in the Black Sea: A biogeochemical-Argofloat investigation. Ocean Dynamics, 67(9), 1119–1136. https://doi.org/10.1007/s10236-017-1077-9
Stanev, E. V., He, Y., Grayek, S., & Boetius, A. (2013). Oxygen dynamics in the Black Sea as seen by Argo profiling floats. Geophysical Research Letters, 40, 3085–3090. https://doi.org/10.1002/grl.50606
Stanev, E. V., He, Y., Staneva, J., & Yakushev, E. (2014). Mixing in the Black Sea detected from the temporal and spatial variability of oxygen and sulfide—Argo float observations and numerical modelling. Biogeosciences, 11(20), 5707–5732. https://doi.org/10.5194/bg-11-5707-2014
Tebo, B. (1991). Manganese (II) oxidation in the suboxic zone of the Black Sea. Deep Sea Research Part A. Oceanographic Research Papers, 38, S883–S905. https://doi.org/10.1016/S0198-0149(10)80015-9
Thierry, V., Gilbert, D., Kobayashi, T., Schmid, C., & Kanako, S. (2016). Processing Argo oxygen data at the DAC level, v2.2. https://doi.org/ 10.13155/39795
Trouwborst, R. E., Clement, B. G., Tebo, B. M., Glazer, B. T., & Luther, G. W., III (2006). Soluble Mn(III) in suboxic zones. Science, 313(5795), 1955–1957. https://doi.org/10.1126/science.1132876
Tugrul, S., Basturk, O., Saydam, C., & Yilmaz, A. (1992). Changes in the hydrochemistry of the Black Sea inferred from water density profiles. Nature, 359, 137–139.
Ulloa, O., Canfield, D. E., DeLong, E. F., Letelier, R. M., & Stewart, F. J. (2012). Microbial oceanography of anoxic oxygen minimum zones. Proceedings of the National Academy of Sciences of the United States of America, 109(40), 15,996–16,003. https://doi.org/10.1073/ pnas.1205009109
Whitmire, A. L., Letelier, R. M., Villagrán, V., & Ulloa, O. (2009). Autonomous observations of in vivofluorescence and particle backscattering in an oceanic oxygen minimum zone. Optics Express, 17(24), 21,992–22,004. https://doi.org/10.1364/OE.17.021992
Yakushev, E., Pakhomova, S., Sørenson, K., & Skei, J. (2009). Importance of the different manganese species in the formation of water column redox zones: Observations and modeling. Marine Chemistry, 117, 59–70.
Yakushev, E. V., Pollehne, F., Jost, G., Kuznetsov, I., Schneider, B., & Umlauf, L. (2007). Analysis of the water column oxic/anoxic interface in the Black and Baltic Seas with a numerical model. Marine Chemistry, 107(3), 388–410. https://doi.org/10.1016/j.marchem.2007.06.003 Ye, V. M., & Nalbandov, Y. R. (1990). Effect of changes in water density on the profiles of physicochemical and biological characteristics in the
pelagic ecosystem of the Black Sea. Oceanology, 30, 567–573.
Yemenicioglu, S., Erdogan, S., & Tugrul, S. (2006). Distribution of dissolved forms of iron and manganese in the Black Sea. Deep Sea Research Part II: Topical Studies in Oceanography, 53(17-19), 1842–1855. https://doi.org/10.1016/j.dsr2.2006.03.014
Yilmaz, A., Coban-Yildiz, Y., Telli-Karakoc, F., & Bologa, A. (2006). Surface and mid-water sources of organic carbon by photoautotrophic and chemoautotrophic production in the Black Sea. Deep Sea Research Part II: Topical Studies in Oceanography, 53(17-19), 1988–2004. https://doi.org/10.1016/j.dsr2.2006.03.015