HAL Id: hal-01165645
https://hal.archives-ouvertes.fr/hal-01165645
Submitted on 10 Nov 2017
HAL is a multi-disciplinary open access
archive for the deposit and dissemination of
sci-entific research documents, whether they are
pub-lished or not. The documents may come from
teaching and research institutions in France or
L’archive ouverte pluridisciplinaire HAL, est
destinée au dépôt et à la diffusion de documents
scientifiques de niveau recherche, publiés ou non,
émanant des établissements d’enseignement et de
recherche français ou étrangers, des laboratoires
A self-affine geometrical model of dynamic RT-PMMA
fractures: implications for fracture energy measurements
Jean-Benoit Kopp, Jean Schmittbuhl, Olivier Noel, Christophe Fond
To cite this version:
Jean-Benoit Kopp, Jean Schmittbuhl, Olivier Noel, Christophe Fond. A self-affine geometrical model
of dynamic RT-PMMA fractures: implications for fracture energy measurements.
International
Journal of Fracture, Springer Verlag, 2015, 193 (2), pp.141-152. �10.1007/s10704-015-0025-2�.
�hal-01165645�
Science Arts & Métiers (SAM)
is an open access repository that collects the work of Arts et Métiers ParisTech
researchers and makes it freely available over the web where possible.
This is an author-deposited version published in: http://sam.ensam.eu
Handle ID: .http://hdl.handle.net/10985/9600
To cite this version :
Jean-Benoit KOPP, Jean SCHMITTBUHL, Olivier NOEL, Christophe FOND - A self-affine geometrical model of dynamic RT-PMMA fractures: implications for fracture energy measurements - International Journal of Fracture - Vol. 193, n°2, p.141-152 - 2015
Any correspondence concerning this service should be sent to the repository Administrator : [email protected]
O R IG INA L PA P E R
A self-affine geometrical model of dynamic RT-PMMA
fractures: implications for fracture energy measurements
Jean-Benoit Kopp · Jean Schmittbuhl ·Olivier Noel · Christophe Fond
Abstract Profilometric imaging of fracture surfaces
of rubber toughened polymer has been performed at two different resolutions (a) at large scales [10 µm– 25 mm] using an opto-mechanical profilometer and (b) at small scales [0.195 µm–0.48 mm] using an inter- ferometric optical microscope. We introduced a self- affine geometrical model using two parameters: the Hurst exponent and the topothesy. We showed that for rubber toughened materials the approximation of the created surface by a mean flat plane leads to a poor estimation of the dynamic fracture energy G I dc. The
description of the created rough fracture surface by a self-affine model is shown to provide a significantly better approximation. A new and original geometrical method is introduced to estimate self-affine parame- ters: the 3D surface scaling method. Hurst exponents are shown to be unique, χ = 0.6 ± 0.1 for the
differ-J.-B. Kopp (
B
)I2M, Université de Bordeaux, CNRS, Esplanade des Arts et Métiers, 33405 Talence, France
e-mail: [email protected] J. Schmittbuhl
EOST, Université de Strasbourg, CNRS, 5 rue René Descartes, 67000 Strasbourg, France
O. Noel
IMMM, Université du Maine, CNRS, Avenue Olivier Messiaen, 72085 Le Mans, France
C.Fond
ICube, Université du Strasbourg, CNRS, 2 rue Boussingault, 67000 Strasbourg, France
ent fracture zones and measurement scales. Topothesy ratios indicate a significant difference of fracture sur- face roughness amplitude depending on the observa- tion resolution when the detrending technique is not correctly introduced.
Keywords Dynamic fracture · Polymers · Surface
roughness · Self-affinity · Hurst exponent · Topothesy · Fracture energy · Rapid crack propagation
1 Introduction
In a previous paper (Kopp et al. 2014b), a cor- relation between dynamic fracture energy measure- ments and the amount of created fracture surface was reported for rubber toughened polymethylmethacrylate (RT-PMMA). Contrary to pure amorphous polymers (Williams 1972; Kobayashi et al. 1980; Doll 1976), rub- ber toughened polymers show a decrease in the fracture energy with the crack tip velocity for rapid crack propa- gation (RCP) in mode I solicitation (Fond and Schirrer 2001). Moreover, for RT-PMMA and semi-crystalline materials, the macroscopic velocity of the crack tip has been observed as not changing even after branching (Fond and Schirrer 2001; Scheibert et al. 2010; Sharon and Fineberg 1999; Kopp et al. 2013, 2014a). These behaviours are clearly explained if we consider that to maintain the same velocity after branching with less available fracture energy, the branch has to create less fracture surface (Kopp et al. 2014a; Fond and Schirrer
x
2001). Indeed, for a typical velocity known to be the branching velocity (Yoffe 1951), 0.6cr , where cr is the
Rayleigh wave speed, the maximum value of G I dc is
about three times higher than its minimum value. These fluctuations of G I dc are associated to the surface rough-
ness and, more precisely, to the amount of created sur- face Ar which varies significantly during fracture prop-
agation (Kopp et al. 2014a; Fond and Schirrer 2001;
Osovski et al. 2015; Srivastava et al. 2014). Since the estimation of the amount of created fracture surface is typically a scale dependent measurement (Bouchaud 1997; Candela et al. 2012), a multi-scale approach has to be considered (Deumié et al. 1996) and several mod- els exist to characterize this complex geometry (Man- delbrot et al. 1984; Lopez and Schmittbuhl 1998; Pon- son et al. 1992; Bouchaud et al. 1995).
The aim of this study is to explore one of these statistical and geometrical models allowing to esti- mate the roughness of the fracture topographies: a self-affine geometrical model (Mandelbrot 1982). This model introduced by Mandelbrot applies to systems that are statistically invariant under an affine transfor-mation, such as: x → λx x ; y → λy y; z → λz z where
λx = λy ; λz = λχ and χ is the roughness exponent,
et al. 1984; Bouchaud et al. 1993, 1995) and polymers (Guerrero et al. 2002; Lapique et al. 2002). However, over the past ten years some authors have questioned this universal value, in particular for polymers (Hino- josa et al. 2004). The difference in Hurst exponents with polymers may be due to a specific mechanism that is the fibrillation in crazes which does not exist in materials such as steel or rock. In addition, the used self-affine geometrical model in this study describes the scaling sensitivity of the fracture roughness.
In this study, the fracture surface roughness analysis is based on profilometric measurements that have been carried out with several techniques [opto-mechanical profilometer (OMP) and interferometric optical micro- scope (IOM)] using different probe sizes (0.195–10 µm). This multi-scale approach has been performed post-mortem on fracture surfaces along the crack prop- agation direction. Self-affine model has been tested to model fracture surface roughness.
2 Roughness measurements
2.1 Samples and profilometer or the Hurst exponent (0 < χ < 1). The parameters
associated with the self-affine model [see Eq. (2)] are the Hurst exponent χ (i.e. the scaling exponent) and the scaling prefactor C or the topothesy lr (Maloy et al. 1992; Simonsen et al. 2000). Intuitively these two para- meters define two different aspects of the surface. The Hurst exponent quantifies the typical size of the asper- ities. A surface with a large Hurst exponent will show large scale asperities. On the contrary a surface with a small Hurst exponent will have small scale asperities with numerous steep slopes. From this aspect, a surface with a small Hurst exponent will appear rougher. The prefactor (or the topothesy) describes a different prop- erty, the relative height amplitude of the roughness. A high prefactor corresponds to a surface with high summits and deep valleys independently of the lateral extension of asperities. Such a surface could also be labelled as rough.
The concept of self-affinity was already applied to many natural surfaces including fracture surfaces. The Hurst exponent value is estimated to be unique and uni- versal in between 0.78 and 0.80 for many materials such as rocks (Schmittbuhl et al. 1993, 1995b; Lopez and Schmittbuhl 1998), wood (Morel et al. 1998; Mourot et al. 2002; Ponson et al. 1992), steel (Mandelbrot
2.1.1 RT-PMMA fracture samples
The industrial grade RT-PMMA used in this study is a blend made of a PMMA matrix containing about twenty percent volume fraction of mono-dispersed spherical elastomer particles of about 100 nm diameter. The matrix glass transition temperature (Tg ) is 105 ◦C while
that of the elastomer particles is about −30 ◦C. Rapid crack propagation (RCP) is initiated in such a polymer sample, following the geometry known as a strip band specimen (SBS) geometry. The SBS geome- try allows a relatively simple mechanical analysis of the structure during a quasi-static regime of propagation. SBS was also chosen for its low dynamic correction for the estimation of the fracture energy (Nilsson 1972). The fracture test is performed using a displacement- controlled Instron tensile testing machine to cancel out the work done by external forces during RCP. The experimental procedure consists in pre-stressing the sample as uniformly as possible. Then, the deforma- tion is maintained during a significant time compared to the loading time allowing the relaxation of the sam- ple. The crack is then initiated with a low energy exter- nal impact, typically the impact of a razor blade on the
Fig. 1 Post-mortem fractured RT-PMMA sample: 1 initiation zone where cavitation of rubber particles is visible (whitening of the material around the notch at the initiation of the fracture); 2 fracture propagation direction; 3 micro-branching: development
of a limited branch (d < 1 cm); 4 macro-branching: development
of a significant branch (d ≥ 1 cm); 5 fracture kink; 6 crack arrest. For this sample, no conducting layer was applied
front notch. The entire test is performed at a constant temperature of 23 ◦C. The macroscopic crack velocity is measured using a conductive layer which is sprayed on the sample surface. We checked that the spray does not affect the fracture mechanism. The evolution of the electric resistance of this layer is recorded as a func- tion of time during fracture propagation (Kopp et al. 2014b). A fractured RT-PMMA sample is presented in Fig. 1. Different branching situations are encountered: a macro-branching or a micro-branching. The size of the secondary crack after branching has been used to calculate the difference between these two types of branching. Macro-branching herein denotes secondary crack extension d typically larger than 1 cm and micro-branching for d ≤ 1 cm. The micro-branching (micro- and macro-) of the principle crack appears because of iner- tial effects at an approximate crack velocity of 0.6cr
(Yoffe 1951).
2.1.2 Opto-mechanical profilometer (OMP)
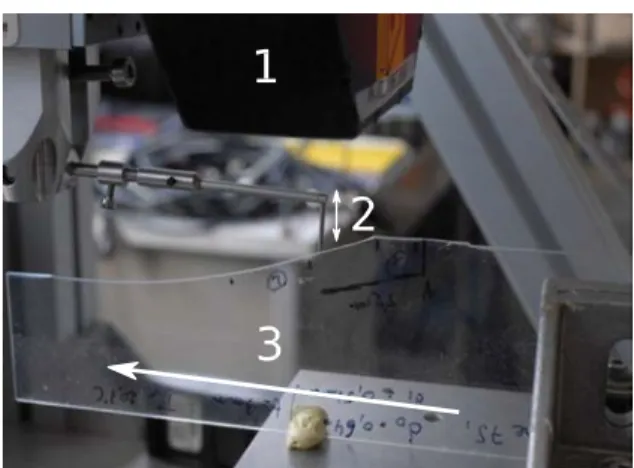
A prototype of an opto-mechanical stylus profilometer (OMP) developed at EOST was used to characterize the fracture surface at the largest scales. The principle of the OMP consists in probing a fracture surface with a stylus located at the end of a mechanical arm allowing the sensing of the topographic variations (Fig. 2). The stylus is moved horizontally at a constant speed of about 1 mm s−1 and subjected to a gravity force ensuring
Fig. 2 Laboratory opto-mechanical stylus profilometer: 1 laser distance meter, 2 stylus (measurement of z coordinates), 3 sample (translation along x axis)
that the sapphire tip of diameter φ = 10 µm, keeps in contact with the surface. The vertical displacement of the stylus is monitored by a laser sensor based on a triangulation technique with a vertical resolution of 1 µm. Measurements are discretized along a grid (Nx ,
Ny ) with a mesh (�x , �y ). The mesh grid is chosen
as: �x = �y = 10 ± 2 µm. This technique can be
used for probing surfaces of high transparency with an optical precision for height measurement and with a high accuracy of the mechanical description of the air/RT-PMMA interface (the stylus does not indent the sample during probing).
2.1.3 Interferometric optical microscopy (IOM) The principle of the technique (Bruker Contour GT- K1 optical microscope) is based on white light confo- cal interferometry. It allows the non-contact imaging of surfaces with a vertical sub-nanometer resolution, from nanometer-scale roughness through millimeter- scale steps. The lateral resolution depends on the beam size used for the measurement. In our experiment, the beam size is 195 nm.
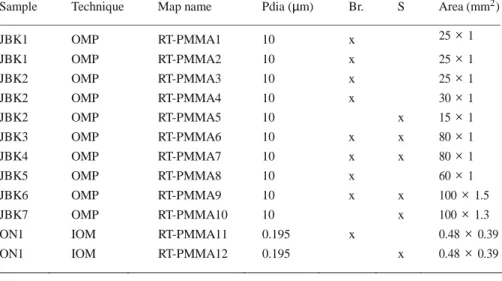
2.2 Roughness evolution during fracture propagation Roughness data as (x, y, h) files obtained with either OMP or IOM techniques are used to rebuild the topog- raphy of fracture surfaces and to try to estimate self- affine parameters as a function of the probe resolution. Sample characteristics are summarized in Table 1.
JBK1 OMP RT-PMMA1 10 x 25 × 1 JBK1 OMP RT-PMMA2 10 x 25 × 1 JBK2 OMP RT-PMMA3 10 x 25 × 1 JBK2 OMP RT-PMMA4 10 x 30 × 1 JBK2 OMP RT-PMMA5 10 x 15 × 1 JBK3 OMP RT-PMMA6 10 x x 80 × 1 JBK4 OMP RT-PMMA7 10 x x 80 × 1 JBK5 OMP RT-PMMA8 10 x 60 × 1 JBK6 OMP RT-PMMA9 10 x x 100 × 1.5 JBK7 OMP RT-PMMA10 10 x 100 × 1.3
ON1 IOM RT-PMMA11 0.195 x 0.48 × 0.39
ON1 IOM RT-PMMA12 0.195 x 0.48 × 0.39
= N
Table 1 Experimental Sample Technique Map name Pdia (µm) Br. S Area (mm2)
conditions used for the
analysis of surface roughness probed by OMP
and IOM; Br. and S refer
respectively to the mapping from pre-Branching and Stopping phase zone. The diameter of the probe is denoted Pdi a
Fig. 3 Topography of a fracture surface of RT-PMMA probed by OMP (sample JBK1) during a crack branching configuration
and standard deviation σy (x ) of the height along the y axis as a
function of the x axis which defines stationary regime (A) before a branching zone
Fracture mapping allows the observation of sur- face roughening during crack propagation. Indeed, it is observed at macroscopic scale that the roughest and
σy (Eq. 1) of the height along the y axis, perpendicular
to the crack propagation direction, is calculated as a function of the crack propagation direction (x axis). smoothest surfaces are respectively just before a macro- σ 2 1 �(h(x , y) h)2
branching (roughness I in Fig. 3) and just before a crack arrest (roughness IV in Fig. 4). A crack arrest1
hap-y (x ) = − ¯
y y
1 pens when the fracture energy becomes too low for the with h¯
�
N
h(x , y) (1)
crack to continue. Of course, with the sample not being y y entirely fractured, the crack arrest zone surface is only
accessible after cutting into the sample. The self-affine model has been tested to characterize the fracture sur- face roughness between these two configurations.
To illustrate the fluctuation of the surface rough- ness during crack propagation, the standard deviation
1 The beginning of a creep crack growth regime is considered
herein as a crack arrest.
The amplitude variation of σy is used to
differenti-ate between stationary and non-stationary regimes. A stationary regime corresponds to quasi-constant fluc- tuations of σy along the crack propagation direction.
Figures 3 and 4 show two stationary regimes before a branching zone (A) and just before a crack arrest zone (B).
The two stationary regimes, (A) and (B), correspond respectively to surface roughness I and III. Roughness
x x
r
Fig. 4 Topography of a fracture surface of RT-PMMA probed by OMP (sample JBK3) just before a crack arrest configuration
and standard deviation σy (x ) of the height along the y axis as a
function of the x axis which defines stationary regime (B) before a crack arrest zone
II and roughness IV are associated to transient regimes as defined by the transient evolution of σy , either a
significant increase or decrease of σy , along the crack
propagation direction. Only stationary regimes are described in this article. Non-stationary regimes have to be analysed with other methods (Family and Vicsek 1985; Lopez and Schmittbuhl 1998) not presented here.
2.2.1 Branching zone
Figure 3 shows a perspective view of the fracture topog- raphy before and after branching for a RT-PMMA dynamic fracture probed with an OMP. It also shows that the crack surface before branching (roughness I) looks rougher (i.e. with steeper slopes in the topography and large scale asperities) than the one after branching (roughness II) despite an increase of the standard devi- ation related an increase of the global tilt of the surface. It should be noted that the use of the standard deviation might be biased if a global trend of the surface is not removed. This is part of the explanation for the increase of the standard deviation before and after branching in Fig. 3.
3 Results
3.1 Self-affine (1 + 1)D methods
The analysis of stationary self-affinity can be realized according to different statistical methods (RMS, MM, FPS, AWC).
3.1.1 Root mean square (RMS) and maximum–
minimum (MM) Schmittbuhl et al. (1995b)
If one considers a 2-D profile of length L along the frac- ture topography, let it divide in the propagation direc- tion into bands or windows of width δx and then indexes
it by the position of first point x0 of the band. The stan-
dard deviation σ (δx ) of the height on the window δx
and the height difference h(δx ) between the maximum
and minimum heights within the window δx are calcu-
lated for each band and then averaged over all of the bands with a fixed width δx over the entire profile, by
varying the origin x0. We obtain therefore <σ (δx )>x0
and <h(δx )>x0 and where these two quantities follow
a power law for self-affine profiles: <σ (δx )> ∝ δχ
and <h(δx )> ∝ δχ .
2.2.2 Crack arrest zone
The RT-PMMA dynamic fracture surface roughness amplitude (roughness III and IV) decreases just before a crack arrest zone (Fig. 4), when the energy release rate becomes too low for the crack to continue, is also of interest. A crack arrest mark can also be observed
post-mortem (see Fig. 4).
The topothesy (Simonsen et al. 2000; Schmittbuhl et al. 2007, 2008; Candela et al. 2009) can be calculated with the help of both methods as:
σ (δx ) = h(δx ) = Cδx χ with C = l(1−χ) (2)
The topothesy, is defined by: σ (lr ) = lr or h(lr ) = lr
ver-−∞ √
∞ a
3.2 Hurst and topothesy measurements
To quantify the differences of magnitudes of fracture surface roughness between stationary regimes (A) and (B), pre-factors (topothesy) and Hurst exponents are compared. Self-affine methods described in Sect. 3.1
have been applied to surface data using (RMS, MM, FPS, AWC) techniques (see Figs. 6, 7, 8 9). How- ever, some precautions must be taken to character- ize self-affine surfaces. A first requirement is to use several methods to measure the Hurst exponent (see Fig. 5 Illustration of the definition of the topothesy with the MM
method
tical mean standard deviation or the height difference is equal to δx (see Fig. 5).
3.1.2 Fourier power spectrum (FPS)
Barabasi and Stanley (1995), Meakin (1998)
The Hurst exponent χ of the surface can be estimated from the Fourier power spectrum of a 2-D height profile if it follows a power law. For each parallel profile, the power spectrum P(k), i.e., the square of the modulus of the Fourier transform, is calculated based on the wave- number k. When the power spectrum follows a power law: P(k) ∝ k−1−2χ , and the phases are random, the Hurst exponent is χ . The Fourier power spectrum of the roughness is plotted as a linear trend in log–log coordinates as a function of the wave-number.
3.1.3 Averaged wavelet coefficient (AWC)
Simonsen et al. (1998), Candela et al. (2009)
The AWC method is based on a wavelet transform of the input signal which depends on the position and dilata- tion. The wavelet transform of each profile 2-D.L(x ) is
Fig. 6 Statistical data analysis RMS obtained by the character- ization of fracture surfaces of RT-PMMA (A and B) probed by OMP (sample JBK6) and IOM (sample ON1); linear fitting for log(δ) ∈ [−5;-3.6] for regime (A)-OMP, log(δ) ∈ [−5;-4.3] for
regime (B)-OMP, log(δ) ∈ [−6.7;-4] for regime (A)-IOM and
log(δ) ∈ [−6.7;-5.7] for regime (B)-IOM with averaged slope <β> = 0.55
defined by W (a, b) = 1 ψ( x −b )L(x )dx where ψ is the wave function (here Daubechies wavelets of order 4). For a self-affine surface, the measure-ment follows a power law as, Wa ∝ aχ +0.5 where
Wa = <|W (a, b)|>b.
All these different techniques show a power law behaviour which depends on the Hurst exponent and the topothesy. To assess these parameters, each graph is in a log–log plot using a least square method.
Fig. 7 Statistical data analysis MM obtained by the characteriza- tion of fracture surfaces of RT-PMMA (A and B) probed by OMP
(sample JBK6); linear fitting for log(δ) ∈ [−2;1] for regimes (A)
Fig. 8 Statistical data analysis FPS obtained by the characteriza- tion of fracture surfaces of RT-PMMA (A and B) probed by OMP (sample JBK6); The Fourier power spectrum of the roughness is plotted as a linear trend in log–log coordinates as a function of the
wave-number; linear fitting for log(k) ∈ [−1;1.2] for regime (A)
and log(k) ∈ [−1;1.7] for regime (B) with slopes βA = −2.34
and βB = −2.32
Fig. 9 Statistical data analysis AWC obtained by the character- ization of fracture surfaces of RT-PMMA (A and B) probed by
OMP (sample JBK6); linear fitting for the whole range of log(a)
for regimes (A) and (B) with slopes βA = 1.13 and βB = 1.13
Schmittbuhl et al. 1995a, b). This allows to consider intrinsic errors related to the different methods used. For example, the RMS method tends to minimize the Hurst exponent value. For a Hurst exponent value of 0.6 the intrinsic error of the method is approximately 10 % Schmittbuhl et al. (1995a, b).
In our case, the Hurst exponent will be estimated and averaged over four methods. After this step, to limit the number of figures of the manuscript and for clarity, we chose to use only one method (RMS) to compare self-affine parameters (χ and lr ) as a function of the
measurement scale (OMP and IOM).
Table 2 summarizes Hurst exponent measurements for RT-PMMA fracture surfaces probed by OMP pro- filometry for stationary regimes (A) and (B). What- ever the method (RMS, MM, FPS, AWC) and the sta- tionary regime (A) or (B), the fracture surface rough- ness is observed to follow self-affinity (see Figs. 6, 7,
8, 9). A good estimation of the Hurst exponent value, χ = 0.6 ± 0.1, is done with the help of RMS, MM, FPS and AWC methods. The error is given by the stan- dard deviation of 8 values for regime (A) and 5 values for regime (B) of Hurst exponent which are calculated for the RT-PMMA fracture maps presented in Table 1. The mean value of the Hurst exponent minimizes the intrinsic error of the method.
Moreover, it can be observed in Fig. 6, that self- affine properties seem maintained at IOM scales for A-IOM curve. For regime B, there is clearly a sig- nificant difference in standard deviation magnitude at large scales between the IOM and the OMP techniques. We interpret this discrepancy in stating that the IOM technique is not relevant at these scales (i.e. above a “cut-off” scale) because of the detrending procedure. This might be a problem for each measurements at large scales as typically observed: there is always a flattening of the curves at large scales. Indeed, an a priori detrending can be introduced when positioning the sample with respect to the measurement device. To optimize the measurement with respect to the accessi- ble range of the apparatus, the orientation of the sample might be different for small and large scale measure- ments. We consider that the a priori chosen orienta- tion of the B-IOM sample has lead to a minimization of the large scale components of the fracture rough- ness. Note that a complementary approach would be to search for a multi-fractal or multi-affine behaviour but would require a significantly higher amount of data to get relevant results. This was not accessible in the framework of this study.
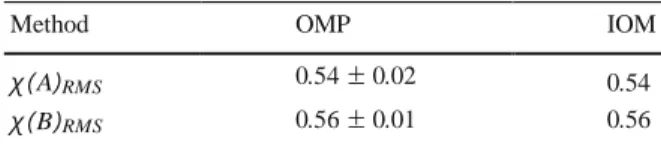
In Table 2 the roughness exponents obtained using the RMS method applied on RT-PMMA fracture sur- faces data issue from both OMP and IOM profilometers are compared. The Hurst exponents calculated at IOM scale for one sample seem comparable to those
calcu-0.60 ± 0.02 0.67 ± 0.02 0.63 ± 0.02 0.6 ± 0.1
0.62 ± 0.01 0.65 ± 0.02 0.63 ± 0.01 0.6 ± 0.1
Table 2 Hurst exponents of OMP RMS MM FPS AWC Average
RT-PMMA fracture surfaces
probed by OMP for
stationary regimes A and B χ( A) χ(B) 0.54 ± 0.02
0.56 ± 0.01
Table 3 Roughness exponents issue from RMS method of RT- PMMA fracture surfaces probed by OMP and IOM for stationary regimes A and B
Method OMP IOM
χ( A)RMS 0.54 ± 0.02 0.54
χ(B)RMS 0.56 ± 0.01 0.56
Table 4 Pre-factors and topothesies calculated with RMS Fig. 10 Triangulation of the surface. For a typical four nodes element the real area is quantified with the help of four
triangu-method before a branching zone (A) and a crack arrest (B) for lar areas (S1, S2, S3 and S4). Heights p1 4 are experimentally
fracture surfaces probed by OMP and IOM
Pre-factors C( A) C(B) C( A)/C(B) OMP IOM 1.7 × 10⁻³ 1.7 × 10⁻³ 7.9 × 10⁻⁴ 5.0 × 10⁻⁴ 2.2 ± 0.2 3.4 Topothesies lr ( A) lr (B) lr ( A)/ lr (B) OMP IOM 7.4 × 10⁻⁷ 7.4 × 10⁻⁷ 9.0 × 10⁻⁸ 4.6 × 10⁻⁸ 8.2 ± 0.2 15.8
lated at OMP scale. With taking account of the intrinsic error of the method, χ ≈ 0.6 ± 0.1 (Table 3).
Pre-factors C( A) and C(B) and topothesies lr ( A)
and lr (B) are respectively associated to stationary
regimes (A) and (B). Table 4 presents pre-factors and topothesies calculated with the RMS method as a func- tion of the analysis scales (OMP and IOM) and the regime (A or B). We chose to keep both parame- ters even if they are mathematically related since they describe in two different ways the same information. The topothesy is a “horizontal” measure along the mean fracture plane of the amplitude of the roughness and the pre-factor is a “vertical” measure, i.e. out of plane. Significant differences of surface roughness are highlighted with the help of pre-factors or topothesies. Ratios C( A)/C(B) are 2.2 ± 0.2 at OMP scale and 3.4 at IOM scale. Ratios lr ( A)/ lr (B) are respectively
8.2 ± 0.2 at OMP scale and 15.8 at IOM scale.
From our estimation, the main observation is that the Hurst exponent is stable whatever the analysis scale contrary to the topothesy value which varies signifi- cantly.
−
obtained either with OMP or with IOM. It is assumed that the
height where the triangles S1−4 meet is known
3.3 Fracture area
measurement
and the (2 + 1)D surface scaling method
A specific approach has been introduced to character- ize the fracture surface roughness. It aims at estimating the surface scaling not only from extracted 1D profiles but by measuring the scaling of the fracture surface itself. It reinforces the (1 + 1)D estimation of the Hurst exponent value in using directly the estimation of the surface area of the fracture surfaces. Indeed, it is based on the estimate of the amount of created fracture sur- face Ar and its comparison to the projected area A0
on the mean fracture plane. With the help of h(x , y) data, a routine makes a triangulation of the surface. In other words, the surface area of the fracture surface is estimated with the sum of each triangular area using three different altitudes (see Fig. 10).
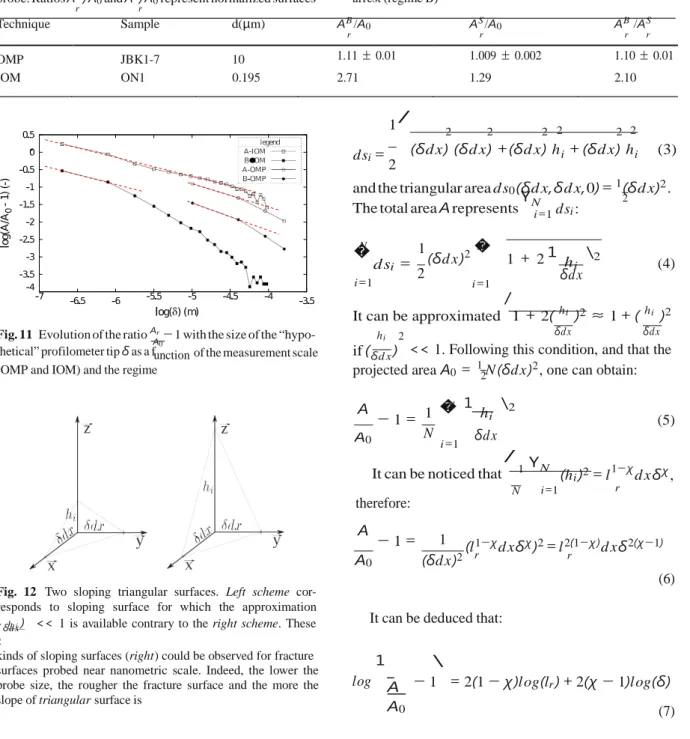
As presented in Table 5, the surface area of the frac- ture surface depends on the scale measurement. It is observed at OMP scale that the surface area of the frac- ture surface just before a macro-branching (regime A) is approximately 10 % larger than just before a crack arrest (regime B). At IOM scale this ratio increases up to 210 %.
Moreover, the routine allows a numerical smooth- ing of the fracture surface. One method for this recon- struction is used: the convolution method. It consists in computing the convolution of the topography with
2 i =1 unction 2 δdx ) − N A0 1
Table 5 Estimation of the surface area of the fracture surfaces as by the projected surface A0. The ratio AB / AS is the relative
r r
a function of the resolution technique with d the diameter of the
probe. Ratios AB /A
0 and AS /A0 represent normalized surfaces
comparison of surface before branching (regime A) and before arrest (regime B) r r Technique Sample d(µm) AB /A0 AS /A0 AB /AS r r r r OMP JBK1-7 10 1.11 ± 0.01 1.009 ± 0.002 1.10 ± 0.01 IOM ON1 0.195 2.71 1.29 2.10 1 / 2 2 2 2 2 2 dsi = 2 (δdx ) (δdx ) +(δdx ) hi + (δdx ) hi (3)
and the triangular area ds0(δdx , δdx , 0) = 1 (δdx )2.
The total area A represents YN dsi : N � d si = i =1 1 (δdx )2 � 2 i =1 1 + 21 hi \2 δdx (4) It can be approximated / 1 + 2( hi )2 ≈ 1 + ( hi )2
Fig. 11 Evolution of the ratio Ar − 1 with the size of the “hypo- h
i 2 δdx δdx
thetical” profilometer tip δ as a fA0 of the measurement scale if ( δdx ) << 1. Following this condition, and that the
(OMP and IOM) and the regime projected area A0 = 1 N (δdx )2, one can obtain:
1 N 1 hi \2 A − 1 = � (5) N i =1 δdx
It can be noticed that / 1 YN (h i )2 = l1−χ d x δχ , therefore: N i =1 r A − 1 = (l1−χ d x δχ )2 = l2(1−χ)d x δ2(χ −1) A0
Fig. 12 Two sloping triangular surfaces. Left scheme cor- responds to sloping surface for which the approximation
(δdx )2 r r
(6)
( h i 2
<< 1 is available contrary to the right scheme. These It can be deduced that:
kinds of sloping surfaces (right) could be observed for fracture surfaces probed near nanometric scale. Indeed, the lower the probe size, the rougher the fracture surface and the more the slope of triangular surface is
log 1 A A0 \ − 1 = 2(1 − χ )log(lr ) + 2(χ − 1)log(δ) (7) a sphere (radius δ) that mimics a large probe. The sur-
face area of the fracture surface is then recalculated as a function of δ value. The evolution of Ar 1, where
A0
A0 represents the projected surface, with δ is presented
in Fig. 11 for fracture surfaces probed with OMP and IOM before (regime A) and after (regime B) branching.
If it is considered that the triangular area dsi (δdx ,
δdx , hi ) (see Fig. 12) is equal to:
Following this development, Hurst exponent and topothesy values can be deduced from Fig. 11 with a linear regression y = m x + p. The slope m is directly linked to the Hurst exponent χ with m = 2χ − 2. It is observed, with this method, that the Hurst exponent value is equal to χ = 0.6 ± 0.1 (see Table 6) whatever the regime (A and B) and the measurement scale (OMP and IOM) even if a cut-off length seems to appear at
δdx
Table 6 Hurst exponent values of RT-PMMA fracture surfaces probed by OMP and IOM for stationary regimes A and B which were obtained using the 3D surface scaling method described in
Sect. 3.3
OMP IOM Average
χ( A) 0.6 0.7 0.6 ± 0.1 χ(B) 0.5 0.6 0.6 ± 0.1
large scales for the regime B. This behaviour seems similar to the one highlighted with the RMS method. Topothesies ratios lr ( A)/ lr (B) are respectively equal
to 3.9 at OMP scale and 9.2 at IOM scale. Firstly, these results show that the self-affine model provides a good description of the evolution of the fracture area as a function of the measurement resolution. Secondly, it confirms a similarity of the Hurst exponent value for the different regimes (A or B) and the analysis scales, contrary to the topothesy value which is significantly sensitive to the fracture surface roughness. Thirdly, the self-affine model shows that at large scales, the sur- face estimate converges toward a flat mean plane (Feder 1988). Finally, it is observed in Figs. 6 and 11 that the self-affine model with χ = 0.6 seems no longer conve-nient at large scales for the regime B − I O M. A cut-off length appears at approximately 100 µm.
4 Discussion and conclusions
The scale dependence analysis of RT-PMMA fracture surfaces has led to show the relevance of the self- affine geometrical model which provides a quantifica- tion of the surface area of the fracture surface. Two regimes have been defined: a stationary regime just before a macro-branching (A) and a stationary regime just before a crack arrest (B).
The self-affine geometrical model has been applied to regimes which correspond to different fracture zones. All RT-PMMA fracture surfaces belonging to stationary regimes (A) and (B) follow self-affinity (i.e. same Hurst exponent) like many materials (Schmit- tbuhl et al. 1993; Morel et al. 1998) in a range of approx- imately 4 decades (see Fig. 6). This observation is con- firmed and reinforced with the help of four statistical analysis methods (RMS, MM, FPS and AWC). The topothesy allows the appreciation of significant differ- ences of roughness amplitudes between two stationary
regimes (A and B) at different scales (OMP and IOM). It is observed that the Hurst exponent stays approxi-mately constant χ = 0.6 ± 0.1, whatever the regime, either (A) or (B), or the analysis scale, either OMP or IOM. Contrary to the Hurst exponent, topothesies (or pre-factors) values vary significantly. Indeed ratios of C( A)/C(B) are estimated to be equal to 2.2 ± 0.2 and 3.4 respectively at OMP scale and IOM scale. Topothe- sies ratios are lr ( A)/ lr (B) = 8.2±0.2 and 15.8
respec-tively at OMP and IOM scales.
Figures 6 and 11 let one observe that for regime B the model seems to overlap after approximately one decade. This observation leads to the introduction of a cut-off length at large scales for the regime B which seems to highlight a transient regime—a decrease of the roughness (Family and Vicsek 1985; Lopez and Schmittbuhl 1998). This could confirm that fracture surfaces associated to the regime B are near the crack arrest zone and therefore converge toward a flat mean plane.
A new tool, the 3D surface scaling method, has been developed using Fortran to estimate, first of all, the surface area of the fracture surface Ar based on a tri-
angulation of the surface. It is noticed for RT-PMMA fractures that Ar depends on the scale measurement
(OMP and IOM) and the regime (A and B). Secondly, self-affine parameters (Hurst exponent and Topothesy) were estimated. Assuming that ( hi )2 << 1, the
surface area of the fracture surface can be modelled following the Eq. 6. In this case, the Hurst expo- nent value is confirmed as staying approximately con- stant whatever the measurement scale and the regime: χ = 0.6 ± 0.1. Topothesy values fluctuate as a func-tion of the measurement scale (OMP and IOM) and the regime (A and B). Topothesies (or pre-factors) have highlighted a significant difference of RT-PMMA fracture surface roughness amplitudes, contrary to the Hurst exponent value, as a function of the crack propa- gation configuration (crack branching and crack arrest). Indeed, the lower the topothesy, the smoother the fracture surface. In comparing topothesies (or pre- factors) values, the fracture surface before a crack arrest zone is smoother than before a crack branching configuration.
This model will allow for the comparison of the fluctuation of self-affine parameters (Hurst exponent and Topothesy) with the fluctuation of the surface area of the fracture surface roughness. These results will be used in a practical issue presented in Kopp et al.
(2014b). Indeed, according to a dynamic linear elas- tic fracture mechanics (LEFM) approach, RT-PMMA samples reveal a loss of unicity of the dynamic frac- ture energy G I dc at the crack branching velocity. The
dynamic fracture energy has until now been estimated as a function of the amount of projected fracture sur- face, typically the mean flat surface. For RT polymers and semicrystallines (Fond and Schirrer 2001; Kopp et al. 2014b), the amount of created fracture surface has to be considered in the estimation of G I dc. The
self-affine analysis of the fracture surface roughness strengthens this opinion. Indeed, the fracture surface roughness and also the surface area of the fracture sur- face varies significantly along the crack propagation direction. Knowing the evolution of the self-affine para- meters along the crack propagation direction (station- ary regimes A and B) and as a function of the mea- surement scale (OMP and IOM), is essential. With a multiplication of roughness analyses on RT polymers and semicrystallines the next step of this study will be the estimation of the fracture surface energy with the help of the self-affine parameters.
To conclude, the self-affine geometrical model with two parameters (Hurst exponent and topothesy) shows its effectiveness in this type of study. However, the sin- gle Hurst exponent is no longer sufficient, in itself, to describe all the regimes encountered and, principally, in these kinds of rubber toughened polymer materials. Topothesy values have been shown to be significantly different from one regime to another. Modelling the morphology of the fracture surface roughness with a statistical geometrical model is a practical issue to take into account scaling dependence and to estimate the fracture surface energy. The new guidance in the cal-culation of the ratio Ar with the self-affine model
will
Bouchaud JP, Bouchaud E, Lapasset G, Planès J (1993) Models of fractal cracks. Phys Rev Lett 71:2240–2243
Bouchaud E, Lapasset G, Planès J, Naveos S (1995) Statistics of branched fracture surfaces. Phys Rev B 48(5):2917–2928 Bouchaud E (1997) Scaling properties of cracks. J Phys Condens
Matter 9(21):4319–4344
Candela T, Renard F, Klinger Y, Mair K, Schmittbuhl J, Brodsky EE (2012) Roughness of fault surfaces over nine decades of length scales. J Geophys Res B Solid Earth 117:8 Candela T, Renard F, Bouchon M, Brouste A, Marsan D, Schmit-
tbuhl J, Voisin C (2009) Characterization of fault roughness at various scales: implications of three-dimensional high resolution topography measurements. Pure Appl Geophys 166:1817–1851
Deumié C, Richier R, Dumas P, Amra C (1996) Multiscale roughness in optical multilayers: atomic force microscopy and light scattering. Appl Opt 35(28):5583–5594
Doll W (1976) Application of an energy balance and an energy method to dynamic crack propagation. J Appl Polym Sci 12(4):595–605
Family F, Vicsek T (1985) Scaling of the active zone in the Eden process on percolation networks and the ballistic deposition model. J Phys A Math Gen 18(2):L75–L81 Feder J (1988) Fractals. Plenum Press, New York
Fond C, Schirrer R (2001) Dynamic Fracture Surface Energy and Branching Instabilities During Rapid Crack Propagation in Rubber Toughened PMMA. Notes au C R A S Ser IIb 329(3):195–200
Guerrero C, Reyes E, Gonzalez V (2002) Fracture surface of plastic materials: the roughness exponent. Polymer 43(25):6683–6693
Hinojosa M, Gonzalez V, Sanchez J, Ortiz U (2004) Scaling properties of the fracture surfaces of a crystalline polymer. Polymer 45(14):4828–4836
Kobayashi A, Ohtani N, Munemura M (1980) Dynamic stress intensity factors during viscoelastic crack propagation at various strain rates. J Appl Polym Sci 25(12):2789–2793 Kopp J-B, Lin J, Schmittbuhl J, Fond C (2013) Correlation
between the dynamic fracture surface energy GID and the amount of created surface. In: 13th international conference on fracture 2013, ICF 2013, 5, pp 4048–4056
Kopp J-B, Lin J, Schmittbuhl J, Fond C (2014a) Longitudinal dynamic fracture of polymer pipes. Eur J Environ Civil be useful in the e
A0
of the fracture energy. At Eng 18(10):1097–1105 stimation
small scales the model provides a strong dependence contrary to at large scales where it converges to the classically used value Ar =1.
A0
Acknowledgments The authors gratefully acknowledge the support of “Agence Nationale de la Recherche” and especially the collaborators of “Carenco”.
References
Barabasi A-L, Stanley HE (1995) Fractal concepts in surface growth. Press Syndicate of the University of Cambridge, Cambridge
Kopp J-B, Schmittbuhl J, Noel O, Lin J, Fond C (2014b) Fluctuations of the dynamic fracture energy values related to the amount of created fracture surface. Eng Fract Mech 126:178–189
Lapique F, Meakin P, Feder J, Jassang T (2002) Self-affine fractal scaling in fracture surfaces generated in ethylene and propylene polymers and copolymers. J Appl Polym Sci 86(4):973–983
Lopez JM, Schmittbuhl J (1998) Anomalous scaling of fracture surfaces. Phys Rev E 57(6):6405–6408
Maloy KJ, Hansen A, Hinrichsen EL, Roux S (1992) Experi- mental measurements of the roughness of brittle cracks. Phys Rev Lett 68:213–215
Mandelbrot BB (1982) The fractal geometry of nature. W.H.Freeman and Company, NewYork
Mandelbrot BB, Passoja DE, Paulay AJ (1984) Fractal character of fracture surfaces of metals. Nature 308:721–722
Meakin P (1998) Fractals: scaling and growth far from equi- librium. Press Syndicate of the University of Cambridge, Cambridge
Morel S, Schmittbuhl J, Lopez JM, Valentin G (1998) Anom- alous roughening of wood fractured surfaces. Phys Rev E 58:6999–7005
Mourot G, Morel S, Valentin G (2002) Comportement courbe-R d’un matériau quasi-fragile (le bois): influence de la forme des specimens d’essai. Colloque MATERIAUX
Nilsson F (1972) Dynamic stress-intensity factors for finite strip problems. Int J Fract 8(4):403–411
Osovski S, Srivastava A, Ponson L, Bouchaud E, Tvergaard V, Ravi-Chandar K, Needleman A (2015) The effect of loading rate on ductile fracture toughness and fracture surface roughness. J Mech Phys Solids 76:20–46
Ponson L, Bonamy D, Auradou H, Mourot G, Morel S, Bouchaud E, Guillot C, Hulin JP (1992) Anisotropic self-affine properties of experimental fracture surfaces. Int J fract 140(1–4):27–37
Scheibert J, Guerra C, Celarie F, Dalmas D, Bonamy D (2010) Brittle-quasibrittle transition in dynamic fracture: an ener- getic signature. Phys Rev Lett 104:045501-1–045501-4 Schmittbuhl J, Gentier S, Roux S (1993) Field measurements
of the roughness of fault surfaces. Geophys Res Lett 20(8):639–641
Schmittbuhl J, Schmitt F, Scholz C (1995a) Scaling invariance of crack surfaces. J Geophys Res 100(B4):5953–5973 Schmittbuhl J, Vilotte J-P, Roux S (1995) Reliability of
self-affine measurements. Phys Rev E 51(1):131–147 Schmittbuhl J, Chambon G, Hansen A, Bouchon M (2007) Are
stress distributions along faults the signature of asperity squeeze. Geophys Res Lett 33:L-13307
Schmittbuhl J, Steyer A, Jouniaux L, Toussaint R (2008) Frac- ture morphology and viscous transport. Int J Rock Mech Min Sci 45(3):422–430
Sharon E, Fineberg J (1999) Confirming the continuum theory of dynamic brittle fracture for fast cracks. Nature 397:333–335 Simonsen I, Hansen A, Nes OM (1998) Determination of the Hurst exponent by use of wavelet transforms. Phys Rev E 58:2779–2787
Simonsen I, Vandembroucq D, Roux S (2000) Wave scattering from self-affine surfaces. Phys Rev E 61(5):5914–5917 Srivastava A, Ponson L, Osovski S, Bouchaud E, Tvergaard V,
Needleman A (2014) Effect of inclusion density on ductile fracture toughness and roughness. J Mech Phys Solids 63(1):62–79
Williams JG (1972) Visco-elastic and thermal effects on crack growth in PMMA. Int J Fract 8(4):393–401
Yoffe EH (1951) The moving griffith crack. Philos Mag 42:739–750

![Fig. 7 Statistical data analysis MM obtained by the characteriza- tion of fracture surfaces of RT-PMMA (A and B) probed by OMP (sample JBK6); linear fitting for log(δ) ∈ [−2;1] for regimes (A) and (B) with slopes β A = 0.60 and β B = 0.62](https://thumb-eu.123doks.com/thumbv2/123doknet/14798574.605010/9.820.429.746.326.516/statistical-analysis-obtained-characteriza-fracture-surfaces-fitting-regimes.webp)