HAL Id: hal-00297186
https://hal.archives-ouvertes.fr/hal-00297186
Submitted on 12 Oct 2006
HAL is a multi-disciplinary open access
archive for the deposit and dissemination of
sci-entific research documents, whether they are
pub-lished or not. The documents may come from
teaching and research institutions in France or
abroad, or from public or private research centers.
L’archive ouverte pluridisciplinaire HAL, est
destinée au dépôt et à la diffusion de documents
scientifiques de niveau recherche, publiés ou non,
émanant des établissements d’enseignement et de
recherche français ou étrangers, des laboratoires
publics ou privés.
Variability of organic and elemental carbon, water
soluble organic carbon, and isotopes in Hong Kong
K.F. Ho, S.C. Lee, J.J. Cao, Y.S. Li, J.C. Chow, J.G. Watson, K. Fung
To cite this version:
K.F. Ho, S.C. Lee, J.J. Cao, Y.S. Li, J.C. Chow, et al.. Variability of organic and elemental carbon,
water soluble organic carbon, and isotopes in Hong Kong. Atmospheric Chemistry and Physics,
European Geosciences Union, 2006, 6 (12), pp.4569-4576. �hal-00297186�
© Author(s) 2006. This work is licensed under a Creative Commons License.
Chemistry
and Physics
Variability of organic and elemental carbon, water soluble organic
carbon, and isotopes in Hong Kong
K. F. Ho1, S. C. Lee1, J. J. Cao2, Y. S. Li1, J. C. Chow3, J. G. Watson3, and K. Fung4
1Research Center for Urban Environmental Technology & Management, Department of Civil & Structural Engineering, The
Hong Kong Polytechnic University, Hong Kong, China
2State Key Laboratory of Loess & Quaternary Geology, Institute of Earth Environment, Chinese Academy of
SciencesInstitute of Earth Environment, China
3Division of Atmospheric Sciences, Desert Research Institute, 2215 Raggio, Parkway, P.O. Box 60220, Reno, NV 89506,
USA
4AtmAA Inc., 23917 Craftsman Road, Calabasas, CA 91302, USA
Received: 13 February 2006 – Published in Atmos. Chem. Phys. Discuss.: 9 August 2006 Revised: 12 September 2006 – Accepted: 6 October 2006 – Published: 12 October 2006
Abstract. To determine the levels and variations of
carbona-ceous aerosol in Hong Kong, PM2.5and PM10samples were
collected by high volume (Hi-vol) samplers at three moni-toring stations (representing middle-scale roadside, urban-, and regional-scale environments) during winter (November 2000 to February 2001) and summer (June 2001 to August 2001) periods. The highest concentrations of organic carbon (OC), elemental carbon (EC), and water-soluble organic car-bon (WSOC) were found at the middle-scale roadside site with the lowest at the regional-scale site. The percentages of WSOC in total carbon at these sites were inversely corre-lated with their concentrations (i.e., the highest percentages of WSOC were observed at the regional-scale site). A high WSOC fraction may be associated with aged aerosol because of the secondary formation by photochemical oxidation of organic precursors of anthropogenic pollutants during trans-port. The annual average of isotope abundances (δ13C) of OC and EC were –26.9±0.5‰ and –25.6±0.1‰, respectively. There were no notable differences for seasonal distributions of carbon isotopic composition, consistent with motor ve-hicle emissions being the main source contributors of car-bonaceous aerosol in Hong Kong. OC13C abundances at the regional-scale site were higher than those at the middle-scale roadside and urban sites, consistent with secondary organic aerosols of biogenic origin.
Correspondence to: S. C. Lee
1 Introduction
In recent years, much research interest has been focused on atmospheric carbonaceous particles due to their influence on climate and adverse health effects (Chameides, 2002; Frazer, 2002). Total carbonaceous aerosol (TC) comprises a com-plex mixture that is classified mainly in two fractions: ele-mental carbon (EC, also called black carbon [BC] or soot) and organic carbon (OC). EC is emitted directly from com-bustion sources and undergoes little chemical transformation. It is a good indicator of primary anthropogenic air pollutants. However, OC can be emitted both from primary emission sources and from chemical reactions of gaseous organic pre-cursors in the atmosphere (Turpin and Huntzicker, 1995). Or-ganic compounds such as polycyclic aromatic hydrocarbon (PAH), oxy-PAH, and nitro-PAH are potential mutagens or carcinogens that have been found in urban particulate mat-ter (PM). In most urban areas, OC and EC constitute ∼20 to 50% of fine particle (PM2.5, particles with aerodynamic
diameter less than 2.5 µm) mass (Chow et al., 1993). Urban air pollution in Asia has been increasing and has become recognized at the regional, continental, and global scales (Street et al., 1999). Menon et al. (2002) showed that BC emitted from China and India affects regional climates. Cooke et al. (1999) estimated that ∼25% of global anthro-pogenic BC emissions originate from China. In contrast to other pollutants such as sulfate and nitrate, observations of OC and EC in Asia are insufficient (Cheng et al., 2000; Ho et al., 2003; Yao et al., 2002) for quantitative assessment of their environmental and climatic effects.
Hong Kong, located on the southeastern coast of the Asi-atic mainland and on the southern tip of the highly econom-ically developed Pearl River Delta (PRD) region in China,
4570 K. F. Ho: Variability of OC, EC, WSOC and isotopes in HK
Table 1. Description of the three monitoring sites in Hong Kong.
Site name (Code) Zone of representation Site type Site elevation Site description
PolyU (PU) roadside ∼6 m a.s.l. 8 m from a heavily-trafficked roadway that leads to the Cross Roadside Harbour Tunnel. Traffic volume 170 000 vehicles per day. Kwun Tong (KT) Urban urban- ∼25 m a.s.l. Near residential buildings with lightly-trafficked streets.
residential
Hok Tsui (HT) regional 60 m a.s.l. Near the coast at 60 m above sea level with 240◦of ocean view from Backgroud boundary northeast to southwest. 10 km away from urban areas and major roads.
km 8 0 PU KT HT South China Sea N Built Area Airshed Built Area Airshed N HT PU KT South China Sea km km 0 8
Fig. 1. Location of monitoring sites: middle-scale roadside Hung
Hom (Hong Kong Polytechnic University Campus [PU]); urban-scale Kwun Tong (KT); and regional-urban-scale Hok Tsui (HT) in Hong Kong.
is one of the most densely populated metropolitan areas in Asia. Most of Hong Kong’s 7 million inhabitants reside on
∼15% of its 1068 km2land area. According to The Census and Statistics Department of Hong Kong, 517 000 registered vehicles traveled on 1904 km of roads in 2000. Diesel trucks with high EC emissions accounted for ∼30% of the vehi-cle fleet. Air pollution in Hong Kong is also influenced by heavy industry, agricultural production, and shipping in the PRD region.
Ambient monitoring of PM2.5 and PM10 (particles with
aerodynamic diameter less than 10 µm) and PM2.5mass and
carbon was conducted during winter (November 2000 to February 2001) and summer (June to August 2001) at three sites in Hong Kong. In addition to OC and EC, water-soluble organic carbon (WSOC) and13C abundances in OC and EC were measured to understand their characteristics in the re-gion. This paper examines the spatial and seasonal variations of OC, EC, WSOC, and carbon isotopes.
2 Methodology
2.1 Sampling sites
The three sampling sites shown in Fig. 1 include: a
vehicle emission dominated middle-scale roadside Hung Hom site (Polytechnic University campus, PU); an urban-scale commercial-residential Kwun Tong (KT) site; and the regional-scale Hok Tsui (HT) site. Detailed site descriptions are given in Table 1.
2.2 Particulate matter collection
Twenty-four-hour sampling (midnight to midnight) was car-ried out every sixth day at the PU and KT sites, and five PM2.5 and PM10 samples each were collected during
win-ter and summer seasons at HT. PMsamples were acquired on 20.3 cm×25.4 cm Whatman quartz microfibre filters (QM/A, Whatman Inc., Clifton, NJ, USA) by high volume (hi-vol) samplers (Graseby-Andersen, Atlanta, GA, USA) operated at flow rates of 1130 to 1410 L/min. Two Partisol model 2000 (Rupprecht and Patashnick, Albany, NY) low volume sam-plers with 10 and 2.5 µm inlets, operated at 16.7 L/min, was used to collect PM2.5 and PM10 mass on Teflon-membrane
filters (Pall Life Sciences, Ann Arbor, MI). The difference between the hi-volume and the Partisol 2000 samplers was less than 7% for PM2.5 and PM10mass. The quartz-fiber
fil-ters were baked before sampling at 900◦C for 3 h to remove organic artifacts or impurities. After sampling, samples were stored in a refrigerator at ∼4◦C prior to chemical analysis to prevent the loss of volatile components. Approximately 5% of field blanks were collected to subtract the positive arti-facts that resulted from adsorption of gas-phase organic com-pounds onto the filter during and/or after sampling. Negative artifacts due to the volatilization of particle-phase organics from particle samples were not quantified in this study.
2.3 OC, EC, and WSOC analyses
Winter samples were analyzed for OC and EC by selective thermal manganese dioxide oxidation (TMO) with a modi-fied Dohrmann DC-52 carbon analyzer (Fung and Wright, 1990) at AtmAA Inc. of Calabasas, CA, USA. Summer sam-ples were analyzed using a DRI Model 2001 Thermal/Optical
Carbon Analyzer (Atmoslytic Inc., Calabasas, CA) at the Hong Kong Polytechnic University following the Intera-gency Monitoring of PROtected Visual Environments (IM-PROVE) thermal/optical reflectance (TOR) protocol (Chow et al., 1993). Previous laboratory comparisons between TMO and TOR by Fung et al. (2002) showed comparability for TC (total carbon), OC, and EC. Inter-laboratory comparison be-tween the two methods during this study reported <5% dif-ference for TC and ∼10% difdif-ferences for OC and EC. OC and EC data can be compared with minimal analytical bias.
Several methods have been used to analyze WSOC in par-ticulate samples by using the water extract of a filter sample (Yang et al., 2003). For this study, five punches (0.526 cm2)
were removed from a filter and placed into a flat-bottomed screw-capped vial to which 1 ml of distilled de-ionized water (DDW) was added. Sample vials were heated in an oven at
∼95◦C for ∼0.5 h. Samples were cooled to room tempera-ture and stood for ∼48 h. About 0.5 ml of the filter extract was transferred to another vial by syringe and 20 µl were taken for WSOC analysis. Triplicate analyses showed that a precision of ±10% can be achieved.
2.4 Stable carbon isotope analyses
Stable isotope analysis (13C/12C) of TC differs by emission source (Chesselet et al., 1981; Cachier et al., 1986, 1989; Martinelli et al., 2002). Only limited studies have examined isotope abundance (δ13C) in atmospheric OC and EC (Szidat et al., 2004; Huang et al., 2006). Variations of δ13C in OC and EC may provide a better understanding of the source and fate of carbonaceous aerosol.
OC and EC are operationally defined. Watson et al. (2004) describes more than 20 international thermal combustion car-bon methods for OC and EC. Different methods compound the uncertainties while evaluating isotope abundances in OC and EC (Reddy et al., 2002; Szidat et al., 2004; Huang et al., 2006).
In the study, δ13C was determined from carbon diox-ide (CO2)evolving at two temperatures and detected with
a Finnigan MAT-251 mass spectrometer (Thermo Electron Corporation, Burlington, Ontario, Canada). Particulate car-bonate was removed with hydrochloric acid prior to isotopic analysis. The remaining carbon was oxidized to CO2 with
CuO catalyst grains by heating at 375◦C (no oxygen [O2]
under vacuum) for 3 h. The CO2was isolated through a
se-ries of cold traps and δ13C in OC was quantified by offline analysis with a Finnigan MAT-251 mass spectrometer. The filter was then combusted at 850◦C for 5 h, and the resulting
CO2was purified in cold traps to determine δ13C in EC. δ13C
international standard (PDB) as:
δ13C = (13C/12Csample/13C/12Cstandard−1) × 1000
Samples (five replicate analyses) were analyzed at least in duplicate with a maximum allowable difference of 0.3‰.
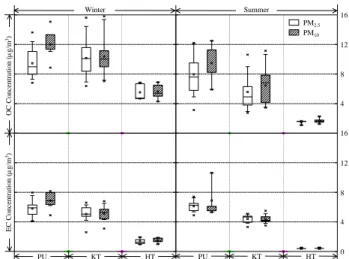
Figure 3 Winter Summer OC Co nc en trati o n (µ g/ m 3) PU KT HT PU KT HT EC Co nc en trati o n ( µg/ m 3) 4 8 0 12 16 4 8 12 16 PM2.5 PM10
Fig. 2. Box plots of organic carbon (OC) and elemental carbon
(EC) concentrations (µg/m3) in PM2.5 and PM10 samples
dur-ing the winter and summer periods at middle-scale roadside Hung Hom (Hong Kong Polytechnic University Campus [PU]); urban-scale Kwun Tong (KT); and regional-urban-scale Hok Tsui (HT) in Hong Kong.
3 Meteorological conditions
The climate in Hong Kong (22.12 N, 114.08 E) is sub-tropical, under the influence of the Asian monsoon. Summer and winter are the two longest seasons, each with distinct me-teorological characteristics. Prevailing southwesterly wind during summer brings warm and damp air masses from the South China Sea. In winter, prevailing northeasterly wind travels across South China before reaching Hong Kong. Air quality in Hong Kong is poorest in winter due to the influ-ence of local sources and polluted air mass transported from South China. The meteorological information in this study was obtained from Hong Kong Observatory (HKO).
4 Results and discussion
4.1 Spatial and seasonal distributions of OC and EC A total of 100 PM2.5 and PM10 samples (including field
blanks) were collected for this study. Spatial and seasonal distributions of OC and EC are illustrated in Fig. 2, with av-erage concentrations listed in Table 2. PM2.5 mass varied
from 10–39 µg m−3during summer and from 42–53 µg m−3 during winter. Corresponding PM10concentrations were 15–
54 µg m−3during summer and 76–83 µg m−3during winter. PM2.5accounted for 72–76% of PM10mass during summer,
compared to 53–81% during winter. On average, TC (i.e., OC + EC) explains 26% and 32% of PM2.5mass during
win-ter and summer, respectively. The corresponding TC frac-tions were 6–7% less in PM10. The average TC in PM2.5
4572 K. F. Ho: Variability of OC, EC, WSOC and isotopes in HK
Table 2. Average (±std. deviation) PM2.5and PM10organic carbon (OC) and elemental carbon (EC) concentrations during the winter and
summer at three monitoring sites.
No. of samples
PM2.5 PM10
Mass OC EC
TC/Mass (%) OC/EC Mass OC EC TC/Mass (%) OC/EC
µg m−3 µg m−3 PU (urban) Winter 26 52.5±5.4 11.2±1.8 6.4±1.2 33.3±3.2 1.8 83.0±18.4 12.1±2.2 7.0±1.2 23.5±3.3 1.7 Summer 10 39.0±9.1 10.2±2.4 5.9±0.3 41.9±4.2 1.7 53.5±12.5 11.1±2.2 6.3±0.3 33.3±4.1 1.8 KT (urban-residential) Winter 22 61.7±32.0 8.8±1.8 4.8±0.6 24.8±7.1 1.8 76.3±30.2 9.5±1.9 5.1±0.6 20.6±5.4 1.8 Summer 22 30.1±10.6 5.9±2.5 4.5±0.6 37.1±3.6 1.6 39.8±11.5 6.9±2.5 4.8±0.6 27.3± 8.4 1.6 HT (urban background) Winter 10 42.4±13.3 5.5±1.1 1.4±0.4 16.9±3.1 4.1 80.0±30.4 5.9±1.1 1.6±0.4 9.9 ± 2.1 3.8 Summer 10 10.5±1.8 1.5±0.3 0.4±0.1 18.3±2.2 3.6 14.5±2.8 1.9±0.4 0.5±0.1 16.7±5.3 4.3 Average Winter 58 52.2±19.8 8.7±2.8 4.3±2.3 25.5±8.3 2.5 80.0±24.7 9.3±3.2 4.7±2.5 18.4±7.0 2.4 Summer 42 27.4±13.6 5.9±3.8 3.6±2.1 32.4±11.1 2.3 36.9±17.5 6.7±3.9 3.8±2.3 26.1±9.0 2.3
Table 3. Average (±std. deviation) PM2.5 and PM10water-soluble organic carbon (WSOC) concentrations during winter and summer at
three monitoring sites.
No. of samples PM2.5 PM10 WSOC µg m−3 WSOC/OC (%) WSOC/Mass (%) WSOC/EC WSOC µg m−3 WSOC/OC (%) WSOC/Mass (%) WSOC/EC PU (urban) Winter 10 3.5±0.5 31.6±5.5 6.6±0.7 0.5 3.9±0.6 32.8±6.2 4.8±0.8 0.6 Summer 10 2.1±0.3 21.5±6.3 5.6±1.5 0.4 2.4±0.2 22.6±6.5 4.7±1.3 0.4 KT (urban-residential) Winter 10 3.4±1.0 38.4±7.2 6.1±2.2 0.7 3.7±1.1 39.3±7.4 5.3±2.2 0.7 Summer 10 2.1±0.9 34.5±10.7 8.1±2.8 0.5 2.3±0.9 32.7±7.6 6.8±2.6 0.5
HT (urban background) Winter 10 2.8±0.6 51.3±7.4 7.1±2.2 2.0 3.1±0.7 53.1±5.7 4.1 ±1.0 1.9
Summer 10 1.0±0.3 69.0±8.5 9.9±2.1 2.5 1.2±0.3 62.6±7.7 8.7± .5 2.4
Average Winter 30 3.2±0.7 39.9±10.5 6.6±1.7 0.7 3.6±0.8 41.2±10.6 4.8±1.4 0.8
Summer 30 1.7±0.7 42.3±23.1 7.8±2.7 0.5 1.9±0.8 31.4±24.1 5.3±3.8 0.5
winter, which is similar to previous observations by Cao et al. (2003). PM2.5 and PM10 OC concentrations at the PU
and KT sites ranged from 8.8 to 12.1 µg m−3 during win-ter and from 5.9 to 11.1 µg m−3 during summer, whereas the corresponding PM2.5 and PM10EC ranged from 4.8 to
7.0 µg m−3during winter and 4.5 to 6.3 µg m−3during sum-mer. The seasonal contrast is only 35–55% for OC and 6– 26% for EC at the PU and KT sites. Winter PM2.5and PM10
OC concentrations were 3- to 4-fold and EC concentrations were 3-fold higher than those found during summer at the HT site.
Several factors can affect the carbon concentrations. Dilu-tion due to increased mixing depths (greater convective mix-ing) (Sequeira and Lai, 1998) and particle washout on rainy days resulted in lower PM and carbon levels in the summer (monthly average rainfall ranged from 318.9 to 1083 mm in summer and from 10.9 to 96.8 mm during winter). Win-tertime stagnation decreased the dispersion and transport of pollutants and resulted in an increase in pollution levels. Northeasterly winds during winter carried air pollutants from China to Hong Kong, which elevated PM and carbon concen-trations at the regional-scale site.
At the three sites, 78–99% of EC and 79–98% of OC in PM10 were found in the PM2.5 fraction of PM10. Average
PM2.5 and PM10OC concentrations at the PU and KT sites
were 2–3 times higher and EC concentrations were 4–5 times higher than those at the HT site. Elevated OC and EC con-centrations at the urban sites reflect the influence of vehicle exhaust, along with emissions from restaurants and nearby industries.
Ratios of OC to EC have been used to imply the origin of carbonaceous particles (Turpin et al., 1995; Chow et al., 1993). Table 2 shows that the OC/EC ratios at the two urban sites (1.6–1.8) were half of those found at the regional-scale site, with little variation between summer and winter. Low OC/EC ratios are primarily due to the elevated EC concen-trations at the urban sites, implying direct emissions from an-thropogenic sources. Elevated OC/EC ratios at the regional-scale site suggested the transport of aged aerosol that may have included secondary organic aerosol (SOA).
4.2 Variability of WSOC
The water-soluble fraction of OC (i.e., WSOC) often con-sists of >30% of PM2.5or PM10OC, often being associated
with polar compounds and correlated with SOA formation (Grosjean et al., 1978; Rogge et al., 1993). WSOC has the potential to modify the hygroscopic properties of particles,
1.00 0 .75 0 .50 0 .25 0. 001.0 0 0.8 0 0 .6 0 0 .4 0 0 .2 0 0 .00 PU-winter KT-winter HT-winter PU-summer KT-summer HT-summer EC WIOC WSOC 0.00 0.25 0.50 0.75 1.00
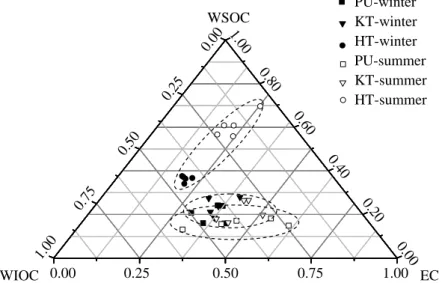
Fig. 3. Compositions of elemental carbon (EC), water-soluble organic carbon (WSOC), and water-insoluble organic carbon (WIOC) (given
as fractions of TC) in PM2.5during the winter and summer periods at middle-scale roadside Hung Hom (Hong Kong Polytechnic University
Campus [PU]); urban-scale Kwun Tong (KT); and regional-scale Hok Tsui (HT) in Hong Kong.
including PM size and cloud condensation nuclei activities (Shulman et al., 1996).
A total of 60 samples comprising of five pairs of PM2.5
and PM10 samples selected at each site from the summer
and winter seasons were analyzed for WSOC. As shown in Table 3, ∼80–90% of the PM10 WSOC was in the PM2.5
fraction, ranging from 1–2 µg m−3 during summer and 3–
4 µg m−3during winter. Wintertime WSOC was ∼1.5–2
times higher than in summer with less spatial variation. Low summertime WSOC (∼1 µg m−3)may be due to clean marine air masses from the South China Sea. The major sources of WSOC include primary emissions from biomass burning and cooking, as well as secondary organic aerosol (Chebbi and Carlier, 1996). Transformation and transport of pollutants from urban areas may be the reason for higher (∼3 µg m−3)wintertime WSOC at the HT site. During the same monitoring period, atmospheric aromatic hydrocarbons such as toluene and xylenes, some of the main precursors of SOA (Ho et al., 2004), were determined. Concentra-tions of aromatic compounds were 2–6 times higher in win-ter than in summer at the HT site. The formation of SOA occurs both with the oxidation of naturally emitted terpenes and with anthropogenic volatile organic compounds (VOCs), particularly those with high molecular weights. As VOCs or primary organic aerosols react with photochemically de-rived oxidants (O3, OH·, NO3·), they generate more polar
compounds such as alcohols, carbonyls, carboxylic acids and more complex oxidized compounds (Saxena and Hildemann, 1996). Consequently, it is speculated that a high WSOC frac-tion is indicative of aged aerosol (e.g. due to photochemical reactions.). This is consistent with the results from Temesi et al. (2003). In addition, previous study has shown that
di-carboxylic acids are one of the major identified components of WSOC (Grosjean et al., 1978; Rogge et al., 1993). The spatial-temporal distributions of PM2.5dicarboxylic acids at
the three sites reported by Yao et al. (2004) showed similar trends as WSOC in this study.
The relative percentages of PM2.5WSOC, water-insoluble
OC (WIOC = OC-WSOC), and EC in TC are presented in the ternary diagrams (Fig. 3). The percentages of WSOC in TC were similar at PU (13–20%) and KT (21–24%) in win-ter and summer as the smallest fraction of PM2.5 carbon. In
contrast, the regional HT site showed that WSOC was the largest TC fraction (41–54%), with higher summer levels. This is consistent with the notion that regional-scale sites are mostly impacted by aged aerosol. Salma et al. (2001) showed that the mass fraction of WSOC increased from a tunnel to a background area. Meanwhile, the EC concen-tration is reduced during transport to the background site because of dilution. This explains why WSOC becomes a large fraction (50–70%) of OC at the HT site and accounts for only about one-third of OC at the PU and KT sites for PM2.5 and PM10 in both seasons. WSOC constitutes small
fractions of PM2.5and PM10mass, ranging from 5.6±1.3%
to 9.9±2.1% for PM2.5and from 4.1±1.0% to 8.7±0.5% for
PM10(Table 3). The WSOC/OC ratios were higher in winter
than in summer at PU and KT. Other than primary emissions, transport from the urban area was one of the possible sources of WSOC in winter. However, the WSOC/OC ratios at the regional-scale HT site were higher in summer (69%) than in winter (51%). This was the result of more aged aerosols at the HT site. Moreover, elevated WSOC/EC ratios can be used as indicators for aged aerosol. The average WSOC/EC ratios at the urban PU and KT sites were 0.4–0.6 and 0.5–
4574
Figure 4
K. F. Ho: Variability of OC, EC, WSOC and isotopes in HK PUW KTW HTW PUS KTS HTS I II EC(‰) OC(‰) -25 -26 -27 -28-25 -26 -27 -28Fig. 4. Isotopic composition (δ13C) of organic carbon (OC) and elemental carbon (EC) during the winter and summer periods at middle-scale roadside Hung Hom (Hong Kong Polytechnic Univer-sity Campus [PU]); urban-scale Kwun Tong (KT); and regional-scale Hok Tsui (HT) in Hong Kong.
0.7 (Table 3), respectively, which are similar to the ratio at a high-traffic roadside site in Paris (0.32) (Ruellan and Cachier, 2000). However, the average WSOC/EC ratios at the HT site were ∼2.0 for winter and ∼2.5 for summer.
4.3 Stable carbon isotopic composition of OC and EC Twenty-four PM2.5 were analyzed for δ13C composition of
OC and of EC, with the results in Fig. 4.
The average δ13C(OC) abundance was –26.9±0.6‰,
ranging from –26.4‰ to –27.7‰ during winter. A simi-lar average δ13C(OC) abundance (–26.9±0.5‰) was found in summer, ranging from –26.3 to –28.1‰. The average
δ13C(EC) abundance for both seasons was –25.6±0.1‰ ranging from –25.4‰ to –25.9‰. The small difference in carbon isotopic abundance between the two seasons in Hong Kong is consistent with similar source mixtures. Rudolph et al. (2002) also observed little variability in13C abundances for nonmethane hydrocarbons (NMHC) from traffic-related sources in the metropolitan region of Toronto. As shown in Fig. 4, δ13C exhibited isotopic variability among the three sites, and these samples can be grouped into two clusters. Given that the13C isotopic fractionation between an aerosol and its fuel is small (Turekian et al., 1998; Currie et al., 1999) and that no apparent isotopic fractionation is occurring dur-ing particle production and transport (Cachier et al., 1985), similar isotopic composition of OC and EC at the PU and KT sites (Group I in Fig. 4) are consistent with motor vehicle
ex-haust as the major contributor. Huang et al. (2006) observed the similar phenomenon of the distribution of δ13C in OC and EC from a tunnel site (Cassier Tunnel) and a forest site (Golden Ears) in Canada when motor vehicle exhaust was the dominant sources of two sites. The δ13C(EC) at HT is sim-ilar to that found at the PU and KT sites, but the δ13C(OC) at HT (Group II in Fig. 4) is isotopically lighter than those at the PU and KT sites. δ13C(EC) values at the HT site were similar to those at the urban PU and KT sites, suggesting that the majority of the EC originated from motor vehicle emis-sions. Huang et al. (2006) also found that EC is inert and likely to preserve the primary source characteristics. While
δ13C(OC) was similar at the PU and KT sites, its abundance was lower at the HT site (–27.2‰ to –28.1‰), implying con-tributions from non-motor vehicle sources. Cachier et al. (1996) reported that the δ13C(OC) associated with sea-salt droplets is –21±2 . From the δ13C(OC) difference between the HT and PU sites (Fig. 4), it is unlikely that OC at HT is of direct marine origin. The carbon isotopic signatures of C3 in bulk plant materials range from –27.7‰ to –29.2‰
(Ballentine et al., 1998). Hence, it may be that biogenic sources, through gas-to-particle conversion processes, con-tribute to regional OC. The distribution of dicarboxylic acids at the HT site is also consistent with biogenic origins (Yao et al., 2004). Kim et al. (2000) showed that local biogenic emissions of OC might be significant during summer at the Kosan (126◦100E, 33◦170N) background site in Korea. Szidat et al. (2004) demonstrated that SOA may be formed nearly exclusively from biogenic precursor gases even in an urban environment.
5 Summary and conclusion
During the study, average OC concentrations in PM2.5 and
PM10fractions at the urban sites were higher in winter than
in summer. The highest concentration of EC was observed at the micro-scale roadside PU site in both seasons because of the nearby vehicle emissions. Relatively low OC and EC concentrations were found at the HT regional-scale site be-cause it was far from direct emission sources. OC/EC ratios at HT were larger than those at the PU and KT sites owing to the formation of SOA during transport. Average PM2.5 and
PM10WSOC concentrations were also higher in winter than
in summer. In contrast to the urban PU and KT sites, higher percentages of WSOC in TC were found at the HT site in both seasons. Average WSOC/EC ratios were <1 at the PU and KT sites, and ∼2.0 to 2.5 at the HT site. These spa-tial variations suggested that a high WSOC fraction might be associated with aged aerosol. In addition, there were no no-table differences for summer/winter distributions of carbon isotopic composition, indicating that motor vehicle sources were the main contributors of carbonaceous particles within the urban areas. Spatial distributions of δ13C in EC were uni-form, reconfirming the dominant influence of motor vehicle
source. However, lighter isotopic compositions in OC found at the HT site, compared with those at the urban sites, indi-cated the existence of biogenic sources at the regional-scale site. It is apparent that the use of carbon isotope composition in combination with OC and EC has considerable potential to allow for a more detailed assessment of source identifi-cation. These analyses may provide a feasible and cost ef-fective technique for conducting source determinations and for quantitatively estimating relative contributions of differ-ent sources.
Acknowledgements. This project is supported by the Research Grants Council of Hong Kong (PolyU5038/01E, PolyU5145/03E) and the Natural Science Funding of China (NSFC 40205018). Edited by: T. R¨ockmann
References
Ballentine, D. C., Macko, S. A., and Turekian, V. C.: Variability of stable carbon isotopic compositions in individual fatty acids from combustion of C4 and C3 plants: implications for biomass burning, Chem. Geol., 152, 151–161, 1998.
Cachier, H., Buat-Menard, P., Fontugne, M., and Rancher, J.: Source terms and source strengths of the carbonaceous aerosol in the Tropics., J. Atmos. Chem., 3, 469–489, 1985.
Cachier, H., Buat-Menard, P., Fontugne, M., and Chesselet, R.: Long-range transport of continentally-derived particulate carbon in the marine atmosphere: evidence from stable carbon isotopes studies, Tellus, 38B, 161–177, 1986.
Cachier, H., Bremond, M.-P., and Buat-Menard, P.: Carbonaceous aerosols from different tropical biomass burning sources, Nature, 340, 371–373, 1989.
Cao, J. J., Lee, S. C., Ho, K. F., Zhang, X. Y., Zou, S. C., Fung, K., Chow, J. C., and Watson, J. G.: Characteristics of Carbonaceous Aerosol in Pearl River Delta Region China during 2001 Winter Period, Atmos. Environ., 37, 1451–1460, 2003.
Chameides, W. L.: Bergin M. Soot Takes Center Stage, Science, 297, 2214–2215, 2002.
Chebbi, A. and Carlier, P.: Carboxylic acids in the troposphere, occurrence, sources, and sinks: A review, Atmos. Environ., 30, 4233–4250, 1996.
Cheng, Z. L., Lam, K. S., Chan, L. Y., Wang, T., and Cheng, K. K.: Chemical characteristics of aerosols at coastal station in Hong Kong. I. Seasonal variation of major ions halogens and mineral dusts between 1995 and 1996, Atmos. Environ., 34, 2771–2783, 2000.
Chesselet, R., Fontugne, M., Buat-Menard, P., Ezat, U., and Lam-bert, C. E.: The origin of particulate organic carbon in the marine atmosphere as indicated by its stable carbon isotopic composi-tion, Geophys. Res. Lett., 8, 345–348, 1981.
Chow, J. C., Watson, J. G., Lowenthal, D. H., Solomon, P. A.,
Magliano, K. L., Ziman, S. D., and Richards, L. W.: PM10and
PM2.5compositions in California’s San Joaquin valley, Aerosol
Sci. Technol., 18, 105–128, 1993.
Cooke, W. F., Liousse, C., and Cachier, H.: Construction of a
1◦×1◦fossil fuel data set for carbonaceous aerosol and
imple-mentation and radiative impact in the ECHAM4 model, J. Geo-phys. Res., 104(D18), 22 137–22 162, 1999.
Currie, L. A., Klouda, G. A., Benner Jr., B. A., Garrity, K., and Eglinton, T. I.: Isotopic and molecular fractionation in combus-tion three routes to molecular marker validacombus-tion including di-rect molecular “dating” (GC/AMS), Atmos. Environ., 33, 2789– 2806, 1999.
Frazer, L.: Seeing through soot, Environ. Health Perspect., 110, A471–A473, 2002.
Fung, K. K. and Wright, B.: Particulate Carbon Speciation by
MnO2Oxidation, Aerosol Sci. Technol., 12, 122–127, 1990.
Fung, K. K., Chow, J. C., and Watson, J. G.: Evaluation of OC/EC Speciation by Thermal Manganese Dioxide Oxidation and the IMPROVE Method, JAWMA, 52, 1333–1341, 2002.
Grosjean, D., Van Cauwenberghe, K., Schmid, J., Kelley, P., and
Pitts, J. N.: Identification of C3-C10aliphatic dicarboxylic acids
in airborne particulate matter, Environ. Sci. Technol., 12, 313– 317, 1978.
Ho, K. F., Lee, S. C., Chan, C. K., Yu, J. C., Chow, J. C., and Yao,
X. H.: Characterization of chemical species in PM2.5and PM10
aerosols in Hong Kong, Atmos. Environ., 37, 31–39, 2003. Ho, K. F., Lee, S. C., Guo, H., and Tsai, W. Y.: Seasonal and diurnal
variations of volatile organic compounds (VOCs) in the atmo-sphere of Hong Kong, Sci. Total Environ., 322, 155–166, 2004. Huang, L., Brook, J. R., Zhang, W., Li, S. M., Graham, L., Ernst,
D., Chivulescu, A., and Lu, G.: Stable isotope measurements of carbon fractions (OC/EC) in airborne particulate: A new di-mension for source characterization and apportionment. Atmos. Environ. 40, 2690–2705, 2006.
Kim, Y. P., Moon, K.-C., Shim, S.-G., Lee, J. H., Kim, J. Y., Fung, K., Camichael, G. R., Song, C. H., Kang, C. H., Kim, H.-K., and Lee, C. B.: Carbonaceous species in fine particles at the back-ground sites in Korea between 1994 and 1999, Atmos. Environ., 34, 5053–5060, 2000.
Martinelli, L. A., Camargo, P. B., Lara, L. B. L. S., Victoria, R. L., and Artaxo, P.: Stable carbon and nitrogen isotopic composi-tion of bulk aerosol particles in a C4 plant landscape of southeast Brazil, Atmos. Environ., 36, 2427–2432, 2002.
Menon, S., Hansen, J., Nazarenko, L., and Luo, Y. F.: Climate Ef-fects of Black Carbon Aerosols in China and India, Science, 297, 2250–2253, 2002.
Reddy, C. M., Pearson, A., Xu, L., Mchichol, A. P., Benner, B. A., Wise, S. A., Klouda, G. A., Currie, L. A., and Eglinton, T. I.: Ra-diocarbon as a Tool To Apportion the Sources of Polycyclic Aro-matic Hydrocarbons and Black Carbon in Environmental Sam-ples, Environ. Sci. Technol., 36, 1774–1782, 2002.
Rogge, W. F., Mazurek, M. A., Hildemann, L. M., Cass, G. R., and Simoneit, B. R. T.: Quantification of urban organic aerosols at a molecular level: Identification, abundance and seasonal varia-tion, Atmos. Environ., 27A, 1309–1330, 1993.
Rudolph, J., Czuba, E., Norman, A. L., Huang, L., and Ernst, D.: Stable carbon isotope composition of nonmethane hydrocar-bons in emissions from transportation related sources and atmo-spheric observations in an urban atmosphere, Atmos. Environ., 36, 1173–1181, 2002.
Ruellan, S. and Cachier, H.: Characterisation of fresh particulate vehicular exhausts near a Paris high flow road, Atmos. Environ., 35, 453–468, 2000.
Com-4576 K. F. Ho: Variability of OC, EC, WSOC and isotopes in HK
prehensive characterisation of atmospheric aerosols in Budapest Hungary: physicochemical properties of inorganic species, At-mos. Environ., 35, 4367–4378, 2001.
Saxena, P. and Hildemann, L. M.: Water-soluble organics in at-mospheric particles: a critical review of the literature and appli-cation of thermodynamics to identify candidate compounds, J. Atmos. Chem., 24, 57–109, 1996.
Sequeira, R. and Lai, K.-H.: Small-scale spatial variability in the representative ionic composition of rainwater within urban Hong Kong, Atmos. Environ., 32, 133–144, 1998.
Shulman, M. L., Jacobson, M. C., Charlson, R. J., Synovec, R. E., and Young, T. E.: Dissolution behavior and surface tension ef-fects of organic compounds in nucleating cloud droplets, Geo-phys. Res. Lett., 23, 277–280, 1996.
Streets, D. G., Carmichael, G. R., Amann, M., and Arndt, R. L.: En-ergy consumption and acid deposition in Northeast Asia, Ambio, 28, 135–143, 1999.
Szidat, S., Jenk, T. M., Gaggeler, H. W., Synal, H. A., Fisseha, R., Baltensperger, U., Kalberer, M., Samburova, V., Wacker, L., Saurer, M., Schwikowski, M., and Hajdas, I.: Source
apportion-ment of aerosols by14C measurements in different carbonaceous
particle fractions, Radiocarbon, 46(1), 475–484, 2004.
Temesi, D., Molnar, A., Meszaros, E., and Feczko, T.: Seasonal and diurnal variation in the size distribution of fine carbonaceous par-ticles over rural Hungary, Atmos. Environ., 37, 139–146, 2003.
Turekian, V. C., Macko, S., Ballentine, D., Swap, R. J., and Garstang, M.: Causes of bulk carbon and nitrogen isotopic frac-tionations in the products of vegetation burns: laboratory studies, Chem. Geol., 152, 181–192, 1998.
Turpin, B. J. and Huntzicker, J. J.: Identification of secondary or-ganic aerosol episodes and quantitation of primary and secondary organic aerosol concentrations during SCAQS, Atmos. Environ., 29, 3257–3544, 1995.
Watson, J. G., Chow, J. C., and Chen, L.-W. A.: Summary of methods and comparison studies for organic and elemental car-bon: Implications for visibility and global warming, in: Proceed-ings, Regional and Global Perspectives on Haze: Causes, Con-sequences and Controversies Visibility Specialty Conference, edited by: Pitchford, M. and Poirot, R., Air and Waste Man-agement Association, Pittsburgh, PA, 55-1–55-38, 2004. Yang, H., Li, Q. F., and Yu, J. Z.: Comparison of two methods for
the determination of water-soluble organic carbon in atmospheric particles, Atmos. Environ., 37, 865–870, 2003.
Yao, X. H., Fang, M., and Chan, C. K.: Size distributions and for-mation of dicarboxylic acids in atmospheric particles, Atmos. Environ., 36, 2099–2107, 2002.
Yao, X. H., Fang, M., Chan, C. K., Ho, K. F., and Lee, S. C.:
Char-acterization of dicarboxylic acids in PM2.5 in Hong Kong,
At-mos. Environ., 38, 963–970, 2004.

![Fig. 4. Isotopic composition (δ 13 C) of organic carbon (OC) and elemental carbon (EC) during the winter and summer periods at middle-scale roadside Hung Hom (Hong Kong Polytechnic Univer-sity Campus [PU]); urban-scale Kwun Tong (KT); and regional-scale](https://thumb-eu.123doks.com/thumbv2/123doknet/14774602.593048/7.892.88.418.89.439/isotopic-composition-organic-elemental-periods-roadside-polytechnic-regional.webp)
