HAL Id: hal-01632983
https://hal.archives-ouvertes.fr/hal-01632983
Submitted on 10 Nov 2017
HAL is a multi-disciplinary open access
archive for the deposit and dissemination of
sci-entific research documents, whether they are
pub-lished or not. The documents may come from
teaching and research institutions in France or
abroad, or from public or private research centers.
L’archive ouverte pluridisciplinaire HAL, est
destinée au dépôt et à la diffusion de documents
scientifiques de niveau recherche, publiés ou non,
émanant des établissements d’enseignement et de
recherche français ou étrangers, des laboratoires
publics ou privés.
Vertical short-scale structures in the upper tropospheric
and lower stratospheric temperature and ozone at la
Réunion Island (20.8°S, 55.3°E)
Fabrice Chane-Ming, Franck Molinaro, Jean Leveau, Philippe Keckhut, Alain
Hauchecorne, Sophie Godin
To cite this version:
Fabrice Chane-Ming, Franck Molinaro, Jean Leveau, Philippe Keckhut, Alain Hauchecorne, et al..
Vertical short-scale structures in the upper tropospheric and lower stratospheric temperature and
ozone at la Réunion Island (20.8°S, 55.3°E). Journal of Geophysical Research: Atmospheres, American
Geophysical Union, 2000, 105 (D22), pp.26857-26870. �hal-01632983�
JOURNAL OF GEOPHYSICAL RESEARCH, VOL. 105, NO. D22, PAGES 26,857-26,870, NOVEMBER 27, 2000
Vertical short-scale structures in the upper tropospheric
and lower stratospheric temperature and ozone at la R(union
Island (20.8øS, $$.3øE)
Fabrice Chane-Ming, Franck Molinaro, and Jean Leveau
Laboratoire de Physique de l'Atmosphare, Universitd de la Rdunion, la Rdunion, France
Philippe Keckhut, Alain Hauchecorne, and Sophie Godin
Service d'Adronomie du CNRS, France
Abstract. The distribution and the nature of vertical short-scale structures observed in
ozone and temperature are investigated in the upper troposphere and the lower stratosphere at La Reunion Island located in the vicinity of the southern subtropical barrier by using wavelet-based methods. A climatology of dominant wavelike patterns with short vertical wavelengths reveals the presence of localized structures on both the ozone and the temperature perturbations, extracted from ozonesonde and temperature data, up to the middle stratosphere. Some case studies are presented to identify the nature of short-scale structures with 1- to 5-km vertical wavelengths in the troposphere and the stratosphere. A climatology of short-scale structures induced by gravity waves and the horizontal advection shows that short-scale structures are mainly detected in the middle and upper troposphere and in the lower stratosphere. The weak value of the coefficient R(z) that links the ozone and temperature perturbations induced by gravity waves is a major limit to detecting such short-scale structures above 21-km altitude. Some structures with vertical wavelengths ranging from 1 to 5 km are attributed to gravity waves produced by convection in summer and the subtropical jet in winter, or quasi-horizontal large-scale motions from both sides of the subtropical barrier.
1. Introduction
Large- and short-scale waves such as the planetary and grav- ity waves are now well recognized to be important sources of the variability of long-lived trace constituents resulting in both vertical and horizontal exchanges in the atmosphere [Ehhalt et al., 1983; Pfister et al., 1986; Lamarque et al., 1996]. The inter- pretation of the phase relationship between large-scale pertur- bations of ozone and temperature was first used to bound the atmospheric regions where dynamics and photochemistry are
dominant. Some numerical simulations have been done to
interpret the ozone-temperature correlation and have demon- strated that the knowledge of the wave activity is required because the dynamical contribution to the ozone-temperature correlation can mimic a photochemical dominance [Wang et al., 1983; Rood and Douglass, 1985; Douglass and Rood, 1986; Froideveaux et al., 1989]. Thus transport processes are impor- tant for the understanding and the prediction of the global change [Holton et al., 1995].
For small scales, Chiu and Ching [1978] first proposed an analytical estimation of the linear response of trace gases to internal gravity wave motions in order to interpret small-scale density variations of the neutral or ionospheric layer struc- tures. The temporal variation of trace gas profiles and the total stratospheric column were investigated, respectively, as good indicators of the presence of gravity waves in the troposphere and the stratosphere where some gases have maximum-
Copyright 2000 by the American Geophysical Union. Paper number 2000JD900199.
0148-0227/00/2000JD 900199509.00
concentration layers [Gruzdev and Elanskiy, 1984; Gruzdev, 1989]. In fact, by assuming two-dimensional adiabatic motions with small-amplitude gravity waves [Teitelbaum et al., 1994, 1996] and no horizontal gradient of mean quantities, the nor- malized perturbations of the ozone quantity, in the linear case, can be linked to the mean vertical gradient of ozone and the
perturbations of the vertical wind:
with
OS(z,
03(z) = real
t) ( i dO3(z)
oO(z) dz w
'
)
(1)
O• = O•(z) exp(i(coot- k x - ly)) a r'(z, t)
w' =-icøN2(z)
?(z) '
(2)
03, O} denote
the unperturbed
background
and perturba-
tions
of ozone
mixing
ratio; •', T' are the mean temperature
and perturbations; to, to o are the intrinsic and observed fre- quencies; k, 1 are the zonal and meridional wave numbers; N is the static stability and # is the acceleration of gravity. Since the photochemical lifetime of ozone in the stratosphere below 25-km altitude is very long, sources and sinks of ozone are left out of account in (1). From (1) and (2) we obtain the simplified relation that links the normalized perturbations of ozone and
temperature:
O;(z, t) T'(z, t)
?(z)
(3)
with
26,858 CHANE-MING ET AL.' VERTICAL SHORT-SCALE STRUCTURES
R(z)
= •(--• O(z)
] '
(4)
where 0 is the mean potential temperature.
This expression shows that the phase relationship between the normalized perturbations of ozone and temperature de- pends on the sign of R(z) and more particularly on the sign of the mean vertical gradient of the ozone background. Ehhalt et al. [1983] first showed experimentally that the normalized local mean standard deviation to the local gradient of the different long-lived stratospheric trace gas concentrations ("equivalent displacement height" (EDH)) exhibits comparable values with height. This observation agrees well with (3), which helps to determine the role of vertical displacements produced by grav- ity waves or quasi-horizontal displacements on isentropic sur- faces [Andrews et al., 1987]. The values of EDH are shown to be globally attributed to transport processes and not only to vertical motions [ROth and Ehhalt, 1987]. Eckermann et al. [1998] formalized the complete analytical formulas that ex- press the response of vertical minor constituent profiles of arbitrary shape or broadly of conserved quantities to adiabatic gravity-wave displacements. The normalized potential temper- ature perturbations agree with those of temperature. In our study we assume that the ozone background is linear and constant with time. This first approach is consistent with the results of the relative contribution of the shape of the ozone background in the response of the constituent to gravity-wave motions detailed by Eckermann et al. [1998].
Holton [1987] observed that the tracer variability induced by gravity waves in the stratosphere is highly correlated with fluc- tuations of potential temperature and can be used as evidence of vertical displacements induced by gravity waves. For those induced by horizontal motions produced by planetary waves, equation (7) from Rood and Douglass [1985], deduced from the linearized eddy continuity equation on a •3 plane (equation (5)) coupling the chemistry and dynamics [Hartman and Garcia, 1979], shows that the coefficients of correlation between ozone and temperature perturbations are weak due to a _+90 phase lag depending upon the sign of the horizontal gradient of the
mean wind.
0 0
+
)
+
0b
+ w'37
=
or',
where •,/x' denote, respectively, the zonal mean ozone mixing ratio and the perturbations; a is the mean zonal wind; v' and w' are the perturbations of meridional and vertical velocities; T' is the perturbations of temperature; • and 0 are the re- sponse of the ozone mixing ratio to dynamically induced per- turbations in ozone and temperature.
As mentioned in previous studies on midlatitudes near the edge of the winter polar vortex [Mitchell et al., 1996; Shepherd, 1997], the gravity-wave field deduced from minor constituents or temperature perturbations can be contaminated by laminar structures induced by large-scale differential advection due to breaking Rossby waves [Reid et al., 1993; Plumb et al., 1994; Bird et al., 1997; Orselini et al., 1998]. Gibsen-WiMe et al. [1997] observed simultaneously two small-scale structures on the ver- tical ozone profile around the same height range in the strato- sphere. Using a relation similar to (1), it was demonstrated that these structures originated from processes of different nature; one resulted from a synoptic-scale quasi-horizontal advection and the other one from gravity waves. Appenzeller and Holton
[1996], using ozone UARS measurements, reported that the lowermost stratosphere, which is influenced by the tropopause, and the subtropical lower stratosphere, which is characterized by important vertical wind shears, are affected by the quasi- horizontal advection, respectively, year-round and during spring. Such structures are thought to be less frequent in the Southern Hemisphere compared to the Northern Hemisphere where the winter polar vortex is more perturbed. Recently, Jest et al. [1998] first reported a case study of laminae in the tropical middle stratosphere during the final vortex breakup. The origin and the age estimation of air masses suggested a possible transport from midlatitudes into the tropics [Jest et al., 1998] in addition to planetary-scale motions moving from the tropics to the midlatitudes [Randel et al., 1993].
Climatologies of gravity waves are crucial to understanding vertical transport and mixing, whereas the identification and the quantification of advective structures are of interest to understanding the horizontal transport processes and mixing, for example, by means of irreversible intrusions of air masses between the tropics and the subtropics along isentropic sur- faces across the subtropical barrier [Grant et al., 1998]. The simultaneous existence of both phenomena together with pos- sible interaction make the problem difficult to study each phe- nomenon separately.
One of the characteristic features of the observational site
lies in its location relative to the barrier depending on the season. Grant et al. [1996] showed that the region at 21øS from about 22-24 km was generally outside of the tropical strato- spheric reservoir during the year following the eruption of Mount Pinatubo. As for the region dominated by ozone, it was in the tropics about half the time but outside about a third of the time. This enables the study of gravity waves which are generated by convection and the subtropical jet, respectively, during austral summer and winter in addition to possible in- trusions of midlatitude and tropical air masses from both sides of the subtropical barrier. The identification and the charac- terization of wavelike patterns in the temperature and ozone perturbations proposed in this study are based on the wavelet techniques which appear to be well adapted to analyze and to separate multiscaled structures embedded in data [Chane-Ming et al., 1999, 2000]. First, we present a climatology of the dom- inant wavelike structures with vertical wavelengths inferior to 7 km which are extracted separately from ozonesonde and tem- perature data from the ground up to 27 km at La Reunion Island since September 1992. Then the study focuses on the nature of short-scale structures with vertical wavelengths be- tween 1 and 5 km. Two typical case studies of short-scale structures induced by gravity waves and the horizontal advec- tion are presented for austral summer and winter. These case studies are finally followed by a preliminary climatology of short-scale structures induced by gravity waves and large-scale motions in the upper troposphere and the lower stratosphere
above La Reunion Island.
2. Data Set and Analysis Tools
The present study is carried out on measurements provided by V•iis•il•i RS80 radiosondes launched at the La Reunion Island since September 1992. Radiosondes are also equipped with RS80 electrochemical concentration cell (ECC) ozone- sonde for the vertical ozone profile data from the lower tro- posphere up to the upper stratosphere. The precision is less than 0.2øC in temperature and 1.5 nbar in ozone partial pres-
CHANE-MING ET AL.: VERTICAL SHORT-SCALE STRUCTURES 26,859
sure up to the lower stratosphere [Komhyr et al., 1995]. A precision of ___3% in the ozone mixing ratio is obtained in the stratosphere below 10 mbar. Vertical profiles of temperature and ozone partial pressure are sampled every 150 m.
La Reunion Island is located in the southeast part of Indian Ocean in the intertropical region at a distance of 700 km from Madagascar. The island is under tropical conditions during austral summer (December-February) due to the location of the Intertropical Convergence Zone (ITCZ) near the island and under subtropical conditions during austral winter (June- August) when the subtropical jet moves nearer the island and
becomes stronger.
Since September 1992, radiosondes are launched every two weeks at about 0900 LST at Gillot Airport in the northern part of the island near the university where the data reception system is installed [Baldy et al., 1996]. Gillot is on the coast at
the altitude of about 24 m above the sea level. More than 130
ozonesonde measurements were collected from September 1992 to December 1998. The climatology of dominant modes is carried out on vertical profiles of temperature and ozone up to a maximal altitude varying between 20 and 27 km with the data reporting intervals of 150 m for the period between September
1992 and December 1997. In 1998, during the Transport of
Chemical Species Across the Subtropical Tropopause (TRACAS) campaign, additional ozonesondes were launched. These data are further included to improve the climatology of small-scale structures induced by gravity waves and horizontal advection because such a study requires that vertical profiles of both temperature and ozone are available for the same radio-
sonde, which is not really the case during the first years.
The perturbations of temperature and ozone partial pres-
sure are first retrieved from the raw measurements. The ozone
partial pressure perturbations are obtained by using a IIR fourth-order Butterworth low-pass filter with a cutoff of 7-km vertical wavelength [Mitchell et al., 1996]. These perturbations are obtained from the removal of the mean vertical profile to the raw temperature vertical profile. This low-pass filter is generally used in such studies to determine the mean temper- ature profile of the lower and middle atmosphere [Teitelbaum et al., 1994]. The extraction is improved particularly around the tropopause for the temperature when the filtering is processed separately on the two different parts: one below the tropo- pause and one above, corresponding to the troposphere and the stratosphere, respectively. At the ends of vertical profiles, the filtering process is improved by a linear extrapolation of data.
To study the multiscaled structures embedded in the vertical perturbation profiles of temperature and ozone measure-
ments, the dominant wavelike structures are identified and
extracted from the altitude-wavelength representations pro- vided by the wavelet techniques such as the continuous wavelet transform (CWT) with the Morlet complex-valued "mother" wavelet and the multiresolution analysis (MRA) [Daubechies, 1992; Torrerice and Compo, 1998; Chane-Ming et al., 1999, 2000]. The set of nonorthogonal functions used in the CWT expansion results from the translation and the dilation of the mother wavelet. The properties and the shape of the Morlet wavelet were shown to be well adapted to signatures of wave- like structures induced by gravity waves in the middle atmo- sphere [Chane-Ming et al., 2000]. The dominant structures are retrieved from representations of the modulus of CWT coef- ficients (so-called scalograms) by selecting the CWT spectral
lines of each perturbation profiles. The CWT spectral lines result from the identification of the local maxima [Chane-Ming et al., 2000] with values larger than 1 and 5.5 corresponding to the instrumental precision for the temperature and ozone per- turbations, respectively. The statistical distributions of domi-
nant modes using the CWT are based on the "elementary"
energy d2E(a, b) of local maxima at the location a in scale
and b in altitude of the altitude-wavelength pane'
CWT(a, b) 2 dadb
d:E(a, b): a : . (6)
The elementary energy is calculated with the timescale density [Farge, 1992] defined as the square modulus of the CWT co- efficients out of the scale parameter a. The total energy E is conserved in the timescale representation
œ: d:œ(a, b), (7)
c 9
where c g normalizes the mother wavelet g [T offence and
Compo, 1998].
Unlike the CWT, the multiresolution analysis (MRA) pro- vides orthonormal wavelet decomposition by means of filter banks made up of iterated orthogonal filters regularly spaced over the frequency space into octave bands. Using the pyramid scheme [Rioul and l/etterly, 1991], the signal is successively broken down into an approximation a (a coarse signal) and a detail d (fine structures) with a pair of orthonormal low-pass and high-pass filters, respectively. Each detail is associated with wavelike structures in a specific vertical wavelength band- width defined by the octave-band decomposition. At the fourth order of iteration, for example, a 150-m sampled signal can be reconstructed by adding d•, d2, d3, d4, and a4, which contain structures with vertical wavelengths of 0.3-0.6, 0.6-1.2, 1.2- 2.4, 2.4-4.8, and >4.8 km, respectively. As opposed to the CWT, the analyzed signal can be perfectly reconstructed (with very negligible errors) by adding the details and the last ap- proximation. The Daubechies wavelet with eight vanishing mo- ments (DB8) revealed to be well adapted to extract wavelike structures induced by gravity waves [Chane-Ming et al., 1999]. The filter coefficients and their properties are detailed by Dau- bechies [1992] and Chane-Ming et al. [2000]
Reid and Faughan [1991] proposed a threshold value of 20 nbar in ozone partial pressure for their global climatology of
laminar structures and concluded that laminar structures are
not observed in the tropical lower stratosphere and rarely observed in the subtropical lower stratosphere. It was recently shown that using such a threshold value underestimates the frequency of occurrence of laminae in the lower stratosphere, as Pierce and Grant [1998] proved by using a relative threshold value that takes into account the background values. Therefore a threshold value of 4% larger than the instrumental precision in the ozone mixing ratio is considered in our climatology.
3. Climatology of Dominant Wavelike
Structures
The CWT is applied to the perturbations of temperature and ozone partial pressure derived from vertical profiles of tem- perature and ozone during austral summer (December- February) and winter (June-August). Figure 1 displays typical
26,860 CHANE-MING ET AL.: VERTICAL SHORT-SCALE STRUCTURES Temperatree profile
lO
o 20O 250 3OO Tmape•atnre (K) Mean profile •o •so Temperature Perturb•on profile -5 o T•ap•ature (K)Raw and mean profile
30
I lo
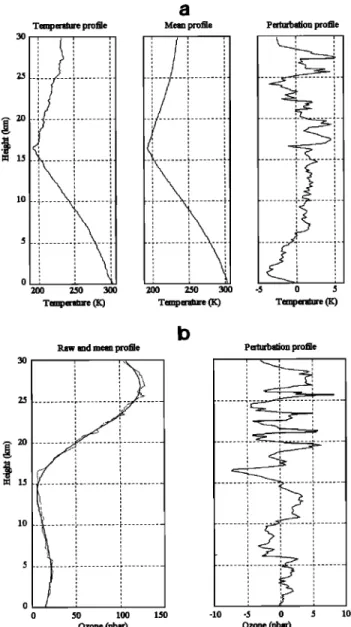
lO $ o o 50 lOO 150 ozone (nb•r) Perturbation profile -10 -5 0 5 10 Ozone (nbar)Figure 1. Radiosonde measurements with 150-m spatial res- olution on January 10, 1995, at La Reunion Island: (a) vertical temperature profiles: raw profile, mean profile resulting from the application of a IIR low-pass filter with a cutoff of 7-km vertical wavelength and perturbation profile; (b) vertical ozone profiles: raw profile, mean profile, and perturbation profile.
vertical profiles of temperature and ozone partial pressure and the perturbations obtained at La Reunion Island at heights below 30 km. The study does not concern interseasonal peri- ods, which are transitional periods with day-to-day variation in the dynamics of the lower atmosphere. In addition, the tropo- spheric ozone content is contaminated by African biomass burning during the months between September and late No- vember [Baldy et al., 1996]. Plate 1 shows the vertical distribu- tions of temperature and ozone perturbations for the two sea- sons up to 27 km. Amplitudes of temperature and ozone perturbations are globally observed to be larger in the strato- sphere. The decrease of the air density with height partially explains this observation. Because of the difficulty of the ex- traction of the mean profiles around the tropopause and the ozonopause, some residue of the mean profiles can appear on some perturbation profiles. These appear as wavelike patterns with vertical wavelengths larger than 10 and 7 km, respectively,
in the perturbation profiles of temperature and ozone. Possible
effects of such structures are therefore reduced when short-
scale structures with vertical wavelengths below 7 km are con- sidered. The temperature of the lower and middle troposphere is observed to be more perturbed in winter than in summer in particularly due to the presence of inversion layers in the lower atmosphere, the tropospheric jet, and the horizontal transport. Note that whatever the season perturbations of the ozone, amplitudes are smaller than the threshold value of 20 nbar suggested by Reid and Vaughan [1991]. The CWT is applied to each vertical perturbation profile of temperature and ozone partial pressure to extract spectral lines of dominant modes.
The statistical distributions of dominant modes show evidence
of multiscaled structures, well localized in altitude, embedded
in the perturbations of temperature and ozone partial pressure during austral summer and winter with the vertical wavelength between 1 and 7 km from the ground up to 27 km (Plate 2). The diversity of observed dominant structures suggests a con- tribution of different sources and wave processes in the per- turbations. The major sources of short-scale waves such as gravity waves in the troposphere and the lower stratosphere are thought to be convection during austral summer and the subtropical jet during winter [Allen and Vincent, 1995]. Some observed modes with 2-km vertical wavelength in the upper troposphere and the lower stratosphere could be attributed to gravity waves produced by convection during summer [Pfister et al., 1993; Karoly et al., 1996; Shimonai et al., 1996; Yamanaka et al., 1996], whereas the subtropical jet could be a major source of modes with 3- to 4-km vertical wavelengths in the winter troposphere and stratosphere [Thomas et al., 1992; Murayama et al., 1994; Sato et al., 1997]. In addition, dominant wavelike structures with 1- to 4-km vertical wavelengths are observed to be absent in the summer middle troposphere. Moreover, dom- inant modes with 5- to 6-km vertical wavelengths are present during both summer and winter in the middle and upper tro- posphere but more intense during summer. Deep convection could be a source of such dominant modes in the troposphere up to the tropopause, as suggested by Allen and Vincent [1995] for similar observed dominant modes. The more interesting
observation is the existence of some modes with main similar
characteristics (vertical wavelength, location) in the tempera- ture (Plates 2a and 2b) and ozone (Plates 2c and 2d) pertur- bation profiles. Modes with vertical wavelengths inferior to 3 km are also observed in the ozone perturbations in the upper troposphere and the stratosphere during summer and modes with vertical wavelengths between 5 and 6 km in the middle and upper troposphere. Dominant modes with vertical wavelengths of about 3-4 and 6 km are evident in the ozone perturbations during winter. These observations suggest a possible correlation between the temperature and the ozone perturbations for particular dominant modes in summer and winter which could be mainly attributed to gravity waves and quasi-horizontal large-scale motions. Moreover, the pres- ence of dominant modes with a vertical wavelength of about
3-4 km is consistent with that observed from 30-km altitude
during winter above La Reunion Island by the use of a Rayleigh lidar. A first climatology of dominant modes in the middle atmosphere above La Reunion Island recently con-
firmed that such similar modes were also dominant in the
upper stratosphere during austral winter in 1994 [Chane- Ming et al., 2000].
CHANE-MING ET AL.: VERTICAL SHORT-SCALE STRUCTURES 26,861 Winter I ! • ... • '-:' .:21,• •.•:'g ,.•"c.• •? •
• - i - >'
d'.;,:
•*i
'•' '-. '.[
"',
'•
.'
•'•7'•
•'
1 0 F ... i ... t ... •..•4.:,>.• :•=?75 -;½g,:.:;->.:,;: .... :.:.•;• ... ! / • • .•Z•E, ' ::• ;?•'"• X,,".'-'½ M•-=--'T TM Is[.
...
, ...
...
.,
....
...
...
/
• -• -4 -2 o 2 4 • '"•Temperature
(C)
b.Summer
Winter
-25 -20 -15 -10 -5 0 :5 10 15 20 25 -50 -40 -30 -20 -10 0 10 20 30 40Ozone (nba0
Ozone (nbar)
Plate 1. Perturbations (green dots), mean values (black line), and the extrema (blue lines) of ozonesonde data at La Reunion Island from September 1992 to December 1997 during austral summer (December-
February) and winter (June-August): (a, b) temperature, (c, d) ozone partial pressure.
5O
4. Case Studies of Wavelike Structures Induced
by Gravity Waves and Advection
The wavelet techniques are applied to data to study wavelike
structures in ozonesonde measurements in order to character- ize the nature of short-scale features which are observed both
in the ozone and in the temperature perturbations. These techniques are illustrated on two typical case studies at La Reunion Island during austral summer and winter for which some observed wavelike structures can be interpreted as ver- tical displacements induced by short-scale gravity waves or the horizontal large-scale advection.
The CWT with the Morlet wavelet is applied to the pertur- bations of ozone and temperature extracted from the vertical profiles of temperature and ozone partial pressure from the ground up to 30 km. The scalograms in Plates 3a and 3b enable us to identify easily wavelike structures with similar character- istics (location, vertical wavelength, energy) in both the tem- perature and the ozone perturbations on January 10, 1995, in
summer at La Reunion Island (Figure 1). They provide the distribution of vertical wavelengths versus altitude of wavelike structures imbedded in the perturbations. We observe the
presence of dominant wavelike structures with 3- to 6-km ver-
tical wavelengths in the lower and the middle troposphere, a quasi-monochromatic structure with 2-km wavelength in the upper troposphere and the stratosphere in Plates 3a and 3b, and other structures with vertical wavelengths superior to 6 km from the troposphere up to the stratosphere. The distribution of the dominant mode with 2-km wavelength, which extends from the upper troposphere up to 27-km height, is clearly evident in the scalograms. This last observation suggests a strong possible relationship between both observed structures. Plate 4 pictures the superposition of contour lines of the pos- itive and the negative real part of the CWT coefficients of the previous temperature and ozone perturbations. These repre- sentations provide a detailed visualization of the extrema of wavelike patterns and the phase relationship between temper-
26,862 CHANE-MING ET AL.' VERTICAL SHORT-SCALE STRUCTURES 25 ÷ 20 20 lO Temperature (summa) 0.05 0.03 0.02 0.01 25
.• 15
10 Temperature (winter) 2 3 4 5 6 7 1 2 3 4 5 6Vertical wavelength (kin) Vertical wavelength (kin)
Ozone (summer) Ozone (v•nter)
25 0.7 0.6 20
0.4
..• 15
.,,.•0.3
•
10 0.2 0.1 2 3 4 5 6 7 I 2 3 4 5 6 7Vertical wavelength (km) Vertical wavelength (kin)
Co do
Plate 2. Statistical distribution of dominant modes with vertical wavelengths less than 7 km extracted from the CWT of perturbations of temperature and ozone partial pressure presented in Plate 1.
[0.06 0.05
0.01
.5
ature and ozone perturbations identified in the previous de- scribed scalograms. Different phase relationships between the dominant wavelike structures are observed in the temperature and ozone perturbations. The mode with 3.5-km vertical wave- length is observed to be out of phase in the lower troposphere and decreases with increasing height to 2-km vertical wave- length in the upper troposphere where the structures are in phase up to 26 km (Plate 4). The continuity in the vertical distribution of these structures in the troposphere and the stratosphere suggests a same origin for these structures. In addition, the decrease of the vertical wavelength from the troposphere up to the lower stratosphere might be explained by the increase of the static stability of 1.5 in the linear wave dispersion relation (rn = _ N/w kh) by assuming that the ratio of the horizontal wave number and the intrinsic frequency remains constant [Meriwether, 1993].
The degree of correlation between the short-scale structures of 2-km vertical wavelength is quantified from the CWT coef- ficients obtained for this vertical wavelength (Table 1). The real and the imaginary part of the coherency of the dominant vertical structures of 2.2-km vertical wavelength (Figure 2,
panels 4 and 5) provide the phase relationship between the temperature and the ozone perturbations where the CWT co- efficients of both the temperature and the ozone perturbations are significant (see Figure 2, panel 3). These short-scale struc-
tures are anticorrelated from 5 to ---12-13 km and correlated in
the upper troposphere and the stratosphere. In addition, a decrease of the amplitudes of both the perturbations of tem- perature and ozone is observed at 22-km altitude which is
accompanied with a convective instability. The observation of
a minimum of variance of perturbations around 22-km altitude in the vertical profiles of stratospheric trace gas concentration was also noted by Ehhalt et al. [1983].
Wavelike structures with a vertical wavelength bandwidth between 1.2 and 2.4 km (detail d3) were extracted by the MRA from both the perturbations of ozone and temperature, respec- tively, normalized by the ozone and the temperature back- ground profiles (Figure 3, panel 1). To compare locally the amplitudes and the phase of the temperature and ozone per- turbations, the filtering process of the ozone perturbation pro- files was improved around the tropopause. By using a second- order polynomial fit, the C-shaped trend of ozone perturbation
CHANE-MING ET AL.: VERTICAL SHORT-SCALE STRUCTURES 26,863
Scalogram- Morlet wavelet
0.5 27.2 22.7 18.2 13.7 9.2 4.7
Normalized spectral modulus
Modulus , 0.2 0.5 0:6 0•9 113 118 216 ':•'•6' '5:1 "7.2 Vertical wavelength
i
7
•5 0 5
aeScalogram: Morlet wavelet
0.5
Normalized spectral modulus
27.2 22.7 18.2 13.7 9.2 4.7 Modulus
,I
0.2 0 0.5 0.6 0.9 1.3 1.8 2.6 3.6 5.1 Vertical wavelength (km) 12 lO 2 -5 0 5 bePlate 3. Scalograms
of vertical
perturbation
profiles
with the Morlet
complex-valued
wavelet
for radiosonde
data
on January
10, 1995:
(a) vertical
temperature
perturbation
profile,
(b) vertical
ozone
perturbation
profile.
Scalogram
or the modulus
of the CWT coefficients
(middle
panel),
the perturbation
profile
(right-hand
26,864 CHANE-MING ET AL.: VERTICAL SHORT-SCALE STRUCTURES 27.2 22.7 ,•, 18.2
.•:•
13.7
9.2 0.2 0.45Positive
real part (radiosounding
Reunion:
950110)
....
_-- _
. •
_.
0'
.64 019 1128
...
•8C ....
21'5-"•
:•' ':5-16i 5111-
"--•.23
Vertical wavelength
(km)
b.
Negative
real part (radiosounding
Reunion:
950110)
22.7 _ " . "'• ,;; ß - ß : i _
,•, 18.2
• ' . ... '-' 9.2....
.... :.. :::5:• , 4.7 0.2 ...0.45 0.64 07
].28 1.81 2.56 3.61 5.11 7.23
Vertical wavelength
(km)
Plate 4. Contour lines of (a) the positive and (b) negative real part of the CWT coefficients are superposed
for the vertical
temperature
and ozone
perturbation
profil.es,
blue and red contour
lines,
respectively.
profiles at heights between 16 and 19 km is retrieved only from
the ozone profiles of which the mean value at these altitudes is less than -5 nbar. The normalized vertical perturbation profile of temperature is multiplied by R(z) (refer to the introduc-
tion). The sign of the 600-m running mean of the R (z) profile is represented by the dashed line. The short-scale structure is
well observed in both the perturbations of temperature and ozone and correlated from 10-km altitude up to 21 km with
CHANE-MING ET AL.' VERTICAL SHORT-SCALE STRUCTURES 26,865
Table 1. Analogy of Statistics, Fourier Transform, and Wavelet Transform Analysis [after Liu, 1994]
Statistics Fourier Transform Continuous Wavelet Transform
Variance frequency spectrum
E(X -IIX(o,)11
Covariance cross spectrum
D = X(o)
Coefficient of correlation coherency
wavelet spectrum
WSx(a, b) = IlCWrx(a, b)11
cross-wavelet spectrum
WS(a, b) = CWT.(a, b) CW%(a, b) * wavelet coherency
E(XY)
Sxv(to)
F =
WSxv(a,
b)
r = x/E(X)E(y)
•/= x/Sx(to)
Sv(to)
x/WSx(a,
b)WSv(a,
b)
*WS, wavelet spectrum; CWT(a, b), continuous wavelet transform coefficients at the scale and time parameters a and b, respectively.
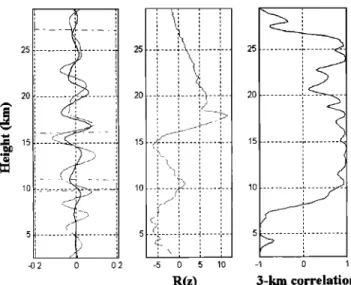
similar amplitudes near the tropopause height (Figure 3). The correlation is observed to be greater than 0.7. This observation is in good agreement with (3). The amplitudes are in phase from 9-km height, increase with height from 10 km up to the tropopause, and decrease above. The sign of R (z) is also given by the real part of the wavelet coherency (Figure 2, panel 4). Equation (3) is not valid where the vertical gradient of the ozone background is null, for example, at 14 km in this case. Another case of perturbations induced by gravity waves in both the temperature and the ozone profiles of June 1, 1995, in winter at La Reunion Island is presented. The contour lines of the negative real part of CWT coefficients of the temperature and ozone perturbations are represented in Plate 5a. A quasi- monochromatic structure with 3-km vertical wavelength is ob- served from the ground up to the stratosphere. The phase relationship is given by the real part of the wavelet coherency in Plate 5b (panel 4). Negative values are observed at the altitudes between the ground and 5, 10, and 14 km. The real part of the wavelet coherency is equal to 1 at 6.5-km altitude. These observations are consistent with the behavior of the sign of R(z) (Figure 4, panels 1 and 2). Figure 4 (panel 1) shows the structure with 3-km vertical wavelength which is retrieved
20 ... 15 .... 1 0 5 WS-T WS-O3 10 0 20 40 -1 WS-T*WS-O3 0 1 R[Coh] -1 o 1 I[Coh] Figure 2. Correlation between the perturbation profiles of temperature and ozone using the CWT coefficients for the 2-km vertical wavelength. Five graphs, from left to right, rep- resent the wavelet spectrum of the temperature perturbation profile, the wavelet spectrum of the ozone perturbation profile, the product between the wavelet spectra, the real part, the imaginary part of the coherence.
from the temperature and ozone perturbations (detail d4) by using the MRA. The amplitudes of perturbations are well correlated at heights between 10 and 20 km where the ampli-
tudes have similar order.
Contrary to the above mentioned cases, Figure 5 shows two cases where perturbation profiles give evidence of wavelike structures in the middle and upper troposphere with weak coefficients of correlation at heights between 10 and 18 km on December 1, 1994 (panel I), and between 5 and 15 km on June 29, 1993, respectively, during austral summer and winter. Note that the amplitude relationship computed from (3) between the normalized ozone and the temperature perturbations is not verified. These observed perturbations are therefore attributed to the horizontal advection, caused by tropical planetary waves and exchanges of air masses across the subtropical barrier.
Ogino et al. [1995, 1997] presented cross-equatorial (Japan- western Pacific Ocean-Antarctica) distributions of intensity of
short-scale vertical fluctuations for dominant modes of 2- to
3O
•
15
15
10 10 0 431 0 01 -1 -05 0 05 3-km correlationFigure 3. Normalized perturbations of the temperature and the ozone mixing ratio (black and gray curves, respectively, in the first panel) on January 10, 1995, for the vertical wavelength bandwidth between 1.2 and 2.4 km (detail d3) by using the MRA. The temperature perturbation profile has been multi- plied by the factor R (z). The dashed line represents the sign of
R(z) (negative sign = -1.2, positive sign -- 1.2). The second
panel depicts the 3-km correlation between temperature and ozone perturbations visualized in the first panel.
26,866 CHANE-MING ET AL.' VERTICAL SHORT-SCALE STRUCTURES
,•, 18.2
•-• 13.7
9.2
Negative
real
part
(radiosounding
Reunion:
950601
27.2- ---'--- ... •'"'•'••----•?•__'- •
22.7
--- ...
_...'--7-Z_
.... --'•z_-' - '
4.7 0.2• 0.45 0.64 0.9 1.28 1.81 2.56 3.61 5.11 7.23Vertical wavelength
(km)
ae 25 _ _ 1 ... 20 10 0 0 $ 10 0 20 40 0 100 200-1 0 1 -1 0WS-T WS-O3 WS-T*WS-O3 RiCoh] I[Coh]
be
Plate 5. CWT of vertical perturbation profiles on June 1, 1995, at La Reunion Island: (a) superposed contour lines of the negative real part of the CWT coefficients for the vertical temperature and ozone perturbation profiles (same as Plate 4), (b) correlation between the temperature and the ozone perturbation profiles using the CWT coefficients for the 4-km vertical wavelength (same as Figure 2).
CHANE-MING ET AL.: VERTICAL SHORT-SCALE STRUCTURES 26,867 10 5 ,, -02 0 02 R(z) 25 20 ... ½ : -1 0 1 $-!• correlation
Figure 4. Normalized perturbations of the temperature and the ozone mixing ratio (black and gray curves, respectively, in the first panel) on June 1, 1995, for the vertical wavelength bandwidth of 2.4-4.8 km (detail d4) by using the MRA. The temperature perturbation profile has been multiplied by the factor R(z) (second panel). The sign of R(z) is represented in the first panel (dashed line) and the 3-km correlation in the
third panel.
4-km vertical wavelengths which are usually observed in the lower stratosphere. The coefficients of correlation between the normalized fluctuations of potential temperature and ozone suggested that the perturbations of temperature and ozone in
the lower stratosphere at low latitudes could be mainly ex-
plained by vertical displacements on contrary to those ob- served at midlatitudes for which both dynamics and photo- chemical processes must be considered [Ogino etal., 1997].
5. Climatology of Small-Scale Structures
Induced by Gravity Waves and Advection
To estimate the seasonal evolution of ozone laminae using ozonesonde data, Pierce and Grant [1998] recently proposed a method to identify perturbations of normalized potential tem- perature and ozone induced by gravity waves and the horizon- tal advection. This was applied to ECC ozonesonde data and potential temperature profiles for several stations from 25.0.5øS to 19.6øN in the tropics and subtropics [Grant etal., 1998]. The coefficients of correlation values varying between +0.3 for normalized amplitudes of perturbations larger than 4% are here considered to distinguish short-scale structures induced by the horizontal advection between those induced by gravity waves of which the coefficients of correlation are greater than 0.7. A 3-km window is used to process coefficients of correlation. The C-shaped trend in the ozone perturbation profiles around the tropopause height is retrieved from the vertical ozone perturbation profiles. The method proposed by Pierce and Grant [1998] is here performed by using the MRA. By this way, perturbation profiles can be automatically ex- panded into details d3 (1.2-2.4 km), d 4 (2.4-4.8 km), and d34 (1.2-4.8 km). The detail d3 4 results from the sum of d3 and d4
and enables us to take into account structures with vertical
wavelengths around 2.4 km. Details are extracted from pertur- bations of normalized temperature and ozone for the period
between September 1992 and December 1998 at heights be-
tween 3 and 27 km.
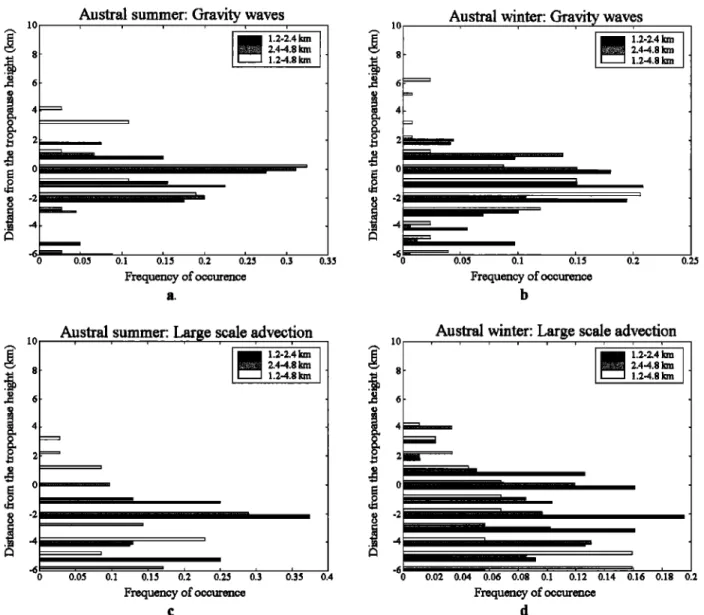
Figure 6 shows the frequency of occurrence of detected laminar structures induced by gravity waves and the horizontal advection relative to the tropopause height in the upper tro- posphere and the lower stratosphere. During austral summer (Figure 6a), short-scale vertical structures induced by gravity waves are mainly detected in the upper troposphere and the lower stratosphere peaking at the tropopause. A few structures can also be observed around 10-km altitude. During winter the peak is located below the tropopause height (Figure 6b). For both seasons, structures induced by gravity waves with signifi- cant amplitudes are detected in the troposphere up to 4 km above the tropopause height. The period of January-February corresponds to the greatest activity of convection, whereas the period of July-August corresponds to those of the subtropical jet core centered at 11-km altitude in the midtroposphere. Most short-scale vertical structures induced by the horizontal
{
:
-02 0 02 -1 --05 0 05 S-ion correlation --• ... i---: :':"•,: ... ', ... •-•-:,-i----
-02 -01 0 01 02 3O 1 05 0 05 S-kin correlation Figure 5. Normalized perturbations of the temperature and the ozone mixing ratio (black and gray curves in the first panel) on (a) December 1, 1994 and (b) June 29, 1993, respectively, for the vertical wavelength bandwidth of 1.2-2.4 km with char-26,868 CHANE-MING ET AL.' VERTICAL SHORT-SCALE STRUCTURES
10
Austral summer:
Gravity waves
,1.:2-:2.41•
2.4-4.8 1.24.8 km
'% o.o• o.• o'.• o.2 o.2• o.•
Frequency of occurencc
10
Austral winter: Gravity waves
1.2-2.4
•
2.4-4.8 1.2-4.8 km
-•6- 'olo* oi• oi• 'o12 o.:•
Frequency of occurence
b
lO
A,ustral
,summer:
Large
s,
cale
a,
dvect,
ion
1.2-2.4 2.4-4.8 km 1.2-4.8 km'% o.o• o.• o.• oa o.2• o.• oi• o.•
Frequency of occuronce
Austral winter: Large scale
advection
i , , i , 1 , ,
1.2-2.4
•
2.4-4.8 1.2-4.8 km ... E '--illrllllliirlrl[1111 .4 _•j; i , , , ' , i i i ' , ,i i 0 0.02 0.04 0.06 0.08 0.1 0.1:l 0.14 0.16 0.18 0.2 Frequency of occurence dFigure 6. (a, b) Climatology of laminae induced by gravity waves and (c, d) large-scale advection during
austral summer and winter from September 1992 to December 1998.
advection are observed under the tropepause during summer (Figure 6c) peaking at 2 km below the tropepause height. On the contrary, those observed during winter (Figure 6d) are more important and detected from 5 km below the tropepause to the lower stratosphere. In fact, intrusions of subtropical air
masses into the tropics during austral summer and those of
tropical air masses into the subtropics are expected. Table 2
indicates the percentage of soundings for which short-scale structures are detected with characteristics of gravity waves and the horizontal advection. Structures induced by gravity
waves with vertical wavelengths around 2.4 km (d3 4) and with longer vertical wavelengths (d4) are dominant, respectively,
during summer and winter. The percentage of d3 4 for both seasons reveals that short-scale structures with significant am- plitudes are 1.3 times more numerous during winter. Struc- tures induced by the horizontal advection are twice as more
important during winter independent of the vertical wave- lengths. Those with long vertical wavelengths (d4) are found to be more important. For both seasons, peaks of the frequency of occurrence of laminar structures induced by the horizontal advection are located at 13-15 km in the troposphere. The
frequency of occurrence of detected short-scale structures with
significant amplitudes is limited to 21-km altitude independent of the season and their nature as Reid and Vaughan [1991] and Appenzeller and Holton [1996] have mentioned. This might be explained by the fact that the ozone background is important in
Table 2. Percentage of Soundings With Characteristics of Short-Scale Perturbations Induced by Gravity Waves and Horizontal Advection During Austral Summer and Winter
(September 1992 to December 1998)
Austral Summer Austral Winter
Vertical Wavelength Gravity Horizontal Gravity Horizontal
Bandwidth Waves Advection Waves Advection 1.2-2.4 km 38 25 27 54
(d3)
2.4-4.8 km 31 38 58 73 1.2-4.8 km 44 44 58 73
CHANE-MING ET AL.: VERTICAL SHORT-SCALE STRUCTURES 26,869
the stratosphere together with small values of R(z) at heights above 21 km. As a result, the amplitudes of perturbations are reduced and therefore are not detected. This explanation is supported by the presence of short-scale structures up to 27 km in altitude in both the temperature and the ozone perturba- tions in Plate 4 and Figure 2 (panel 4) which appear to be well
correlated. In addition, short-scale structures with 3-km verti-
cal wavelength were observed to be dominant in the winter middle atmosphere [Chane-Ming et al., 2000]. Grant et al. [1998] reported pronounced gravity wave structures from 1-3 km below the tropopause to 21 km at Hilo station (19.43øN, 155.4øW) throughout most of the year due to deep convection and the jet. As Grant et al. [1998] suggested, the transport barrier above 21 km [Grant et al., 1994] might also be another explanation why detected short-scale structures induced by both gravity and Rossby waves are constrained to the altitudes below 21 km. In our study, possible limits to detecting very short scale laminar structures in the middle stratosphere could also be the filter width used to extract laminar structures (-> 1.2 km and _<4.8 km), the size of the window (3 km) for calculating the coefficients of correlation and the amount of temperature and ECC ozonesonde data (33%) at heights up to 30 km. However, the difficulty in the filtering processes to retrieve correctly the vertical perturbation profiles of temperature and ozone suggests that the occurrence of structures induced by gravity waves is underestimated, whereas that of structures induced by the horizontal advection is overestimated. In addi- tion, the simultaneous presence of both structures at the same altitude range might affect the statistics in the same way.
The seasonal variation of isentropic transport out of tropical stratosphere produced by Waugh [1996] by using contour ad- vection techniques showed that wave-breaking events and strong transport out of the tropics are well correlated with the presence of westerlies throughout the middle latitudes and not necessarily with the movement of the polar vortex. Strong transport out of the tropics in the stratosphere was found when Rossby waves can indeed propagate from the tropopause to the stratosphere during winter. As opposed to the winter pe- riod, transport near the tropopause might be due to evanescing tropospheric disturbances during summer.
6. Summary and Conclusions
In this study, the signature of atmospheric motions on ozone is investigated in the troposphere and the stratosphere at La Reunion Island from ECC ozonesonde data and temperature vertical profiles. A climatology of the dominant wavelike struc- tures with vertical wavelengths less than 7 km for both the perturbations of temperature and ozone was drawn up during austral summer and winter by using of the wavelet techniques.
Multiscaled structures with similar characteristics were ob-
served on both the temperature and the ozone perturbations, such as modes with 2-km wavelength during summer and 3-4-km wavelength during winter in the upper troposphere and stratosphere. From some case studies in summer and win-
ter, the coefficients of correlation, deduced from both the
CWT scalograms of the perturbations of temperature and ozone partial pressure and the MRA details of the normalized perturbations of temperature and ozone, indicated that some observed structures with 1- to 4-km vertical wavelengths could
be attributed to gravity waves or the horizontal advection. In addition, filtering processes were shown to be important in such a study and could cause an underestimation of the occur- rence of short-scale structures induced by gravity waves and, conversely, an overestimation of those induced by the horizon-
tal advection.
The climatology of short-scale structures induced by gravity waves and large-scale advection enabled us to quantify the frequency of occurrence of such structures relative to the tropopause height above La Reunion Island. Laminae induced by gravity waves are observed to be mainly detected in the upper troposphere and the lower stratosphere in summer and from the middle troposphere up to the lower stratosphere in winter with dominant vertical wavelengths of about 2.4 km and 2.4-4.8 km, respectively. The weak value of the vertical gra- dient of the ozone background above 21 km is suggested to be one of major reasons explaining why short-scale structures are not detected in the upper part of the middle stratosphere independent of the season. Finally, the climatology suggested a possible transport of air masses from both sides of the sub- tropical barrier, whose origin depends on the season, and a role of gravity waves in mixing more particularly during the winter period for which short-scale structures induced by both gravity waves and horizontal advection were observed to be
more frequent.
Acknowledgments. This work was financially supported by La Re- gion R6union and CNRS/INSU. The authors are grateful to F. Posny, G. Bain, and J. M. Metzger, and other people in the laboratory who have taken part in acquiring radiosonde data. Additional thanks to two anonymous reviewers who provided constructive and relevant com- ments on the manuscript and also to C. Cardon for the documentation.
References
Allen, S. J., and R. A. Vincent, Gravity wave activity in the lower atmosphere: Seasonal and latitudinal variations, J. Geophys. Res.,
100, 1327-1350, 1995.
Andrews, D. G., J. R. Holton, and C. B. Leovy, Middle Atmosphere Dynamics, Academic, San Diego, Calif., 1987.
Appenzeller, C., and J. R. Holton, Tracer lamination in the strato- sphere--A global climatology, J. Geophys. Res., 102, 13,555-13,659,
1996.
Baldy, S., G. Ancellet, M. Bessaft, D. Lan Sun Luk, and A. Badr, Field observations of the vertical distribution of tropospheric ozone at the island of Reunion (southern tropics), J. Geophys. Res., 101, 23,835-
23,850, 1996.
Bird, J. C., S. R. Pal, A. I. Carswell, D. P. Donavan, G. L. Manney, J. M. Harris, and O. Uchino, Observations of ozone structures in the Arctic polar vortex, J. Geophys. Res., 102, 10,785-10,800, 1997. Chane-Ming, F., F. Molinaro, and J. Leveau, Wavelet techniques ap-
plied to lidar signal in the analysis of the middle atmosphere dy- namics, Appl. Signal Process., 6, 94-104, 1999.
Chane-Ming, F., F. Molinaro, J. Leveau, P. Keckhut, and A. Hau- checorne, Analysis of gravity waves in the tropical middle atmo- sphere with lidar using wavelet techniques, Ann. Geophys., 18, 485-
498, 2000.
Chiu, Y. T., and B. K. Ching, The response of atmospheric and iono- spheric layer structures to gravity waves, Geophys. Res. Lett., 5,
539-542, 1978.
Daubechies, I., Ten lectures on wavelets, in CBMS-NSF Regional Con- ference Series in Applied Mathematics, Soc. for Indust. and Appl.
Math., Philadelphia, Pa., 1992.
Douglass, A. R., and R. B. Rood, Deviation of photochemical infor- mation near 1 mbar from ozone and temperature data, J. Geophys.
Res., 91, 13,153-13,156, 1986.
Eckermann, S., D. E. Gibson-Wilde, and J. T. Bacmeister, Gravity wave perturbations of minor constituents: A parcel advection meth- odology, J. Atmos. Sci., 55, 3521-3539, 1998.
![Table 1. Analogy of Statistics, Fourier Transform, and Wavelet Transform Analysis [after Liu, 1994]](https://thumb-eu.123doks.com/thumbv2/123doknet/14793863.602700/10.912.81.829.116.298/table-analogy-statistics-fourier-transform-wavelet-transform-analysis.webp)