HAL Id: hal-03154960
https://hal.archives-ouvertes.fr/hal-03154960
Submitted on 1 Mar 2021HAL is a multi-disciplinary open access
archive for the deposit and dissemination of sci-entific research documents, whether they are pub-lished or not. The documents may come from teaching and research institutions in France or abroad, or from public or private research centers.
L’archive ouverte pluridisciplinaire HAL, est destinée au dépôt et à la diffusion de documents scientifiques de niveau recherche, publiés ou non, émanant des établissements d’enseignement et de recherche français ou étrangers, des laboratoires publics ou privés.
Fracture processes imaging in concrete using nonlinear
ultrasound
Martin Lott, Marcel Remillieux, Vincent Garnier, T.J. Ulrich, Pierre-Yves Le
Bas, Arnaud Deraemaeker, Cédric Dumoulin, Cédric Payan
To cite this version:
Martin Lott, Marcel Remillieux, Vincent Garnier, T.J. Ulrich, Pierre-Yves Le Bas, et al.. Fracture processes imaging in concrete using nonlinear ultrasound. NDT & E International, Elsevier, 2021, pp.102432. �10.1016/j.ndteint.2021.102432�. �hal-03154960�
Fracture processes imaging in concrete using nonlinear ultrasound
1
Martin Lott1,2, Marcel C. Remillieux3, Vincent Garnier2, T. J. Ulrich4, Pierre-Yves Le Bas4, Arnaud 2
Deraemaeker5, Cédric Dumoulin5, Cédric Payan2 3
1
Université Grenoble Alpes, Université Savoie Mont Blanc, CNRS, IRD, IFSTTAR, ISTerre, 38000 4
Grenoble, France 5
2
Aix Marseille Univ, CNRS, Centrale Marseille, LMA, Marseille, France 6
3
Geophysics Group (EES-17), Los Alamos National Laboratory, Los Alamos, NM, 87545, USA 7
4Detonation Science and Technology Group (Q-6), Los Alamos National Laboratory, Los Alamos,
8
NM, 87545, USA 9
5Université Libre de Bruxelles, BATir Department, F. D. Roosevelt Av 50, 1050 Brussels, Belgium
10 11
Abstract
12
This paper shows the complementarity of two nonlinear ultrasonic imaging methods to characterize 13
closed macro cracks in concrete. A time reversal mirror is used to locally probe and image the 14
nonlinearity of a cracked region. Two nonlinear parameters are extracted to map the cracked region. The 15
image obtained using the first parameter relates the harmonic generation due to the contact and frictional 16
behaviors at the crack lips, correlated with vibro-thermography imaging of the same crack. The image 17
obtained using the second parameter is based on the conditioning of the material induced by distributed 18
micro cracks arising from the fracture process zone. These results show a great potential for 19
characterization of fracture processes in concrete, with the possibility to uncouple the effects of the crack 20
itself from surrounding distributed micro damage. 21
Keywords: Nonlinear ultrasound, Concrete, Cracks, Fracture process zone
22
Highlight:
23
• Nonlinear ultrasound can image and distinguish fracture processes in concrete 24
• Nonlinear responses from the fracture process zone and the crack lips are separated 25
• The results are correlated with vibro-thermography images 26
1. Introduction
27
In civil engineering, increasingly more stringent safety and maintenance requirements have called for 28
more sophisticated detection and imaging NDT tools. This is particularly true in the nuclear-energy 29
industry, in the context of license renewal and need for structural assessment. Ultrasonic assessment of 30
concrete structures has been successfully achieved since 1990’s with the possibility to image complex 31
structures using tomographic approaches [1,2]. Ultrasonic crack-depth estimation in concrete is 32
standardized [3], based on low-frequency (tens of kHz) wave propagation. However, the resolution is 33
limited by the wavelength and only the opened portion of the crack can be detected. More refined 34
methods based on the multiple scattering of higher-frequency waves [4] are more sensitive to the 35
complex morphology of the crack, including partially opened cracks [5]. Nonlinear-ultrasonic-based 36
methods have been proven efficient in detecting many types of damage and pathologies in concrete 37
[6,7,8,9]. Nonlinear ultrasound has also been successfully employed to probe closed cracks [10,11] and 38
exhibited a promising sensitivity. Even if the industrial civil engineering community reveals a growing 39
interest for these methods, nonlinear ultrasonic inspection of concrete has been limited to laboratory 40
studies. 41
So far, ultrasonic imaging of closed cracks remains a challenge. As for characterization, ultrasonic 42
imaging can be achieved [12] but with a sensitivity limited to the large wavelength employed and to the 43
opened portion of the crack. Again, higher frequencies fall in the multiple scattering regime into which 44
standard methods do not apply. Recent research based on higher frequency diffuse waves showed the 45
ability to image macro crack in laboratory samples [13] as well as real structures [14]. However, this 46
approach only applies to image variations, i.e., crack propagation or crack opening due to external 47
loadings, and only image the opened portions of the cracks. 48
The aim of this paper is to investigate the potential of methods based on nonlinear acoustics for closed-49
crack imaging. The imaging method employed here is based on time reversal, which focuses elastic 50
energy at a prescribed location [15]. A study of the amplitude dependence of the elastic response allows 51
then to locally probe the nonlinearity of the medium. Repeating this experiment over a regular grid 52
spanning a region of interest on the surface of the concrete may provide a map of the nonlinearity. Such 53
a method was already applied to probe distributed damage in concrete [16], as well as in other materials 54
such as metals [17]. This paper shows that contact phenomena at the crack lips are well imaged using a 55
method based on harmonic generation. These physical phenomena are also validated using active vibro-56
thermography. The fracture process zone surrounding the main crack lips exhibits micro damage 57
occurring during fracture formation [18]. This zone is also imaged using a time-delay method, similar 58
to the one used in [16]. 59
60
2. Materials and Methods
61
We study a notched rectangular prism of ordinary concrete with dimensions of 10 × 10 × 60 cm3. The 62
composition of the sample is provided in table.1. 63
Table.1. Concrete sample composition 64
CEM I 52.5 N PMES CP2 (Saint Vigor, FR) 340 kg/m3
Sand 0/4 (Bernières, FR) 739 kg/m3
Gravel 8/22 (Bernières, FR) 1072 kg/m3
Total water 184 kg/m3
65
A macro-crack departing from the notch was generated in the sample via a three-point bending test. 66
Photographs of the sample and crack are shown in Figure 1(a,c) as well as the force versus vertical 67
displacement curve recorded during the mechanical test (Fig.1b). 68
In the following, our ultrasonic measurements capitalize on a well-known property of elastic waves to 69
focus a high level of elastic energy in time and space, namely a Time Reversal Mirror (TRM). A 70
description of time reversal and its application to non-destructive testing was given by Anderson et al. 71
[19]. The reciprocal TRM version employed in this study provides an opportunity to focus energy 72
remotely from a set of source transducers. After the forward step has been conducted independently with 73
each of these source transducers, they can be synchronized to emit simultaneously their TR signals and 74
focus elastic wave energy at a point of interest, thus allowing relatively large strain amplitudes to be 75
reached. The large strain amplitude is necessary for the study of nonlinearity while the localized 76
excitation is necessary for imaging application, to probe the nonlinearity of the material locally (e.g., 77
near a crack). 78
The sample was instrumented with 10 piezoelectric disks, which were used as source transducers 79
randomly glued on the six faces of the sample. The piezoelectric disks were made by APC International 80
using material type 855 (Navy VI), had a diameter of 25.4 mm and thickness of 6.3mm. Devcon® 5 81
Minute epoxy was used to bond the transducers to the concrete sample. The source transducers were 82
individually driven with signals generated by 16-bit waveform-generator cards (National Instrument, 83
PXI-5421) and amplified 50 times by power amplifiers (Tabor Electronics, Model 9400). The out-of-84
plane component of the particle velocity was measured on the surface of the sample using a laser Doppler 85
vibrometer (Polytec OFV-303). The laser head was mounted on a moving stage capable of scanning the 86
vibration field on a region of interest. The data measured by this instrument was digitized at a sampling 87
rate of 10 MHz (National Instrument, PXI-4122) with a sensitivity of 5 mm/s/V. The linearity of the 88
setup was checked on a plexiglass sample. 89
In this experiment, the band-limited impulse response between the sources and the receiver (focal point) 90
are obtained using a combination of chirp signals and cross-correlations, to increase the signal-to-noise 91
ratio in the frequency band of interest. The chirp signal used in the forward step had a frequency range 92
of 50 kHz to 150 kHz, which encompasses the operating frequency of the piezoelectric source at 80 93
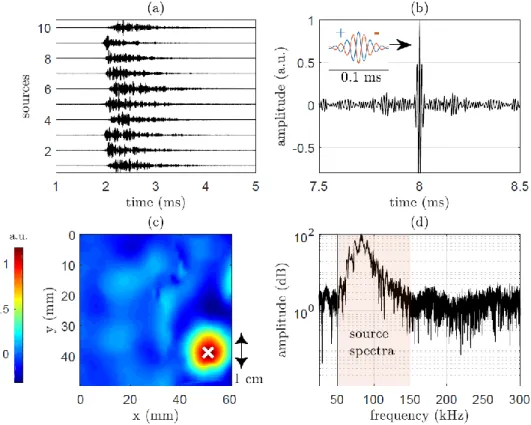
kHz. The full TRM procedure used in this study is gathered in Figure 2. Figure 2a shows the ten forward 94
signals (band-limited impulse responses) obtained independently for the ten source transducers by cross-95
correlation with the laser signal at the focal point. Once reversed in time, the summation of the ten 96
sources give rises to a localized signal in time (Fig 2b) and space (Fig 2c). In Figure 2c, the white cross 97
denotes the point in space where the ten signals in Figure 2a and the time reversed summation is 98
recorded. Theoretically, the full-width half-maximum (FWHM) size of a focal spot is equal to a half 99
wavelength at the center frequency of the pulse [20]. As shown in Figure 2c, the size of the measured 100
focal spot is approximately 1 cm. Considering a center frequency of 100 kHz, we estimate the wave 101
speed to be approximately 2000 m/s, which would correspond to the wave speed of surface waves in 102
concrete [21]. In other words, the focal signal in this particular setup is mainly produced by surface 103
waves. The local (at the focal spot) strain amplitude is approximated as the ratio between the out-of-104
plane particle velocity and the mean wave speed as in [16]. This estimation of the strain amplitude is 105
essential for quantitative nonlinear studies [16,22]. 106
TR-based imaging was performed around the crack and above the notch, within a square region of 60 × 107
60 mm2. The scan grid consisted of 1600 points with a spatial resolution of 1.5 mm. At each scan point,
108
the TR experiment was repeated at 10 amplitudes (before amplification): 5 negative amplitudes 𝑥𝑖−= -109
1V, -0.8V, -0.6V, -0.4V, -0.2V, and 5 positive amplitudes 𝑥𝑖+ = 0.2V, 0.4V, 0.6V, 0.8V, 1V. The phase 110
shift in the amplitude sweep will be useful in the nonlinear analysis. The TR signals obtained at a point 111
of focus on the scanning grid with the 10 source amplitudes are shown in Figure 2a. Two nonlinear 112
parameters are extracted from this set of data: one that is representative of a diffuse damage of the 113
sample [16] and one that is representative of clapping phenomena at the crack lips interface [7,17]. 114
115
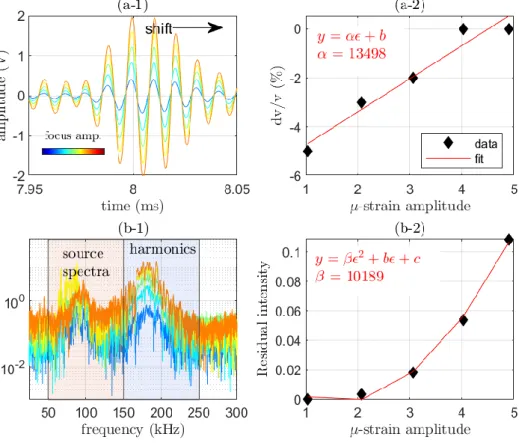
The first parameter is related to the time at which the maximum signal amplitude is achieved at the focal 116
point, which we will refer to as focal time. The signals shown in Figure 3a-1 are used for this analysis. 117
The dependence of the focal time on the vibration amplitude is related to nonclassical nonlinearity and 118
will be described by a parameter α [16]. The focal time at the lowest vibration amplitude of the 119
experiment is used as a linear reference against which the focal times at the larger vibration amplitudes 120
are compared to compute a time delay using cross correlation. The time delay experienced by the focal 121
signal as a function of strain amplitude at this particular focal point is shown in Fig. 3a-2 for the 5 122
positive source amplitudes (from 0.2V to 1V). The slope of the linear fit for this set of time delays is the 123
parameter α used in this analysis. 124
125
The second parameter is estimated using the pulse inversion harmonic processing [23]. In brief, when 126
two waves of equal amplitude but opposite phase propagate in a nonlinear material at a frequency f0, the
127
linear component of the summed waves (spectral content at the fundamental frequency f0) should vanish
128
while some of the nonlinear components (spectral content around the even harmonic frequencies, e.g., 129
2f0) should be doubled. This technique has been amply used to enhance the signal to noise ratio of
130
harmonic imaging in the medical field. The harmonic generation appears in the frequency band 150-131
250kHz, above the sources bandwidth (150kHz) and below the signal to noise ratio (250kHz), depicted 132
with a blue background area in Figure 3b-1. The summed focused signal (𝑥𝑖++𝑥𝑖−) are then filtered in 133
this frequency band (150-250 kHz). The residual intensity is reported to the strain amplitude in Figure 134
3b-2. We observe a quadratic evolution of this parameter with the strain amplitude. The retained value 135
for this nonlinear parameter is the quadratic term 𝛽 of the fitted polynomial. The asymmetry of the 136
focused signals is representative of a difference between pushing and pulling at the surface. It is expected 137
to be sensitive to the crack interface through clapping phenomena [17]. 138
The procedures are repeated for all 1600 points of the scanning grid to provide a map of the nonlinear 139
parameters. The linear and quadratic regression are calculated only for the 5 available strain amplitudes. 140
However, each point results from the combination of two independently ran signals. In addition, the 141
spatial measurement density (1.5 mm2) in view of the mean wavelength (1 cm) allows the spatial 142
smoothing of the obtained images. 143
144
3. Results and discussion
145
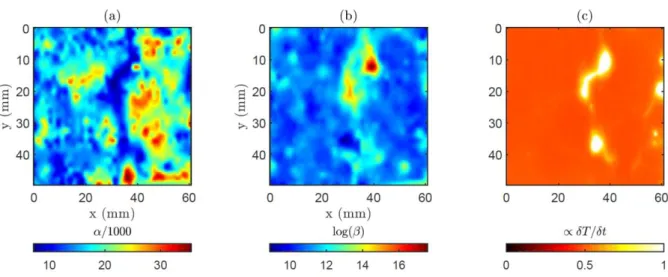
The two images obtained using nonlinear ultrasound are displayed on Figure 4a and 4b respectively for 146
𝛼 and 𝛽 parameters. 147
Fig. 4a reveals several zones surrounding the crack with a higher 𝛼 parameter. In was shown in previous 148
work [16] that this parameter was related to the amount of micro-cracking damage in concrete. The size 149
of the micro-cracked region occurring before coalescence of connected microcracks is known to depend 150
on the size of the aggregates [18]. Our concrete sample being made with 22 mm aggregates, the size of 151
the fracture process zone is expected to scale about 2 cm apart from the crack [18,24]. This corresponds 152
to the extent of the highest 𝛼 values shown in Fig 4b. This map of 𝛼 seems to be a reasonable 153
representation of the fracture process zone [18,25,26]. 154
In Figure 4b, the parameter 𝛽 exhibits a relatively large dynamic range and is thus displayed in log scale 155
for clarity. The highest 𝛽 values are observed along the crack lips and do not overlap with the map of 156
the 𝛼 parameter. We explain the results as follow: some parts of the cracks can be opened and closed by 157
the push-pull induced by the ultrasonic focusing, generating the strong asymmetries in the signals, thus 158
producing a strong residual energy. As a correlation step, a vibro-thermography experiment is carried 159
out using the same sources at the same frequencies. One of the piezoelectric devices is driven at 400Vpp 160
(maximal amplitude reachable by the amplifiers), at the frequency which produces the highest amplitude 161
in the sample (80kHz). The images are recorded using a FLIR SC8200 IR camera. The image is obtained 162
using the protocol described by Remillieux et al. [27] to image cracks in metal. The image (Fig.4c) 163
reveals high intensity spots occurring during wave propagation in the crack region. The apparent 164
correlation of both images in Figures (4b,4c) suggests that both techniques are sensitive to the same 165
physical features of the crack despite the wavelength of the source signal being much larger than those 166 features. 167 168 4. Conclusion 169
This paper demonstrates the ability of nonlinear ultrasonic methods to image macrocrack processes in 170
concrete. The time reversal method employed here allows to image independently the fracture process 171
zone and the crack lips using two physical parameters (α and β) respectively sensitive to the presence of 172
diffused micro-damage and friction/clapping phenomena. The beta mapping is correlated with a vibro-173
thermography image. The alpha mapping reveals a micro-damaged zone corresponding to the size of 174
already observed FPZ in samples with aggregate size of about 20mm. 175
In view of field applications, the method employed here presents the advantage that the location of the 176
sources is not an issue and it does not affect the resolution which is driven by the scan span defined with 177
the laser. However, the main limitation is the surface nature of the measurements even if the information 178
is also related to the penetration depth of the focal still driven by the wavelength. Another limitation of 179
the present experiment is the time needed to perform such a scan (about 80h) even if the spatial 180
resolution could be reduced to meet more realistic industrial conditions. Nonetheless, the main 181
conclusion concerns the ability of the two nonlinear ultrasonic parameters to image and characterize 182
fracture processes in concrete. From a more practical standpoint, recent technological advances using 183
ultrasonic phased arrays in concrete [28] could allow to image a macrocracks in the bulk of concrete 184
using nonlinear phenomenon similarly as nonlinear imaging methods employed in metals [29] in the 185
near future, once high amplitude waves will be available on such equipment. 186
187
Acknowledgments
188
The authors thank the French National research Agency for funding [ANR ENDE 11 RSNR 0009]. 189
References
191 192
[1] O. Büyüköztürk, Imaging of concrete structures, NDT & E Int. 31 (4) (1998) 233-243 193
[2] P. Rivard, G. Ballivy, C. Gravel, F. Saint-Pierre, Monitoring of an hydraulic structure affected by 194
ASR: A case study, Cem. Concr. Res. 40 (4) (2010) 676-680 195
[3] BS 1881: Part 203, Recommendations for measurement of the velocity of ultrasonic pulses in 196
concrete, London, 1986. 197
[4] A. Quiviger, C. Payan, J.F. Chaix, V. Ganier and J. Salin, Effect of the presence and size of a real 198
macro-crack on diffuse ultrasound in concrete, NDT & E Int. 45 (2012) 128-132. 199
[5] A. Quiviger, A. Girard, C. Payan, J.F. Chaix, V. Garnier, J. Salin, Influence of the depth and 200
morphology of real cracks on diffuse ultrasound in concrete: a simulation study, NDT & E Int. 60 (2013) 201
11-16. 202
[6] P. Antonaci, C.L.E. Bruno, A.S. Gliozzi, M. Scalerandi, Monitoring evolution of compressive 203
damage in concrete with linear and nonlinear ultrasonic methods, Cem. Concr. Res. 40 (7) (2010) 1106-204
1113. 205
[7] J. Chen, A.R. Jayapalan, J.Y. Kim, K.E. Kurtis, L.J. Jacobs, Rapid evaluation of alkali–silica 206
reactivity of aggregates using a nonlinear resonance spectroscopy technique, Cem. Concr. Res. 40 207
(2010) 914-923. 208
[8] F. Bouchaala, C. Payan, V. Garnier and J.P. Balayssac, Carbonation Assessment in Concrete by 209
Nonlinear Ultrasound, Cem. Concr. Res. 41 (2011) 557–559. 210
[9] C. Payan, V. Garnier, J. Moysan, Effect of water saturation and porosity on the nonlinear elastic 211
response of concrete, Cem. Concr. Res. 40 (3) (2010) 473-476 212
[10] P. Antonaci, C.L.E. Bruno, P.G. Bocca, M. Scalerandi, A.S. Gliozzi, Nonlinear ultrasonic 213
evaluation of load effects on discontinuities in concrete, Cem. Concr. Res. 40 (2010) 340-346. 214
[11] J.-P. Zardan, C. Payan, V. Garnier and J. Salin, Effect of the presence and size of a localized 215
nonlinear source in concrete, J. Acoust. Soc. Am. 128(2010) EL38-EL42. 216
[12] H. Choi, G. Palacios, J.S. Popovics, and S.H. Chao, Monitoring Damage in Concrete Columns 217
Using Ultrasonic Tomography, ACI Struct. J. (2018) 545-558. 218
[13] E. Larose, A. Obermann, A. Digulescu, T. Planes, J.-F. Chaix, F. Mazerolle, G. Moreau, Locating 219
and characterizing a crack in concrete with diffuse ultrasound: A four-point bending test, J. Acoust. Soc. 220
Am. 138 (2015) 232-241. 221
[14] Y Zhang, E Larose, L Moreau, G d’Ozouville, Three-dimensional in-situ imaging of cracks in 222
concrete using diffuse ultrasound, Struct. Health Monit. 17 (2019) 279-284. 223
[15] Anderson, B.E., Remillieux, M.C., Le Bas, P.-Y. and Ulrich, T.J., 2019. Time reversal techniques. 224
In B. Kundu (Ed), Nonlinear Ultrasonic and Vibro-Acoustical Techniques for Nondestructive 225
Evaluation, 2019, pp. 547-581. 226
[16] C. Payan, T.J. Ulrich, P.Y. Le Bas, M. Griffa, P. Schuetz, M.C. Remillieux, T.A. Saleh, Probing 227
material nonlinearity at various depths by time reversal mirror, App. Phys. Lett. 104 (2014) 144102. 228
[17] T. J. Ulrich, P. A. Johnson, R.A. Guyer, Interaction Dynamics of Elastic Waves with a Complex 229
Nonlinear Scatterer through the Use of a Time Reversal Mirror, Phys. Rev. Lett. 98 (2007) 104301. 230
[18] K. Otsuka, H. Date, Fracture process zone in concrete tension specimen, Eng. Fract. Mech. 65 231
(2000) 111-131. 232
[19] B.E. Anderson, M. Griffa, C. Larmat, T.J. Ulrich, P.A. Johnson, Time reversal. Acoust. Today 233
4(1) (2008) 5–16 234
[20] M.C. Remillieux, B.E. Anderson, T.J. Ulrich, P.Y. Le Bas, C. Payan, Depth profile of a time-235
reversal focus in an elastic solid, Ultrasonics 58 (2015) 60-66. 236
[21] Q.A. Vu, V Garnier, J.F. Chaix, C. Payan, M. Lott, J.N. Eiras, Concrete cover characterisation 237
using dynamic acousto-elastic testing and Rayleigh waves, Constr. Build. Mater. 114 (2016) 87-97. 238
[22] M. Lott, M.C. Remillieux, V Garnier, PY Le Bas, TJ Ulrich, C Payan, Nonlinear elasticity in rocks: 239
A comprehensive three-dimensional description, Phys. Rev. Mat. 1 (2) (2017), 023603. 240
[23] P.N. Burns, D. Hope Simpson, M.A. Averkiou, Nonlinear imaging, Ultrasound in Medicine and 241
Biology (26) (2000), S19 - S22 242
[24] S. Muralidhara, B.R. Prasad, H. Eskandari, B.L. Karihaloo, Fracture process zone size and true 243
fracture energy of concrete using acoustic emission, Constr. Build. Mater. 24(4) (2010), 479-486. 244
[25] D. Zhang, K. Wu, Fracture process zone of notched three-point-bending concrete beams, Cem. 245
Concr. Res. 29 (1999) 1887-1892. 246
[26] H. Mihashi, N. Nomura, S. Niiseki, Influence of aggregate size on fracture process zone of concrete 247
detected with three dimensional acoustic emission technique, Cem. Concr. Res. 21 (5) (1991) 737-744. 248
[27] M.C. Remillieux et al., Detecting and imaging stress corrosion cracking in stainless steel, with 249
application to inspecting storage canisters for spent nuclear fuel, NDT & E Int. 109 (2020) 102180. 250
[28] E. Niederleithinger, S. Maak, F. Mielentz, U.A. Effner, C. Strangfeld, J. Timofeev, Review of 251
recent developments in ultrasonic echo testing of concrete, 5th International Conference on Smart 252
Monitoring, Assessment and Rehabilitation of Civil Structures, August 2019 Potsdam, Germany (2019) 253
[29] Y. Ohara, H. Nakajima, S. Haupert, T. Tsuji, T. Mihara, Nonlinear ultrasonic phased array with 254
fixed-voltage fundamental wave amplitude difference for high-selectivity imaging of closed cracks, J. 255
Acoust. Soc. Am. 146 (2019) 266-277. 256
Figures 257
258
Figure 1. (a) Image of the sample showing where the acoustic scan zone is located. (b) 259
Force/displacement curved recorded during the mechanical test. 1 to 4 symbols represent the times when 260
the notched region was photographed. Corresponding images are shown in (c). 261 262 263 264 265 266 267 268 269
270
Figure 2: Time reversal mirror principle. (a) Ten forward signals sent by the sources. (b) Focused signal 271
in time produced by rebroadcasting the time reversed version of the forward signals. (c) Focal spot in 272
space (white-cross is the point where TRM is applied) recorded at focal time. (d) Frequency content of 273
the focus signal. The input source spectra is highlighted by a red background area. 274
276
Figure 3: Representative results for the extraction of nonlinear parameters. (a) α and (b) β are extracted 277
from the measured focused signal. (a-1) Five positive focused signals. (a-2) Time shift (or Δt/t0) at the
278
focal spot as a function of amplitude (black diamond) with a linear regression (red curve and equation). 279
The color code (blue to red) represents the 5 focused amplitudes. (b-1) Residual spectra for the 280
summation of the five positive and negative signals. The red background area is the linear frequency 281
band (that of the source signal) and the blue background area is the frequency width considered for the 282
harmonic generation measurement. (b-2) Residual intensity into the harmonic frequency band a function 283
of strain amplitude (black diamond) and quadratic regression (red curve and equation). 284
285 286 287 288
289
290
Figure 4: Experimental images of the cracked region. (a) Nonlinear 𝛼 parameter. (b) Harmonic 291
generation (β parameter). (c) Vibro-thermography image: first derivative of the temperature with respect 292
to time (the reader can refer to [23] for more details). 293