HAL Id: hal-02659572
https://hal.inrae.fr/hal-02659572
Submitted on 30 May 2020
HAL is a multi-disciplinary open access
archive for the deposit and dissemination of
sci-entific research documents, whether they are
pub-lished or not. The documents may come from
teaching and research institutions in France or
abroad, or from public or private research centers.
L’archive ouverte pluridisciplinaire HAL, est
destinée au dépôt et à la diffusion de documents
scientifiques de niveau recherche, publiés ou non,
émanant des établissements d’enseignement et de
recherche français ou étrangers, des laboratoires
publics ou privés.
core collection for studying naturally occurring variation
in Medicago truncatula
Joelle Ronfort, Thomas Bataillon, Sylvain Santoni, Magalie Delalande,
Jacques David, Jean-Marie Prosperi
To cite this version:
Joelle Ronfort, Thomas Bataillon, Sylvain Santoni, Magalie Delalande, Jacques David, et al..
Mi-crosatellite diversity and broad scale geographic structure in a model legume: building a set of nested
core collection for studying naturally occurring variation in Medicago truncatula. BMC Plant Biology,
BioMed Central, 2006, 6 (28), 13 p. �10.1186/1471-2229-6-28�. �hal-02659572�
Open Access
Research article
Microsatellite diversity and broad scale geographic structure in a
model legume: building a set of nested core collection for studying
naturally occurring variation in Medicago truncatula
Joëlle Ronfort*
†1, Thomas Bataillon
†1,2, Sylvain Santoni
1,
Magalie Delalande
1, Jacques L David
1and Jean-Marie Prosperi
1Address: 1UMR 1097 « Diversité et Adaptation des Plantes Cultivées », INRA Montpellier, Domaine de Melgueil 34130 Mauguio, France and 2Department of Genetics and Ecology, Bioinformatics Research Center, University of Aarhus, Høgh-Guldbergs Gade 10, Building 1090, DK-8000
Århus C, Denmark
Email: Joëlle Ronfort* - Joelle.Ronfort@ensam.inra.fr; Thomas Bataillon - tbata@daimi.au.dk; Sylvain Santoni - santoni@ensam.inra.fr; Magalie Delalande - Magalie.Delalande@ensam.inra.fr; Jacques L David - Jacques.David@ensam.inra.fr; Jean-Marie Prosperi - jean-marie.prosperi@ensam.inra.fr
* Corresponding author †Equal contributors
Abstract
Background: Exploiting genetic diversity requires previous knowledge of the extent and structure of the variation occurring in a species. Such knowledge can in turn be used to build a core-collection, i.e. a subset of accessions that aim at representing the genetic diversity of this species with a minimum of repetitiveness. We investigate the patterns of genetic diversity and population structure in a collection of 346 inbred lines representing the breadth of naturally occurring diversity in the Legume plant model Medicago truncatula using 13 microsatellite loci distributed throughout the genome.
Results: We confirm the uniqueness of all these genotypes and reveal a large amount of genetic diversity and allelic variation within this autogamous species. Spatial genetic correlation was found only for individuals originating from the same population and between neighbouring populations. Using a model-based clustering algorithm, we identified four main genetic clusters in the set of individuals analyzed. This stratification matches broad geographic regions. We also identified a set of "admixed" individuals that do not fit with this population structure scheme.
Conclusion: The stratification inferred is discussed considering potential historical events like expansion, refuge history and admixture between neighbouring groups. Information on the allelic richness and the inferred population structure are used to build a nested core-collection. The set of inbred lines and the core collections are publicly available and will help coordinating efforts for the study of naturally occurring variation in the growing Medicago truncatula community.
Background
In the last decade, model plants have been the subject of rapid advances in genomics, including the completion of
the sequence of both Arabidopsis thaliana [1] and rice [2,3]. Knowledge gained from these studies and associated tech-nological and methodological progresses create new pros-Published: 13 December 2006
BMC Plant Biology 2006, 6:28 doi:10.1186/1471-2229-6-28
Received: 12 May 2006 Accepted: 13 December 2006 This article is available from: http://www.biomedcentral.com/1471-2229/6/28
© 2006 Ronfort et al; licensee BioMed Central Ltd.
This is an Open Access article distributed under the terms of the Creative Commons Attribution License (http://creativecommons.org/licenses/by/2.0), which permits unrestricted use, distribution, and reproduction in any medium, provided the original work is properly cited.
pects in a variety of biological fields, including functional and evolutionary genetics. This simultaneously renews our interest in naturally occurring variation. Genomic approaches to the study of natural variation should increase our ability to understand gene function [4], while the availability of sequence data from genome-wide marker loci can provide new insights into the major his-torical and selective factors shaping the genetic diversity of a species [5,6]. Such new prospects for plant natural vari-ation will only be met if carefully constructed samples of genotypes are used for characterizing patterns of naturally occurring variation. This revives interest in analyzing material currently available in germplasm collections. Nearly a century has been spent collecting and preserving genetic diversity in plants, resulting in worldwide collec-tions, currently stored in international networks of seed banks [7]. The large size of most of these collections how-ever restricts the characterization of the material available, and hinders their successful use.
To "unlock" the genetic potential of these large collec-tions, a general proposal is to construct smaller "core-col-lections", i.e. sub-samples of accessions chosen to represent the bulk of the genetic diversity contained in the larger collection. Different sampling strategies have been proposed. Genetic markers can be used to characterize the genetic variation present in the collection. Such knowl-edge can lead to significant gains in the number of alleles retained in a sample compared to random sampling. First, the observed DNA profiles can be used to determine the genetic uniqueness of each accession relative to all others and to reduce redundancies in the collection. Second, analysis of single or multilocus genotypes allows infer-ence of genetic ancestry among accessions. A model-based clustering algorithm that identifies groups with distinct allele frequencies [8,9] can then be used to stratify the col-lection into a series of groups, even without prior infor-mation about the sampling locations of individuals. Subsequently, core collections can be established by strat-ified sampling from the different groups [10]. An alterna-tive way to use molecular information for sampling is to use marker gene data as a way to score the allelic richness of a sample. This approach, known as the Maximization strategy, or hereafter M strategy, chooses the specific com-bination of accessions that maximizes the total allelic richness at available marker loci [11]. Simulations showed that the efficiency of this method is expected to increase with increasing selfing rate and reduced gene flow in the studied species [12]. These predictions were recently validated using data from Arabidopsis thaliana and, although the gain in diversity was rather modest [13], the M strategy was used to build a set of nested core collections that can be used as a "gateway" to explore nat-urally occurring diversity in this species.
Medicago truncatula recently emerged as a model species
for the analysis of development during microbial interac-tions and other aspects of legume genetics and genomics [14]. Key attributes of this species include its small, dip-loid genome (~5*108 bp), its self-fertile nature and its
prolific seed production. Researchers are developing tools and methods for molecular and genetic analysis [15], and an international consortium is currently sequencing the "gene space" of Medicago truncatula [16]. Through the use of forward genetic strategies, these resources have already enabled the identification of a number of new genes that participate in the recognition of microbial and mycchori-zal symbionts [17-21]. Until now, most studies in
Medi-cago truncatula have focused on either a single reference
individual or a limited number of populations [22,23], with the exception of one recent study of 192 accessions [24]. In the present paper, we use a set of 13 microsatellite markers to survey the genetic diversity occurring in a sam-ple consisting of 346 inbred lines spanning the bulk of the diversity that has been collected throughout the species range to date (Table 1). First, we aimed to quantify the neutral genetic diversity available in this collection and to test for the presence of an underlying genetic structure in this broad sample. In a second step, results from these analyses are used to generate a set of nested core-collec-tions for Medicago truncatula. This subset of inbred lines represents the bulk of the diversity segregating in M.
trun-catula collected so far and is publicly available. These core
collections will help organize and coordinate current efforts in the Medicago truncatula community to study pat-terns of variation at both the phenotypic and the molecu-lar levels.
Results
Microsatellite diversity
A summary of the microsatellite polymorphism uncov-ered is presented in Table 3. The average number of alleles per locus was NA = 20.7 but dropped to 5.8 when remov-ing rare alleles (i.e. with a frequency lower than 0.05). Averaged over loci, the gene diversity was HE = 0.75 with large variation among loci (SD = 0.30; Table 3). Rare het-erozygote genotypes were found for each of the studied loci (HO > 0) but were dispersed across individuals [see Additional file 5]. Among the 78 pairs of loci, 29 were found to be in significant linkage disequilibrium (Table 4). These pairs involved all the loci studied except the two less variable ones (MTIC126 and MTIC143) which were in linkage equilibrium with all the other loci. Locus MTPG85C contributed to 9 of the 29 statistically associ-ated pairs of loci. Combining data from the 13 microsat-ellite loci, we found 346 different multilocus profiles, thereby confirming the genetic uniqueness of each inbred line in our sample.
Genetic structure of the collection
Spatial autocorrelation analyses conducted over the whole sample revealed a weak signal of isolation by dis-tance. Positive and significant associations between kin-ship coefficients and geographic proximities were found only for individuals originating from the same location (collected in the same natural population) and between neighbouring populations. Similar analyses were con-ducted within two well-represented geographic regions: Spain and Algeria. Kinship coefficients were of the same order of magnitude and we did not find any clear evidence for isolation by distance even at this restricted spatial scale (data not shown).
We tested for the existence of a broad genetic stratification in our sample, consisting in K underlying genetically diverged groups (hereafter clusters), using microsatellite data and the model based clustering algorithm imple-mented in the software Structure (see methods section for details). To do so, we built a subsample of 266 accessions representing each sampled location by a single (randomly chosen) inbred line. Despite its smaller size compared to the initial sample, this subset exhibited similar levels of genetic diversity: mean NA = 19.8, mean HE = 0.75 (SD =
0.30). The pattern of linkage disequilibrium among loci was also conserved, with 22 out of 66 possible pairs of loci showing statistically significant associations (compared to 29 out of 78 pairs in the whole data set). Inspecting the gain in likelihood of the data (n = 266) when modeling the data using an increasing number of underlying clus-ters (from K = 1 to K = 8) yielded clear support for the existence of a genetic structure in our sample. Consistent estimates of Log Likelihood of the data across independ-ent runs were obtained, with a slight variation between runs for K = 5. Posterior probabilities of the data always increased with increasing subdivision; the highest gain occurred between K = 1 and K = 2 and we found an incon-spicuous plateau between K = 4 and K = 5 [see Additional file 2]. Independent runs produced highly consistent results for all K values except for K = 3 and K = 8 which yielded more than 30 inbred lines displaying inconsistent assignation between runs (this was found in less than 10 cases for all the other investigated K values).
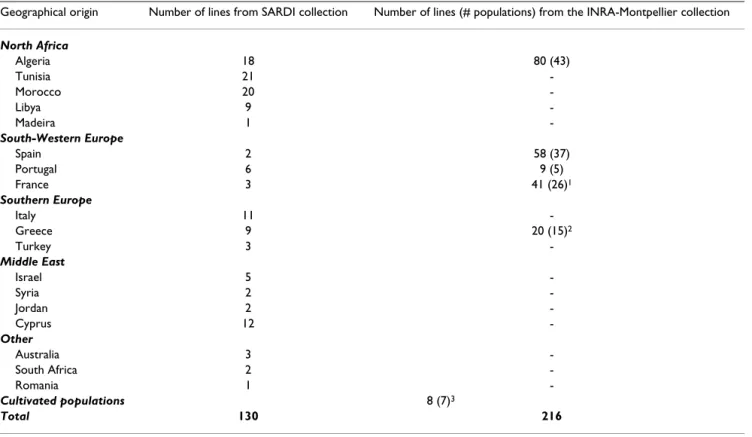
At K = 2, the inferred structure was totally stable across runs and geographically consistent, isolating a set of 78 accessions originating from the South of Spain and from Morocco (Figure 1a). This stratification accounted for Table 1: Geographical origin of the 346 M truncatula inbred lines used
Geographical origin Number of lines from SARDI collection Number of lines (# populations) from the INRA-Montpellier collection
North Africa Algeria 18 80 (43) Tunisia 21 -Morocco 20 -Libya 9 -Madeira 1 -South-Western Europe Spain 2 58 (37) Portugal 6 9 (5) France 3 41 (26)1 Southern Europe Italy 11 -Greece 9 20 (15)2 Turkey 3 -Middle East Israel 5 -Syria 2 -Jordan 2 -Cyprus 12 -Other Australia 3 -South Africa 2 -Romania 1 -Cultivated populations 8 (7)3 Total 130 216
Populations from the SARDI (AMGRC) collection were represented by a single individual.
1 among these 26 populations, 14 were collected in Corsica. 2 among these 15 populations 4 were collected in Crete.
3 the cultivated populations are: Borung, Caliph, Cyprus, Jemalong, Mogul, Paraggio and Sephi (we used 1 line per population except for Cyprus
6.5% (FST = 0.065, p < 0.001) of the total genetic variance.
At K = 3, independent runs were less consistent, splitting roughly the largest cluster obtained at K = 2 in two groups, one being mainly represented by Algerian accessions. At K = 4, approximately 65% of the accessions showed a pro-portion of membership higher than 0.6 into a group. Plot-ting these "well-assigned" accessions on a geographic map showed that the clusters corresponded largely to major geographic regions (Figure 1b). One cluster corresponded to the cluster already observed at K = 2, i.e. grouping pop-ulations from Spain and Morocco (referred as cluster 2 hereafter). Another cluster consisted largely of individuals collected in the South of France (hereafter cluster 4) while the two last groups distinguished the North-Eastern (clus-ter 1) and the South-Eas(clus-tern of the Medi(clus-terranean Basin (cluster 3, see figure 1b). Plotting accessions with low par-tial membership (maximal proportion of membership into a group lower than 0.6) blurred this geographic strat-ification (Figure 1c).
For K > 4, each increase in K split one of the clusters obtained at previous K values. However, although the posterior probability of the data slightly increased with increasing K value, the mean proportion of membership into the inferred clusters jointly decreased, with more and
more accessions showing a maximum membership into a group lower than 0.6. This result combined with the pla-teau observed at K = 4 lead us to consider that the stratifi-cation observed at K = 4 was probably the most genuine one. The highest probability run observed at K = 4 was consequently used to define the different clusters. Finally, re-running the clustering procedure on the 346 accessions and using the predefined population structure as 'prior information', we assigned the 80 supplementary acces-sions into these four clusters [see Additional file 3]. Although most of these accessions showed partial mem-bership in multiple clusters, 50 out of the 80 accessions were assigned to the same cluster as other accessions orig-inating from the same population. After this last step, the four clusters inferred were composed of respectively 83, 99, 114 and 50 accessions. The cultivars Cyprus, Caliph and Paraggio were assigned to the North-Eastern group (in red Figure 1c). Cultivars Borung, Mogul and Sephi were assigned to the South-Eastern group (in yellow, Fig-ure 1c) while Jemalong was assigned to the Spanish-Moroccan group (in blue, Figure 1c).
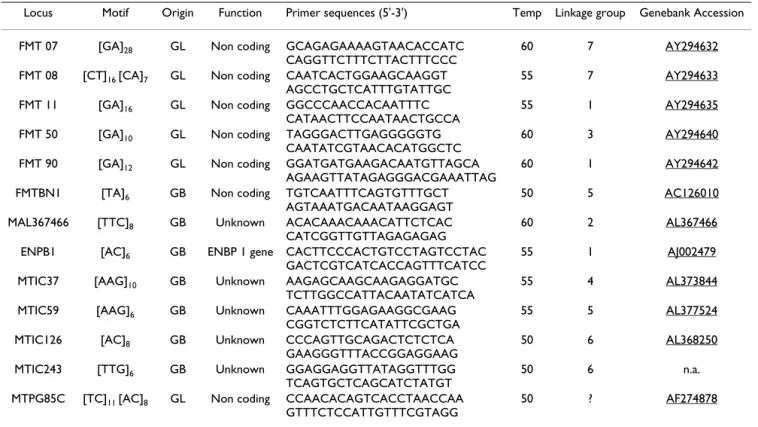
Analyzing patterns of genetic diversity within this stratifi-cation showed that the levels of genetic diversity is rela-tively homogeneous across clusters, each group exhibiting Table 2: Primers and characteristics of microsatellites loci.
Locus Motif Origin Function Primer sequences (5'-3') Temp Linkage group Genebank Accession FMT 07 [GA]28 GL Non coding GCAGAGAAAAGTAACACCATC
CAGGTTCTTTCTTACTTTCCC
60 7 AY294632
FMT 08 [CT]16 [CA]7 GL Non coding CAATCACTGGAAGCAAGGT AGCCTGCTCATTTGTATTGC
55 7 AY294633
FMT 11 [GA]16 GL Non coding GGCCCAACCACAATTTC CATAACTTCCAATAACTGCCA
55 1 AY294635
FMT 50 [GA]10 GL Non coding TAGGGACTTGAGGGGGTG
CAATATCGTAACACATGGCTC
60 3 AY294640
FMT 90 [GA]12 GL Non coding GGATGATGAAGACAATGTTAGCA
AGAAGTTATAGAGGGACGAAATTAG
60 1 AY294642
FMTBN1 [TA]6 GB Non coding TGTCAATTTCAGTGTTTGCT AGTAAATGACAATAAGGAGT
50 5 AC126010
MAL367466 [TTC]8 GB Unknown ACACAAACAAACATTCTCAC CATCGGTTGTTAGAGAGAG
60 2 AL367466
ENPB1 [AC]6 GB ENBP 1 gene CACTTCCCACTGTCCTAGTCCTAC
GACTCGTCATCACCAGTTTCATCC
55 1 AJ002479
MTIC37 [AAG]10 GB Unknown AAGAGCAAGCAAGAGGATGC
TCTTGGCCATTACAATATCATCA
55 4 AL373844
MTIC59 [AAG]6 GB Unknown CAAATTTGGAGAAGGCGAAG CGGTCTCTTCATATTCGCTGA
55 5 AL377524
MTIC126 [AC]8 GB Unknown CCCAGTTGCAGACTCTCTCA GAAGGGTTTACCGGAGGAAG
50 6 AL368250
MTIC243 [TTG]6 GB Unknown GGAGGAGGTTATAGGTTTGG
TCAGTGCTCAGCATCTATGT
50 6 n.a.
MTPG85C [TC]11 [AC]8 GL Non coding CCAACACAGTCACCTAACCAA
GTTTCTCCATTGTTTCGTAGG
50 ? AF274878
Microsatellite motif was determined based on the sequence of a cloned allele. Microsatellite loci were obtained from microsatellite-enriched genomic libraries (GL) or using sequence information retrieved from GenBank (GB).
Temp: optimal annealing temperature for the PCR amplification n.a. non available
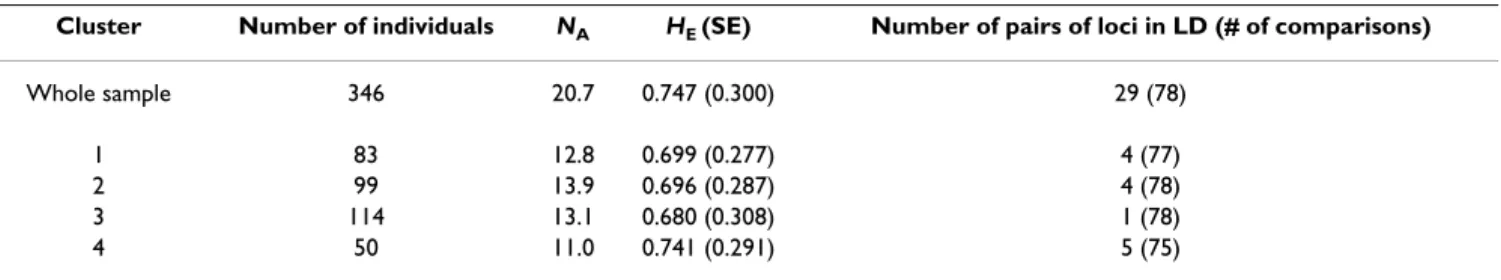
approximately the same level of genetic variation, as measured by HE or NA (Table 4). Compared to the whole sample, the four clusters showed lower proportions of sig-nificant pairwise linkage disequilibrium, with a maxi-mum of 5 pairs of loci in LD for the smaller group (i.e. cluster 4 mainly composed of French accessions). Between clusters pairwise FST estimates varied between 0.05 and 0.10, the largest FST values were found in all pair-wise comparisons involving cluster 2 (i.e. the Spain-Morocco group); the lowest values being observed between the Northern and the Southern clusters (Table 5).
Sampling of core-collections
We first studied the performance of two marker based strategies; the M and the H strategies (see Methods for details) to build core collections by sampling our total data set of 346 genetically unique inbred lines. The per-formance of these two sampling strategies for assembling core collection was studied over a range of putative core collection (sample) sizes. For each sample size, the per-formance of each strategy (M, H) was compared to a pure random strategy by comparing the average score of 30–
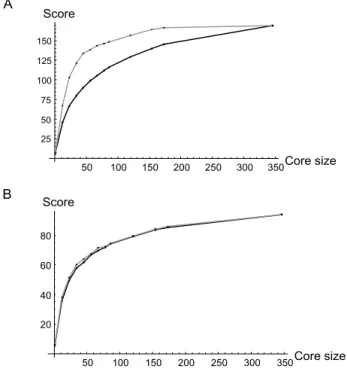
100 core collections sampled independently. When eval-uating the M strategy, we used 6 loci as markers to imple-ment the M strategy and we used the remaining 7 loci as targets to cross validate the efficacy of the M strategy. Such procedure allowed us to test whether the M strategy can assemble core collection displaying high allelic diversity not only at the set of markers used to implement it but also throughout the genome. Not surprisingly the score of core collections built using the M strategy was much better than pure random sampling when considering marker loci only (Figure 2a). However, when considering a set of 7 loci not used by the M strategy, the score of core collec-tions built by the M strategy was only slightly better than the score of core collections sampled purely at random (Figure 2b). This finding suggests that relatively modest gains in allelic diversity are to be expected when building core collection using the M strategy relative to a pure ran-dom sampling of the collection. Similarly we compared the score of core collections built using the H strategy with purely random core collection of the same size. The aver-age score of the H strategy was consistently better than a Table 3: Summary of microsatellite diversity detected in the collection.
Microsatellite marker Na Na, p HE HO
FMT11 18 11 0.925 0.036 FMT90 22 8 0.916 0.020 ENPB1 20 8 0.877 0.043 FMT50 29 5 0.866 0.042 MTIC37 16 4 0.825 0.045 MTIC59 26 7 0.893 0.047 FMTBN1 53 5 0.964 0.020 MTIC243 5 2 0.191 0.009 MTIC126 3 1 0.073 0.003 FMT08C 23 7 0.911 0.023 FMT07 31 8 0.928 0.012 MTPG85C 16 7 0.853 0.006 MAL367466 7 3 0.489 0.017 Mean (SD) 20.7 5.8 0.747 (0.298) 0.025 (0.016)
Number of allele per locus (Na), number of alleles with a frequency higher than 5% (Na, p), expected (HE) and observed (HO) heterozygosity revealed in the whole collection (n = 346) for 13 microsatellite loci.
Table 4: Allelic diversity and proportion of loci in linkage disequilibrium in the four clusters inferred using Structure (n = 346). Cluster Number of individuals NA HE (SE) Number of pairs of loci in LD (# of comparisons)
Whole sample 346 20.7 0.747 (0.300) 29 (78)
1 83 12.8 0.699 (0.277) 4 (77)
2 99 13.9 0.696 (0.287) 4 (78)
3 114 13.1 0.680 (0.308) 1 (78)
4 50 11.0 0.741 (0.291) 5 (75)
Clusters 1 to 4 refer respectively to red, blue, yellow and green symbols in Figure 1.
Geographical distribution of individuals comprising the groups inferred using microsatellite polymorphism
Figure 1
Geographical distribution of individuals comprising the groups inferred using microsatellite polymorphism. The stratification of the collection obtained assuming K = 2 (A), or K = 4, plotting only accessions assigned with a high member-ship into a group, p > 0.6, (B), or plotting all the individuals (C). We used the output yielding the highest posterior probability to assign each genotype to a group.
A
B
pure random sampling but the difference in score was nevertheless very small (Figure 3).
A set of nested core collections were assembled to repre-sent the bulk of the diversity contained in our collection of 346 genotypes. These core collections were composed
of 8, 16, 32, 64, 96 individuals and are denoted as CC8, CC16, ..., CC96 [see Additional file 4]. Given the perform-ances of the M and the H strategies, we finally used a "hybrid/mixed" strategy to assemble these collections. For each core size, we gave equal weight to each of the four clusters uncovered in the structure analysis. Within each cluster, we used the M strategy to build a core collection of c individuals. Given that a number of important inbred lines (used as parents for mapping populations) were found in all four clusters inferred when stratifying our col-lection in K = 4 groups, we chose to retain these 8 geno-types as our starting CC8 collection. For all subsequent core collections (CC16, CC32, etc.), the M strategy was implemented within each of the four groups and con-strained to include the individuals comprising the "previ-ous" core collections. This yielded a set of nested core collections whose detailed composition is provided to help design further studies [see Additional file 4]. The allelic richness of each core collection is displayed Figure 3.
Discussion
Microsatellite variation in Medicago truncatula
Surveying a worldwide collection of individuals for a set of 13 microsatellite loci distributed throughout the genome, we revealed a large amount of genetic variability in Medicago truncatula. This result was expected consider-ing the samplconsider-ing scale and the class of markers we used. Microsatellite markers are known to display high muta-tion rates, and are thus expected to reveal fairly high amounts of polymorphisms especially when used at the species level [25]. We found however a large variation among loci for both the gene diversity (He) and the allelic numbers, with two loci exhibiting less than 6 alleles over the whole sample. Comparisons with other annual selfing plant species are not straightforward as we used a large sample size spanning a wide geographic range. A survey of
Arabidopsis thaliana conducted at a broad geographic scale
over 71 individuals reported a similar range of values for
HE (9 loci, 0.79–0.96) [26]. This range is similar to the range found here when excluding the three loci exhibiting markedly reduced levels of polymorphism (MTIC126, MTIC243 and MAL367466). MTIC126 and MTIC243 were based on EST sequences. This could explain their lower polymorphism compared to other loci located in less constrained intergenic regions
Comparison of the efficiency of random and "M" sampling strategies
Figure 2
Comparison of the efficiency of random and "M" sampling strategies. (A) The score, calculated as the number of alleles captured in each core collection summed over 6 loci chosen as marker loci, of a pure random strategy (black) and the M strategy (grey) are compared for various Core (collection) sizes. For each core size, the score of each method reported here is an average over 30 independent core collections. (B) The score, calculated as the number of alleles captured in each core collection summed over 7 loci chosen as target loci, of a pure random strategy (black) and the M strategy (grey) are compared for various Core (collec-tion) sizes. For each core size, the score of each method reported here is an average over 30 independent sampled core collections. See methods for details about the imple-mentation of each sampling strategy.
A B 50 100 150 200 250 300 350Core size 25 50 75 100 125 150 Score 50 100 150 200 250 300 350Core size 20 40 60 80 Score
Table 5: Between cluster differentiation (FST) obtained at K = 4 (n = 346).
Cluster 2 Cluster 3 Cluster 4
Cluster 1 0.094 0.054 0.083
Cluster 2 0.094 0.102
Cluster 3 0.077
Multilocus level analyses revealed no redundancy within the collection, so we used all the individuals for further analyses. The sample we used spans different spatial scales: the population level, different geographical regions and the whole species. A hierarchical analysis would thus appear appropriate to determine how genetic diversity is organized within and between populations. Such an anal-ysis was however not suitable because the within popula-tion sampling scheme was not random: sampling was based on prior information on allozyme genotypes and was performed to maximize the within population diver-sity. In Medicago truncatula, the fine-scale population structure has already been documented. From these stud-ies, we know that within population diversity in Medicago
truncatula is highly variable among populations (mean HE
ranging from 0.10 to 0.24 using RAPD markers [27] and reaching values as high as HE = 0.48 when using microsat-ellite markers [23]).
Previous hierarchical population genetic analyses also revealed that pairs of populations are highly differentiated even at a small spatial scale (FST values as high as 0.39 are observed between populations located 30 meters apart, [23]). In accordance with these results, the present study
was able to demonstrate a spatial genetic correlation only for individuals originating from the same population or from very adjacent populations. The occurrence of spatial correlation over short distances can be interpreted as the result of current low distance migration/drift processes. For a selfing species, most dispersion should occur through seed dispersal. In Medicago truncatula, short dis-tance seed dispersal can occur (JR, pers. observation) but the fruits bear spikes which facilitate dispersal by animals (grazing mammals) potentially over longer distances. Moreover, M. truncatula is often confined to marginal agri-cultural habitats, and thus undergo rapid population turnover. This type of so called metapopulation dynamics is expected to increase genetic drift at the population level. These factors are expected to generate highly differentiated populations with neighbouring locations showing as much differentiation as much more distant one as we observed here. This configuration, combined with the sampling scheme adopted in our survey, could also explain the low level of linkage disequilibrium observed in the whole sample [28,29]. Ostrowski and collaborators [26] also recently reported a similar finding in a broad sample of Arabidopsis thaliana accessions.
Inferred population structure in Medicago truncatula
Although we could not find isolation by distance over large geographic distances, the model-based clustering algorithm we used revealed patterns of population struc-ture that were roughly consistent with the geographic ori-gin of the accessions. This consistency was striking when considering accessions with a high proportion of mem-bership in one of the inferred clusters. Accessions with partial membership (highest membership <0.6) shuffled the tight correspondence between genetic ancestry and regional affiliation. These accessions represented roughly 30% of the sample, and probably signed recent events of gene-flow between neighbouring groups or a mixture of large distance dispersal and recombination events. The population structure inferred at K = 4 was retained as the most consistent stratification because high proportions of individuals with partial membership (<0.6) were found for higher K values [see Additional file 3]. This stratifica-tion accounted for 8% of the microsatellite genetic varia-tion observed over the whole sample, and, as expected from the clustering algorithm we used, the within cluster levels of linkage disequilibrium were low compared to the whole sample. We note that caution must be exerted when interpreting the biological significance of this strat-ification. In particular the number of inferred clusters should not be taken at face value as it reflects the underly-ing true genetic structure, which may be discrete or contin-uous, its sampling and the amount of marker information available for inference [30]. With that in mind, we discuss below the most salient features of the structure we uncov-ered.
Comparison of the efficiency of random and stratified sam-pling strategies
Figure 3
Comparison of the efficiency of random and strati-fied sampling strategies. The scores, the number of alle-les captured in each core collection summed over the 13 loci used in this study, of a pure random strategy (black) and a stratified random strategy (grey) are compared for various Core (collection) sizes. For each core size, the score of each method reported here is an average over a hundred inde-pendent core collections. The score of the set nested core collections retained to represent the diversity of our
Medi-cago truncatula collection (CC8 to CC96) are represented by
grey circles. 20 40 60 80 100 120 140 Core size 75 100 125 150 175 200 225 Score CC8 CC16 CC32 CC64 CC96
The cluster showing the highest geographic consistency corresponded to a restricted geographic area: the Iberian Peninsula and Morocco. Interestingly, this cluster was already identified at K = 2 and subsequently displayed the highest level of differentiation with the three other clus-ters (at K = 4). This cluster was also clearly differentiated from both France and Algeria. Together, these results pro-vide compelling support for the previous hypothesis of a refuge during glacial cycles in this region [31]. Iberia has been shown to be one of the three main European refugia for most plant species along with Italy and the Balkans [32-34]. For the remaining accessions, the stratification uncovered at K = 4 clearly distinguished the North and the South of the Mediterranean basin. This result suggests a colonization of the Mediterranean via two routes from an initial area located around the Middle East. The low level of differentiation observed between these two groups (Northern Mediterranean vs. Southern Mediterranean) however can also be interpreted as the result of a recent expansion of the species around the Mediterranean.
Performance of core collection sampling strategies
When benchmarking the H and M strategies against a pure random strategy, we found very little gain when scoring genetic diversity at loci not involved in the sampling (Fig-ure 2b and Fig(Fig-ure 3). This suggests that the H and M strat-egies are not very likely to perform better than a pure random sampling. This finding may be surprising given that the mating system of M. truncatula (high levels of self-ing) and the patterns of regional subdivision uncovered in our sample are factors that a priori favor marker assisted sampling strategies over pure random sampling to capture efficiently variation [12]. One particular property of our sample may however explain this finding. The set of inbred lines to which we applied these sampling strategies were highly non redundant to start with. In fact, for all populations coming from the INRA collection that make up 2/3 of our sample, the strategy used to extract inbred lines from populations did take into account the amount of polymorphism detected within populations. This strat-egy ensured for instance that populations which displayed relatively higher levels of variation were represented by more inbred lines (up to 8 inbred lines were extracted per population) than populations found to be monomor-phic. Thus the initial absence of redundancy in our sam-ple of 346 inbred lines (all being genetically unique) together with overall low levels of linkage disequilibrium may leave little room for the optimized sampling of vari-ation and may explain the poor gains of marker-assisted sampling strategies (H and M) over pure random sam-pling. Another possibility is that more markers or markers with lower mutation rates may be needed to efficiently "tag" the genome. McKhann et al [13], using only 10 gene anchored fragments (of about 600 pb) and SNP variation present within those fragments to guide sampling
observed some modest gain (~10%) of the M strategy over a pure random strategy.
Conclusion
We have extracted 346 genetically unique inbred lines from a large set of sampling locations representing the extent of natural variation collected to date throughout the species range of Medicago truncatula. These inbred lines, a publicly available resource for the Medicago com-munity, were genotyped at 13 microsatellite loci. We used patterns of microsatellite diversity to uncover the presence of a broad scale genetic structure in M. truncatula. This stratification, the presence of 4 genetically diverged groups which were inferred solely on the basis of marker data, was found a posteriori to be consistent with the geo-graphical origin of genotypes. Pattern of microsatellite diversity and genetic structure in Medicago truncatula were used to obtain some insight into the demographic history of this species and to build a set of nested core collection representing the breadth of naturally occurring genetic variation. These, nested core collections can be used as a standardized panel for coordinating efforts aimed at in depth characterization of phenotypic variation and effi-cient SNPs discovery in Medicago truncatula. As such these nested core collections will be a pivotal resource for func-tional and evolutionary genomics studies in the growing
Medicago truncatula community. Future work will
docu-ment the extent of genetic divergence existing between this genepool, the related sub species M. truncatula ssp
tri-cycla and the sister species Medicago littoralis. This will
yield a clearer picture of the phylogenetic relationships between these taxa and will allow identifying a set of accessions complementing our nested core collections.
Methods
Plant material
Medicago truncatula is native to the Mediterranean and has
become naturalized in other regions of the world follow-ing European migrations. In Australia, it is used as a forage crop and soil improver. M. truncatula has been split into three subspecies mainly on the basis of pod characteris-tics: ssp truncatula, ssp tricycla and ssp longeaculata. Previ-ous molecular analyses demonstrated that individuals from the subspecies tricycla are genetically differentiated from the two other subspecies [24,35]. To avoid genetic stratification at the sub-species genetic subdivision con-flicting with patterns of regional subdivision (see below), we did not include M truncatula ssp tricycla accessions in our sample.
We used the French Medicago truncatula collection main-tained in Montpellier. For Medicago truncatula sensu lato (i.e. including M. truncatula ssp tricycla), this collection consists of a set of 350 natural populations collected by the laboratory in different countries around the
Mediter-ranean basin (France, Spain, Portugal, Algeria, Greece, Crete) and a set of 231 introductions provided by the Aus-tralian Medicago Genetic Resources Center (AMGRC) maintained by the South Australian Research and Devel-opment Institute (SARDI, Adelaide, Australia). The set of natural populations collected by our laboratory was previ-ously screened using isoenzymatic markers: for each pop-ulation, 11 individuals were genotyped (J-M. Prosperi, unpublished data). These data were used to sample differ-ent individuals from local populations, ensuring that these individuals were genetically distinct and not mere sibs. Following this procedure, 1 to 8 different individuals were sampled in each population and selfed for two suc-cessive generations to obtain inbred lines. For the set of populations obtained from the AMGRC, a single individ-ual was randomly chosen for each accession number and selfed for two consecutive generations. For the present study, 338 inbred lines were chosen in this material in order to span the range of eco-geographical distribution of
Medicago truncatula (excluding ssp tricycla) and to
repre-sent different units of spatial structure: population, regions and the whole species. We only consider inbred lines originating from accessions for which we knew at least the precise geographical location. A set of 8 inbred lines representing cultivated populations (hereafter culti-vars) was added to the sample, bringing the sample size to 346 (Table 1). A detailed list of the 346 accessions and eco-geographical data are available [see Additional file 1]. Taxonomically speaking, all these 346 accessions come from two closely related subspecies: M. truncatula ssp
longeaculata and M. truncatula ssp truncatula.
Microsatellite genotyping
DNA was extracted from 100 mg of frozen leaves accord-ing to the DNeasy Plant Mini Kit (Qiagen). Thirteen mic-rosatellite loci were used for genotyping (Table 2). Six of them have been described previously (AY294632, AY294633, AY294635, AY294640, AY294642, AF274878) [35]. Seven new loci were developed for this study from published sequences (Huguet, pers. com. and Santoni, unpublished results). To do so, Medicago
truncat-ula sequences were retrieved from the GenBank database
and searched for SSR motifs (dinucleotide and trinucle-otide) using the FINDPATTERNS program of the GCG Wisconsin Package (Genetics Computer Group).
Amplification reactions were performed in a final volume of 20 μl in the presence of 20 ng of template DNA, 4 pmol of the reverse primer and 1 pmol of the forward primer, 0.2 mM of each deoxynucleotide, 2 mM MgCl2, and 0.5 unit Taq polymerase (Sigma). The forward primer was 5'-labeled with one of the three fluorophores (6FAM, NED or HEX). PCR was carried out using a PTC 100 thermocy-cler (MJ Research). After 5 min at 94°, 30 cycles were per-formed with 30 s at 94°C, 30 s at either 50, 55 or 60°C
(depending on the locus), and 30 s at 72°C, followed by final extension step of 5 min at 72°C. Amplified products were detected on an ABI prism 3100 Genetic Analyser. Samples were prepared by adding 3 μl of diluted PCR products to 6.875 μl formamide and 0.125 μl GenSize 400 HD Rox. Analyses were performed using the GeneS-can 3.1 and Genotyper 2.5 softwares (Applied Biosys-tems).
Analyses of microsatellite diversity were conducted at the locus level. For each locus, we estimated the number of alleles (NA), allelic frequencies, the observed (HO) and
expected (Nei's diversity, hereafter HE) heterozygosities using Genetix version 4.04 [36]. Statistical associations among loci (linkage disequilibrium) were tested through Fisher's exact tests using the package GENEPOP version 3.3 [37], and corrected for multiple testing was done using a sequential Bonferroni procedure. To determine the genetic uniqueness of each accession and to quantify redundancy, the multilocus DNA profile of all the inbred lines were compared by pairs.
Inference of population structure
Spatial autocorrelation analyses were conducted using SPAGeDI (version 1.1) [38] which calculates conditional kinship coefficients for all pairs of individuals at various geographical distances (each inbred line being assigned the geographical coordinate of the original site of collec-tion). To test whether the degree of relatedness between individuals depends on the geographical distance, we used a procedure implemented in SPAGeDI which per-forms permutations of individual locations to determine the relationship between genetic ancestry and spatial dis-tance expected under the null hypothesis of no isolation by distance.
To infer population structure in this broad sample, we used a model-based clustering algorithm implemented in the computer program Structure version 2 [8,9]. This algo-rithm uses multilocus genotype to identify a predeter-mined number (K) of clusters that have distinctive allele frequencies and assigns portions of individual genomes to these clusters. Since Medicago truncatula is an autogamous species (and thus largely homozygous), we used a haploid setting. In the sample scored for microsatellite markers, some populations were represented by more than one inbred line. Because this sampling scheme appears inap-propriate regarding the modeling assumptions of Struc-ture [30] we investigated the population strucStruc-ture of our sample in two successive steps. In a first step, we built a new sample drawing at random a single individual in each local population (which resulted in a sub-sample of 266 individuals, see result section). Following [9], we used the "admixture model" assuming "no correlation among allele frequencies". For each run, we used a burn-in period
of 105 MCMC iterations and then 106 iterations for
esti-mating the parameters. Five runs were considered for each
K value (K is the number of clusters to be inferred), for K
ranging from 1 to 8 [see Additional file 2]. For each run output, individual accessions were assigned into a group according to their highest proportion of membership into this group.
The clusters thus defined were compared among runs for each K value. The choice of the appropriate K value was conducted as recommended by the authors of Struc-ture[8]. For each K value, we first verified that individual proportions of membership into a group were different from 1/K. We also evaluated the stability of the groups' composition between different runs at each K value. When these conditions were met, we analysed the behav-iour of the Log Likelihood of the data as a function of K, looking for either a maximum value or a more or less pla-teau for increasing K. The lower value of K showing such behaviour was considered as representative of the most genuine stratification. For this K value, we chose the run yielding the highest probability of the data and assigned each individual into the cluster in which it has the highest fraction of its genome. This stratification was used in a sec-ond step to assign the remaining individuals (those removed from the first sample) to the K inferred groups. To do this, we ran Structure on the whole data set (n = 346), using the 'prior information model'. Here, the clus-tering inferred in the previous stage was used as "prior information"; Structure was then able to assign the remaining individuals to the K previously defined groups, on the basis of their microsatellite genotype.
To measure the fraction of the observed genetic variation explained by the inferred clusters, we used the parameter
FST, widely used to estimate the between populations component of variation [39] in population structure anal-yses. Pairwise FST were computed on the inferred stratifica-tion, using the software GENETIX. The statistical significance of these FST values was tested through 1000 permutations of individuals across groups. Statistical associations between loci were tested within each cluster through Fisher's exact tests using Genepop version 3.3 [37].
Core collection sampling
We studied the performance of two different sampling methods using marker information to generate core col-lections: the Maximization, hereafter M strategy [11] and a stratified sampling, hereafter H, strategy (see below). Both the M and the H strategies use information brought by m marker loci. We define the score of a core collection as the number of alleles summed over the m microsatellite loci. The M strategy consists in searching through the (vast) space of all potential core collections of a given size (in number of individuals) that can be formed from the
collection of 346 genotypes included in that study and retains the core collection(s) that exhibit the highest score. To implement the M strategy, we used the heuristic algorithm [40] implemented in the publicly available MSTRAT software, version 4.1 [41].
As an alternative way of using molecular information, the
H strategy assumes that the collection has been previously
clustered in K groups (see section above for the descrip-tion of the clustering method we used). Each group i (i = 1, .., K) is characterized by its mean genetic diversity qi. Various parameters can be used to characterize the genetic diversity of a group, but following Schoen and Brown (1993) we used Nei's diversity (HE). Building a core col-lection of size c (in number of individuals) under the H strategy consists in sampling at random ci = c qi/Q individ-uals (i = 1, ..., K), where Q = ∑i qi (i = 1, ..., K), in each group. To implement the H strategy we partitioned the entire collection in K = 4 groups composed respectively of 83, 99, 114 and 50 individuals. This partition corresponds to the one proposed by the software Structure based on the information brought by the 13 microsatellite loci. Despite some variation in group size, all four groups dis-played very similar levels of genetic diversity as measured by either the mean number of alleles per loci or the mean diversity of each loci (Table 3). We therefore sampled an equal number of individuals in each groups, i.e. we used
qi = 1/4 (i = 1, ..., 4), to implement the H strategy. The H strategy and all simulations described below were imple-mented using the language Mathematica version 4.0 [42] (a Mathematica notebook is available upon request). The sampling efficacy of both the M and the H strategies were assessed by comparing the score of core collections built of increasing sizes (in number of individuals) and we used the score of core collections sampled randomly through-out the same collection as a benchmark for these marker-based sampling strategies.
Authors' contributions
JR and TB participated in the design of the study, analyzed the data and wrote the manuscript. SS participated in the design of the study, developed the new microsatellite markers reported in that study, was responsible for obtaining the molecular data, and participated in the drafting of the manuscript. JMP conceived of the study, and together with MD participated in its design and coor-dination, and helped to draft the manuscript. All authors read and approved the final manuscript.
Additional material
Acknowledgements
We thank I. Hochu for her participation to microsatellite genotyping; D. Tauzin for help with greenhouse work for extracting inbred lines and mon-itoring of plant growth; T. Huguet for providing unpublished primers sequence data for 5 microsatellite loci; S. Cannon and N. Young for com-ments on a previous version of this manuscript and E. Knudsen for improv-ing the style of the last version of this manuscript. This work was supported by INRA through the research grant "Génétique et génomique de la légu-mineuse-modèle Medicago truncatula".
References
1. Initiative. TAG: Analysis of the genome sequence of the
flow-ering plant Arabidopsis thaliana. Nature 2000, 408(6814):796-815.
2. Goff SA, Ricke D, Lan TH, Presting G, Wang R, Dunn M, Glazebrook J, Sessions A, Oeller P, Varma H, Hadley D, Hutchison D, Martin C, Katagiri F, Lange BM, Moughamer T, Xia Y, Budworth P, Zhong J, Miguel T, Paszkowski U, Zhang S, Colbert M, Sun WL, Chen L, Cooper B, Park S, Wood TC, Mao L, Quail P, Wing R, Dean R, Yu Y, Zharkikh A, Shen R, Sahasrabudhe S, Thomas A, Cannings R, Gutin A, Pruss D, Reid J, Tavtigian S, Mitchell J, Eldredge G, Scholl T, Miller RM, Bhatnagar S, Adey N, Rubano T, Tusneem N, Robinson R, Feldhaus J, Macalma T, Oliphant A, Briggs S: A draft sequence of the rice
genome (Oryza sativa L. ssp. japonica). Science 2002, 296(5565):92-100.
3. Yu J, Hu S, Wang J, Wong GK, Li S, Liu B, Deng Y, Dai L, Zhou Y, Zhang X, Cao M, Liu J, Sun J, Tang J, Chen Y, Huang X, Lin W, Ye C, Tong W, Cong L, Geng J, Han Y, Li L, Li W, Hu G, Huang X, Li W, Li J, Liu Z, Li L, Liu J, Qi Q, Liu J, Li L, Li T, Wang X, Lu H, Wu T, Zhu M, Ni P, Han H, Dong W, Ren X, Feng X, Cui P, Li X, Wang H, Xu X, Zhai W, Xu Z, Zhang J, He S, Zhang J, Xu J, Zhang K, Zheng X, Dong J, Zeng W, Tao L, Ye J, Tan J, Ren X, Chen X, He J, Liu D, Tian W, Tian C, Xia H, Bao Q, Li G, Gao H, Cao T, Wang J, Zhao W, Li P, Chen W, Wang X, Zhang Y, Hu J, Wang J, Liu S, Yang J, Zhang G, Xiong Y, Li Z, Mao L, Zhou C, Zhu Z, Chen R, Hao B, Zheng W, Chen S, Guo W, Li G, Liu S, Tao M, Wang J, Zhu L, Yuan L, Yang H: A draft
sequence of the rice genome (Oryza sativa L. ssp. indica). Sci-ence 2002, 296(5565):79-92.
4. Alonso-Blanco C, Koornneef M: Naturally occurring variation in
Arabidopsis: An underexploited resource for plant genetics. Trends in Plant Science 2000, 5(1):22-29.
5. Nordborg M, Hu TT, Ishino Y, Jhaveri J, Toomajian C, Zheng H, Bakker E, Calabrese P, Gladstone J, Goyal R, Jakobsson M, Kim S, Morozov Y, Padhukasahasram B, Plagnol V, Rosenberg NA, Shah C, Wall JD, Wang J, Zhao K, Kalbfleisch T, Schulz V, Kreitman M, Bergel-son J: The pattern of polymorphism in Arabidopsis thaliana.
PLoS Biol 2005, 3(7):e196.
6. Wright SI, Bi IV, Schroeder SG, Yamasaki M, Doebley JF, McMullen MD, Gaut BS: The effects of artificial selection on the maize
genome. Science 2005, 308(5726):1310-1314.
7. Tanksley SD, McCouch SR: Seed banks and molecular maps:
unlocking genetic potential from the wild. Science 1997, 277(5329):1063-1066.
8. Falush D, Stephens M, Pritchard JK: Inference of population
struc-ture using multilocus genotype data: linked loci and corre-lated allele frequencies. Genetics 2003, 164(4):1567-1587.
9. Pritchard JK, Stephens M, Donnelly P: Inference of population
structure using multilocus genotype data. Genetics 2000, 155(2):945-959.
10. Brown AHD: The case for core collection. Genome 1989,
31:818-824.
11. Schoen DJ, Brown AHD: Conservation of allelic richness in wild
crop relatives is aided by assessment of genetic markers. Pro-ceedings of the National Academy of Sciences of the United States of Amer-ica 1993, 90(22):10623-10627.
12. Bataillon TM, David JL, Schoen DJ: Neutral genetic markers and
conservation genetics: Simulated germplasm collections. Genetics 1996, 144(1):409-417.
13. McKhann HI, Camilleri C, Berard A, Bataillon T, David JL, Reboud X, Le Corre V, Caloustian C, Gut IG, Brunel D: Nested core
collec-tions maximizing genetic diversity in Arabidopsis thaliana. Plant J 2004, 38(1):193-202.
14. Cook DR: Medicago truncatula--a model in the making! Curr
Opin Plant Biol 1999, 2(4):301-304.
15. The Medicago Handbook. [http://www.noble.org/Medicago-Handbook/]. .
16. Young ND, Cannon SB, Sato S, Kim D, Cook DR, Town CD, Roe BA, Tabata S: Sequencing the genespaces of Medicago truncatula
and Lotus japonicus. Plant Physiol 2005, 137(4):1174-1181.
17. Ane JM, Kiss GB, Riely BK, Penmetsa RV, Oldroyd GE, Ayax C, Levy J, Debelle F, Baek JM, Kalo P, Rosenberg C, Roe BA, Long SR, Denarie J, Cook DR: Medicago truncatula DMI1 required for bacterial
and fungal symbioses in legumes. Science 2004, 303(5662):1364-1367.
18. Endre G, Kereszt A, Kevei Z, Mihacea S, Kalo P, Kiss GB: A receptor
kinase gene regulating symbiotic nodule development. Nature 2002, 417(6892):962-966.
19. Levy J, Bres C, Geurts R, Chalhoub B, Kulikova O, Duc G, Journet EP, Ane JM, Lauber E, Bisseling T, Denarie J, Rosenberg C, Debelle F: A
putative Ca2+ and calmodulin-dependent protein kinase required for bacterial and fungal symbioses. Science 2004, 303(5662):1361-1364.
20. Limpens E, Franken C, Smit P, Willemse J, Bisseling T, Geurts R: LysM
domain receptor kinases regulating rhizobial Nod factor-induced infection. Science 2003, 302(5645):630-633.
21. Stacey G, Libault M, Brechenmacher L, Wan J, May GD: Genetics
and functional genomics of legume nodulation. Curr Opin Plant Biol 2006, 9(2):110-121.
Additional File 1
Table S1 list of the 346 accessions (inbred lines) analysed in the present study and associated geographical data.
Click here for file
[http://www.biomedcentral.com/content/supplementary/1471-2229-6-28-S1.pdf]
Additional File 2
Figure S1 (Log) Likelihood of the data (n = 266) as a function of K (the number of groups used to stratify the sample). For each K value, 5 independent runs were considered.
Click here for file
[http://www.biomedcentral.com/content/supplementary/1471-2229-6-28-S2.pdf]
Additional File 3
Table S2: Composition of groups obtained for different values of K (n = 266).
Click here for file
[http://www.biomedcentral.com/content/supplementary/1471-2229-6-28-S3.pdf]
Additional File 4
Table S3 Composition of the set of nested core-collections assembled to rep-resent naturally occurring variation in Medicago truncatula ssp
trunca-tula.
Click here for file
[http://www.biomedcentral.com/content/supplementary/1471-2229-6-28-S4.doc]
Additional File 5
Table S4 Microsatellite genotyping data (n = 346).
Click here for file
[http://www.biomedcentral.com/content/supplementary/1471-2229-6-28-S5.xls]
Publish with BioMed Central and every scientist can read your work free of charge
"BioMed Central will be the most significant development for disseminating the results of biomedical researc h in our lifetime."
Sir Paul Nurse, Cancer Research UK Your research papers will be:
available free of charge to the entire biomedical community peer reviewed and published immediately upon acceptance cited in PubMed and archived on PubMed Central yours — you keep the copyright
Submit your manuscript here:
http://www.biomedcentral.com/info/publishing_adv.asp
BioMedcentral
22. Bonnin I, Prosperi JM, Olivieri I: Genetic markers and
quantita-tive genetic variation in Medicago truncatula (Legumi-nosae): a comparative analysis of population structure. Genetics 1996, 143(4):1795-1805.
23. Bonnin I, Ronfort J, Wozniak F, Olivieri I: Spatial effects and rare
outcrossing events in Medicago truncatula (Fabaceae). Mol Ecol 2001, 10(6):1371-1383.
24. Ellwood SR, D'Souza NK, Kamphuis LG, Burgess TI, Nair RM, Oliver RP: SSR analysis of the Medicago truncatula SARDI core
col-lection reveals substantial diversity and unusual genotype dispersal throughout the Mediterranean basin. Theor Appl Genet 2006:1-7.
25. Thuillet AC, Bataillon T, Poirier S, Santoni S, David JL: Estimation of
long-term effective population sizes through the history of durum wheat using microsatellite data. Genetics 2005, 169(3):1589-1599.
26. Ostrowski MF, David J, Santoni S, McKhann H, Reboud X, Le Corre V, Camilleri C, Brunel D, Bouchez D, Faure B, Bataillon T: Evidence
for a large-scale population structure among accessions of Arabidopsis thaliana: possible causes and consequences for the distribution of linkage disequilibrium. Molecular Ecology
2006, 15(6):1507-1517.
27. Bonnin I, Huguet T, Gherardi M, Prosperi JM, Olivieri I: High level
of polymorphism and spatial structure in a selfing plant spe-cies, Medicago truncatula (Leguminosae), shown using RAPD markers. Am J Bot 1996, 83:843-855.
28. Ohta T: Linkage disequilibrium due to random genetic drift in
finite subdivided populations. Proc Natl Acad Sci U S A 1982, 79(6):1940-1944.
29. Wakeley J, Lessard S: Theory of the Effects of Population
Struc-ture and Sampling on Patterns of Linkage Disequilibrium Applied to Genomic Data From Humans. Genetics 2003, 164(3):1043-1053.
30. Evanno G, Regnaut S, Goudet J: Detecting the number of clusters
of individuals using the software STRUCTURE: a simulation study. Mol Ecol 2005, 14(8):2611-2620.
31. Comes HP and Kadereit, J.W.: The effects of quaternary climatic
changes on plant distribution and evolution. Trends in Plant Sci-ence 1998, 3:432-438.
32. Hewitt GM: Genetic consequences of climatic oscillations in
the Quaternary. Philos Trans R Soc Lond B Biol Sci 2004, 359(1442):183-95; discussion 195.
33. Petit RJ, Pineau E, Demesure B, Bacilieri R, Ducousso A, Kremer A:
Chloroplast DNA footprints of postglacial recolonization by oaks. Proceedings of the National Academy of Sciences of the United States of America 1997, 94(18):9996-10001.
34. Zaharieva M, Santoni S, David J: Use of RFLP markers to study
genetic diversity and to build a core-collection of the wild wheat relative Ae. geniculata Roth (= Ae. ovata). Genetics Selection Evolution 2001, 33 (Suppl 1):S269-S288.
35. Baquerizo-Audiot E, Desplanque B, Prosperi JM, S. S:
Characteriza-tion of microsatellite loci in the diploid legume Medicago truncatula (barrel medic). Molecular Ecology Notes 2001, 1(1-2):1-3.
36. Belkhir K., Borsa P., Chikhi L., N. R, F. B: GENETIX 4.05, logiciel
sous Windows TM pour la génétique des populations. .
1996-2004
37. Raymond M, Rousset F: GENEPOP (Version 1.2): Population
genetics software for exact tests and ecumenicism. Journal of Heredity 1995, 86(3):248-249.
38. Hardy O, Vekemans X: Spagedi: a versatile computer program
to analyse spatial genetic structure at the individual or pop-ulation levels. Molecular Ecology Notes 2002, 2(618-620):.
39. Weir BS, Cockerham CC: Estimating F-statistics for the
analy-sis of population sructure. Evolution 1984, 38:1358-1370.
40. Gouesnard B, Bataillon TM, Decoux G, Rozale C, Schoen DJ, David JL: MSTRAT: an algorithm for building germ plasm core
col-lections by maximizing allelic or phenotypic richness. J Hered
2001, 92(1):93-94.
41. MSTRAT: Software v4.1. [http://www.montpellier.inra.fr/gap/
MSTRAT/mstratno.htm]. .
42. Wolfram S: Mathematica: a system for doing mathematics by