Publisher’s version / Version de l'éditeur:
Metrologia, 54, 1, pp. 1-18, 2016-11-28
READ THESE TERMS AND CONDITIONS CAREFULLY BEFORE USING THIS WEBSITE. https://nrc-publications.canada.ca/eng/copyright
Vous avez des questions? Nous pouvons vous aider. Pour communiquer directement avec un auteur, consultez la
première page de la revue dans laquelle son article a été publié afin de trouver ses coordonnées. Si vous n’arrivez pas à les repérer, communiquez avec nous à PublicationsArchive-ArchivesPublications@nrc-cnrc.gc.ca.
Questions? Contact the NRC Publications Archive team at
PublicationsArchive-ArchivesPublications@nrc-cnrc.gc.ca. If you wish to email the authors directly, please see the first page of the publication for their contact information.
This publication could be one of several versions: author’s original, accepted manuscript or the publisher’s version. / La version de cette publication peut être l’une des suivantes : la version prépublication de l’auteur, la version acceptée du manuscrit ou la version de l’éditeur.
For the publisher’s version, please access the DOI link below./ Pour consulter la version de l’éditeur, utilisez le lien DOI ci-dessous.
https://doi.org/10.1088/1681-7575/54/1/1
Access and use of this website and the material on it are subject to the Terms and Conditions set forth at
https://publications-cnrc.canada.ca/fra/droits
L’accès à ce site Web et l’utilisation de son contenu sont assujettis aux conditions présentées dans le site LISEZ CES CONDITIONS ATTENTIVEMENT AVANT D’UTILISER CE SITE WEB.
NRC Publications Record / Notice d'Archives des publications de CNRC:
https://nrc-publications.canada.ca/eng/view/object/?id=af2fb5ae-8667-43eb-9963-af0b31c48b89 https://publications-cnrc.canada.ca/fra/voir/objet/?id=af2fb5ae-8667-43eb-9963-af0b31c48b89On decay constants and orbital distance
to the Sun—part I: alpha decay
S Pommé1, H Stroh1, J Paepen1, R Van Ammel1, M Marouli1, T Altzitzoglou1,
M Hult1, K Kossert2, O Nähle2, H Schrader2, F Juget3, C Bailat3, Y Nedjadi3,
F Bochud3, T Buchillier3, C Michotte4, S Courte4, M W van Rooy5,
M J van Staden5, J Lubbe5, B R S Simpson5, A Fazio6, P De Felice6,
T W Jackson7, W M Van Wyngaardt7, M I Reinhard7, J Golya7, S Bourke7,
T Roy8, R Galea8, J D Keightley9, K M Ferreira9, S M Collins9, A Ceccatelli10,
L Verheyen11, M Bruggeman11, B Vodenik12, M Korun12, V Chisté13
and M-N Amiot13
1 European Commission, Joint Research Centre (JRC), Directorate for Nuclear Safety and Security, Retieseweg 111, B-2440 Geel, Belgium
2 Physikalisch-Technische Bundesanstalt (PTB), Bundesallee 100, 38116 Braunschweig, Germany 3 Institut de Radiophysique, Lausanne (IRA), Switzerland
4 Bureau International des Poids et Mesures (BIPM), Pavillon de Breteuil, 92310 Sèvres, France 5 Radioactivity Standards Laboratory (NMISA), 15 Lower Hope Road, Rosebank 7700, Cape Town, South Africa
6 National Institute of Ionizing Radiation Metrology (ENEA), Casaccia Research Centre, Via Anguillarese, 301—S.M. Galeria I-00060 Roma, C.P. 2400, I-00100 Roma AD, Italy
7 Australian Nuclear Science and Technology Organisation (ANSTO), Locked Bag 2001, Kirrawee, NSW 2232, Australia
8 National Research Council of Canada (NRC),1200 Montreal Road, Ottawa, ON, K1A0R6, Canada 9 National Physical Laboratory (NPL), Hampton Road, Teddington, Middlesex TW11 OLW, UK
10 Terrestrial Environment Laboratory, IAEA Environment Laboratories, Department of Nuclear Sciences and Applications, International Atomic Energy Agency (IAEA), Vienna International Centre, PO Box 100, 1400 Vienna, Austria
11 Belgian Nuclear Research Centre (SCK•CEN), Boeretang 200, B-2400 Mol, Belgium 12 Jožef Stefan Institute (JSI), Jamova 39, 1000 Ljubljana, Slovenia
13 CEA, LIST, Laboratoire National Henri Becquerel (LNHB), Bât. 602 PC 111, CEA-Saclay, 91191 Gif-sur-Yvette cedex, France
E-mail: stefaan.pomme@ec.europa.eu
Received 21 September 2016, revised 24 October 2016 Accepted for publication 1 November 2016
Published 28 November 2016 Abstract
Claims that proximity to the Sun causes variation of decay constants at permille level have been investigated for alpha decaying nuclides. Repeated decay rate measurements of 209Po, 226Ra, 228Th, 230U, and 241Am sources were performed over periods of 200 d up to two decades at various nuclear metrology institutes around the globe. Residuals from the exponential decay curves were inspected for annual oscillations. Systematic deviations from a purely exponential decay curve differ in amplitude and phase from one data set to another and appear attributable to instabilities in the instrumentation and measurement conditions. The most stable activity measurements of α decaying sources set an upper limit between 0.0006% and 0.006% to the amplitude of annual oscillations in the decay rate. There are no apparent indications for systematic oscillations at a level of weeks or months. Oscillations in phase with Earth’s orbital distance to the sun could not be observed within 10−5–10−6 range precision.
Original content from this work may be used under the terms of the Creative Commons Attribution 3.0 licence. Any further distribution of this work must maintain attribution to the author(s) and the title of the work, journal citation and DOI.
doi:10.1088/1681-7575/54/1/1
temporal behaviour of a decay series [5, 6] are even applied for accurate dating in archaeology [7], geo- and cosmochronology [8], nuclear forensics [9], monitoring of nuclear events [10, 11], or age dating of radiopharmaceuticals [11]. Signiicant violations of the invariability of decay constants would com-promise the accuracy by which one can compare activity mea-surements or even deine a reference for the SI-unit becquerel. There would be a natural limit to the precision by which a half-life value can be assigned to a radionuclide, unless conditions could be speciied for which an attained value applies.
The premise of invariability of the decay constants of radi-onuclides decaying by α, β− and β+ emission has withstood many experimental tests, showing independence to physical and chemical conditions such as temperature, pressure, and material surroundings [3, 4]. Internal conversion and electron capture (EC) decays are considered to be in a separate cat-egory, since the direct involvement of atomic electrons could in principle be affected by the ionisation state and chemical environment, particularly for low-Z nuclides like 7Be, but the magnitude of these effects are still debated [12–14]. Half-life measurements of radionuclides performed over a cen-tury in different laboratories show occasional discrepancies [15] which are generally ascribed to incomplete uncertainty assessment [2]. In the last decades, more attention is paid to precision, uncertainty evaluation, and documentation, which is resulting in a growing convergence of published half-life values at a sub-permille level [16].
In 2009, controversy arose due to claims by Jenkins et al that seasonal effects at a level of 10−3 in repeated decay rate measurements of 32Si/36Cl and 226Ra were due to an annual modulation of the decay constants rather than instabilities in the detection system [17, 18]. Fischbach et al postulated a causal correlation with the orbital Earth–Sun distance, pos-sibly through interactions with solar neutrinos or a scalar ield affecting the terrestrial ine structure constant [19]. They found support for the neutrino theory by a perturbation of measured 54Mn decay rates coinciding with a solar lare [20] and solar storms [21]. Jenkins et al collected experimental evidence of time-dependent decay rates for 3H, 22Na/44Ti, 36Cl, 54Mn, 56Mn, 60Co, 85Kr, 90Sr/90Y, 108mAg, 133Ba, 137Cs, 152Eu, 154Eu, 222Rn, 226Ra and 239Pu, in which the most often cited periodicity was 1 a, but also cycles of 1 d, 2 a, 11.7 a to 13.5 a were found by means of a time-frequency analysis [22]. Parkhomov [23] found 7 data sets of beta-decaying radionuclides exhibiting
[25] which has implications for cosmochronology.
As much as these claims attract interest as inspiration for new physical theories or hope for revolutionising cosmic neu-trino detection and radioactive waste management [26–28], if true they would have major implications on traceability and equivalence in the common measurement system of radioac-tive substances. Primary standardisation of activity concen-tration of a radionuclide in solution [29, 30] is performed down to an accuracy of typically 0.1% [31], and international equivalence is established through key comparisons organised under the auspices of the BIPM [32]. Through the International Reference System (SIR) [33] standardisations performed over half a century worldwide can be compared. Whereas the key comparison data sets may show signs of slight inconsistency [34, 35], there are reasons to assume that these are mainly caused by imperfections in the uncertainty assessments [31, 36, 37] rather than variability in the decay constants. Oscillations of the order of 10−3 in primary standardisations would not easily go unnoticed at this level of acc uracy, and are therefore unlikely to have occurred.
In the last decade, new experimental evidence has been presented refuting the variability claims of the decay con-stants. Stability within a level of <10−4 at annual time scale was observed in the decay of 22Na/44Ti, 108mAg, 121mSn, 133Ba, 241Am [38], 137Cs [39], 36Cl [40], 40K, 232Th [41], 226Ra [42], and 90Sr/90Y [43]. Repeated half-life measurements of short-lived nuclides including 44Sc [44], 198Au [45, 46], 222Rn [47], and daughter nuclides of 225Ac [48, 49] showed consistency over different periods in the year. No signiicant deviation of 40K, 137Cs, 232Th decay rates could be observed during the occurrence of the strongest solar lares in 2011 and 2012 [50]. The 198Au half-life is identical in a gold wire and sphere, showing independence of the internally generated neutrino lux of ~1011 s−1 through the surface of the sphere and ~1010 s−1 of the wire [51]. No evidence could be found for an anti-neutrino lux of 5 × 1010 cm2 s−1 from a reactor inluencing the decay of 22Na (EC, β+) and 54Mn (EC) [52]. Even in the presence of a 3 × 1012 cm2 s−1 reactor antineutrino lux, the measured differences in decay rates of 22Na, 54Mn and 60Co (β−) sources are only in the 10−5 range [53]. Geo- and cos-mochronology does not provide any support for heliocentri-cally variable decay rates in meteorites for 36Cl, 40Ar, 87Rb, 147Sm and 235,238U [54], and neither does the power of a 238Pu source in the Cassini spacecraft show dependence on neutrino
lux through proximity to the Sun [55, 56]. The half-lives of 198Au in gold and 97Ru in ruthenium proved to be the same within 0.04% and <0.1%, respectively, between room temper-ature and 19 K [24]. A 210Po source imbedded in silver showed the expected decay rate within 0.6% after having been cooled down to 4.2 K for 28 d [57], which is incompatible with a claim that the decay constant would reduce by 6.3% in these conditions.
In summary, the anomalies in the 36Cl and 226Ra decays have been disproved with new, more stable measurements and addi-tional evidence demonstrates the invariability of various decay constants under different physical and chemical constraints. Nevertheless, arguments were raised that the variability may differ from one nuclide to another and that experimental proof for a variety of nuclides and a variety of detectors is needed [17, 22]. In this work, 14 radionuclide metrology laboratories from across the globe present repeated activity measurements of various mono-radionuclide sources performed over a period of years or decades. Different decay modes were investigated, including α, β−, β+ and EC decay. Residuals from the expo-nential nuclear decay curves were inspected for annual oscilla-tions. The data sets were irst compensated for (1) the presence of occasional outlier values, (2) abrupt systematic changes in the detector response, e.g. due to replacement of the elec-tronics or recalibrations of the instrument, and (3) systematic drift extending over periods of more than 1 year.
This paper is part I of a trilogy, presenting experimental evi-dence for α decay. Part II [58] groups the evidence for beta minus decay and in part III [59] β+ and EC decay are investi-gated. Graphs are shown of residuals of integrated count rates or ionisation currents (for convenience all types of signals will be represented by the same symbol, I) over the measured period, as well as multi-annual averages taken over ixed 8 d periods of the year. The uncertainty bars are indicative only: for the individual data they often refer to a short-range repeat-ability, and for the annual averaged data (maximum 46 data, covering 8 d periods) they were derived from the spread of the input data and the inverse square root of the number of values in each data group. As a reference measure for the expected solar inluence, a functional curve is included representing the annual variation of the inverse square of the Sun–Earth distance, 1/R2, renormalized to an amplitude of 0.15% (which is the magni-tude of the effect claimed by Jenkins et al). To the averaged residuals plotted as a function of time, a sinusoidal shape A sin (2π (t + a)/365) has been itted in which A is the amplitude, t is the elapsed number of days since New Year, and a is the phase shift expressed in days. This function is occasionally included in the residual plots. A summary table of the sinus parameter it values for each data set has been published in [60].
2. Radium-226 series
2.1. Decay characteristics
Radium-226 is typically used as a reference source for gamma-ray spectrometers and for ionisation chambers (IC) [61] acting as secondary standardisation devices for activity. The 226Ra has a half-life of 1600 (7) a and decays by α-emission to 222Rn
(3.8232 (8) d), followed by a series of mostly short-lived alpha and beta emitters (T1/2 < 5 d), except for 210Pb (22.23 (12) a) and 210Po (138.3763 (17) d) [16]. To measure the activity of 226Ra and its progeny in equilibrium, more than a century old material needs to be used in a closed coniguration that is radon tight. After a sudden loss of 222Rn, the activity of the irst 2/3rd of the decay series would re-establish itself in a few weeks, whereas the last 1/3rd of the chain would remain in equilibrium with the activity of 210Pb for decades. Only the half-lives of the α emitters 226Ra and 210Po and the β− emitter 210Pb are long enough to be relevant for explaining annual variations in the decay rates as a result of seasonal changes in the decay constants through solar inluence.
2.2. 226Ra series @PTB (<1999)
On several occasions, series of activity measurements obtained with an ionisation chamber (type IG12, 20th Century Electronics, UK) at the PTB [62–65] have been used by others [17, 22, 66–68] to make claims about a solar inluence on decay constants. Metrologists of the PTB have always empha-sized that variations in the ionisation current are caused by instrumental and environmental parameters in the laboratory [40, 42, 62–65]. Recent tests in the Khalifa university (Abu Dhabi, UAE) [69] have conirmed that activity measurements with several detector types are sensitive to environmental conditions, such as temperature, humidity and pressure. Nevertheless, Jenkins et al claimed that ‘sensitivities to sea-sonal variations in the respective detectors are likely too small to produce the observed luctuations’ [18].
The most cited case is 226Ra, used as reference source for IC stability checks. As shown in igure 1, the residuals from an exponential decay curve to old data obtained from 1983 to 1998 show annual periodicity of about 0.15% mag-nitude. These oscillation effects—also present in residuals for 85Kr, 90Sr, 108mAg, 133Ba, and 152,154Eu [58, 59]—have been Figure 1. Residuals from an exponential decay curve of the ionisation current from a 226Ra source inside the IG12/A20 ionisation chamber at PTB measured between 1984 and 1998. The line represents relative changes in the inverse square 1/R2 of the Earth–Sun distance, normalized to an amplitude of 0.2%. Metrologia 54 (2017) 1
signiicantly reduced when the Townsend balance current measurement method was replaced by a commercial Keithley electrometer [42, 65] (see next section). Consequently, the effect is of instrumental nature and should not be interpreted as an indication of changing decay constants.
Figure 2 shows the averaged residuals grouped in bins of 8 d in the year, which take a sinusoidal shape as a function of time in which the amplitude is A = 0.083 (2) % and the phase shift a = 59 d. The phase does not coincide with the variations of orbital distance Earth–Sun (a = 89.5 d), nor with average humidity and temperature in the Braunschweig region [70]. Semkow et al [71] proposed an explanation through ambient conditions in the laboratory, however some of their arguments were criticised by Schrader [65]. The discharge of the capacitor through radon decays in the air, as suggested by Siegert et al [62], is a possible explanation, considering that the seasonal
variations for atmospheric radon concentration follow a sinu-soidal model [72]. There is indeed a remarkable correlation with average seasonal changes of radon concentration in air (A = 16 (2)%, a = 57 d) measured inside the laboratory from 2010 to 2016 (see igure 3), but causality has not been proved. 2.3. 226Ra series @PTB (>1999)
The 226Ra data collected with the same IC from 1999 to 2016 are presented in igure 4. Since the replacement of the Townsend balance with commercial electrometers Keithley 6517A and B [42, 65], the annual modulations have reduced drastically and their phase has changed as well. The annually averaged residuals in igure 5 now show a modulation with an amplitude of A = 0.016 (1)% and a phase shift of a = 194 d. This mea-surement series shows mild correlation with the room temper-ature (igure 6, ρ = 0.23) and humidity (igure 7, ρ = 0.25), but not with the radon concentration in the laboratory (igure 3, ρ = 0.0). Nähle and Kossert [42] already pointed out that temperature and humidity can have an effect on the electrical Figure 2. Annual averages of the residuals in igure 1 for periods of
8 d, compared to renormalised relative changes in 1/R2 for Earth– Sun distance as well as in the outdoor humidity and maximum temperature in the Braunschweig area. The sign of the temperature data was reversed to facilitate direct comparison.
Figure 3. Annually averaged relative variations of radon
concentration in the air inside the PTB laboratory room where the IC is installed, measured with a radon monitor from mid 2010 up to mid 2016. The line represents a sinusoidal function itted to the data. The annual oscillations in radon concentration appear to be in phase with the modulations of the 226Ra ionisation current in igure 2.
Figure 4. Residuals from exponential decay for 226Ra ionisation current measurements with the PTB IG12/A20 ionisation chamber from 1999 to 2016.
Figure 5. Annual average residuals from exponential decay for 226Ra ionisation current measurements with the PTB IC from 1999 to 2016. The modulations are smaller than in igure 2 due to a replacement of electronics.
properties of the signal cables and the electrometer. The manu-facturer of the Keithley electrometers used at PTB claims a
temperature coeficient of 0.1%/°C of the reading in the rel-evant current range (see [42] and references therein).
2.4. 226Ra series @ENEA
At ENEA (Italy) between 1992 and 2016, 213 ionisation cur-rent measurements were performed on a 226Ra source, using a Centronic IG11 ionisation chamber with a Keithley 617 electrometer. The decay-corrected current measurements cover a period of 24 years and have a standard deviation of 0.05%. The residuals from exponential decay are presented in igure 8, together with a polynomial trend line itted to the data. By compensating for this sub-permille trend line, the standard deviation of the residuals could be reduced to 0.04%. Whereas annual sinusoidal oscillations are not immediately apparent from the individual residuals, they do appear in the annual average (detrended) residuals in igure 9 with an ampl itude of A = 0.037 (4)% and a phase of a = 319 d. Without the detrending correction, the modu-lation of the data is less smooth and the itted amplitude is lower (A = 0.026 (6)%, a = 305 d). The modulations are not in phase with Earth–Sun distance, nor with the PTB data, therefore are unlikely to be generated by the same global phenomenon.
Between 24 March and 12 May 2016, thousands of system-atic measurements have been performed to investigate corre-lations between the IC readouts for a 226Ra source and room temperature, ambient pressure, relative humidity and radon concentration in air in the same laboratory room. The graphs in igure 10 illustrate the signiicant correlation (ρ = 0.84) between temperature and (averaged) IC currents, whereas the other environmental conditions have a lower impact (−0.2 < ρ < 0.2). This suggests that the seasonal variations in the IC signals at ENEA may ind their origin in temperature variations in the laboratory.
Since multiple measurements were performed during day and night, the readouts could be investigated for diurnal mod-ulations as well. For each hour of the day an average value was calculated. The average temperature over this 49 d period Figure 6. Annually averaged relative variations of the room
temperature (in kelvin) inside the PTB laboratory from 2009 to 2016.
Figure 7. Annually averaged relative variations of the relative humidity inside the PTB laboratory from 2009 to 2016.
Figure 8. Residuals from exponential decay for 226Ra ionisation current measurements with the IG11 IC at ENEA between 1992 and 2016. The dashed line shows a trend line itted to the data.
Figure 9. Annual average residuals from exponential decay for 226Ra activity measurements with the ENEA IC, in which the input data were irst detrended by means of the trend line in igure 8. Metrologia 54 (2017) 1
shows a daily cycle with minimum values (23.08 °C) in the morning and maximum values (23.50 °C) in the afternoon. The average IC current shows nominally less variation (0.005%), but follows a similar pattern. The close correlation between the IC current and temperature variations are immediately apparent when plotting them as a z-score (z = (x − µ)/σ) as a function of time, as shown in igure 11. Since the diurnal
modulations in the IC are proportional to and synchronous with the temperature changes, causality may be inferred. The speciications of the electrometer mention a temperature coef-icient of 0.15%/ °C in the 200 pA range. The correlation plots reveal a slope of 0.1%/°C for an average current of 0.71 nA. This study is a good illustration of the point raised that one should rule out instrumental uncertainties before reverting to new physics [2, 36, 37].
2.5. 226Ra series @BIPM
The BIPM (located in France) houses the SIR [33], a system of two Centronics IG11 ICs used as long-term reference instru-ments by which mono-radionuclide solutions with standardised activities can be compared for equivalence. The stability of the SIR is monitored with 226Ra check sources and the residuals from exponential decay between 2001 and 2015 for source #4 in IC #389 are presented in igure 12. The residuals are small, mostly within 0.05%, and in the annual averages of igure 13 the residual sinusoidal effect—if any—appears to be in the order of A = 0.004 (3)% and phase a = 4 d. This is an order of Figure 12. Residuals from exponential decay for 226Ra activity measurements with an IG11 ionisation chamber of the SIR at the BIPM.
Figure 13. Annual average residuals from exponential decay for 226Ra activity measurements with the BIPM IC.
Figure 11. Z-score plot of diurnal variations in the 226Ra current and room temperature at the ENEA laboratory, averaging readouts collected between 24 March and 12 May 2016.
Figure 10. Correlation plot of averaged 226Ra current readouts in the ENEA IC with radon concentration in air, room temperature, relative humidity and atmospheric pressure measured from March to May 2016 in the ENEA laboratory. The data were rescaled to a
magnitude smaller than the natural dispersion of the data, out of phase with Earth–Sun distance, and irm evidence of the invari-ability of the 226Ra decay constant to solar proximity.
2.6. 226Ra series @JRC
The Joint Research Centre (JRC) of the European Commission contributes to the establishment of a common measurement system of activity through its radionuclide metrology laboratory in Geel (Belgium). Two 226Ra sources (#1 and #2) are frequently measured in the IG12 well-type IC (20th Century Electronics, UK) illed with argon to 2 MPa. The ionisation current is measured by sampling a voltage over an external feedback air-spaced capacitor [73]. In off-line data analysis, it is corrected for average background signal and decay.
Figures 14 and 15 show the residuals from a smooth decay curve obtained between 2005 and 2015 with sources #1 and #2, respectively. The current readouts (66 pA) from source #1 reveal a bimodal pattern, tentatively ascribed to occasional leakage of radon and progeny from the metal container. Source
#2 is more active and its residuals are much smoother, how-ever its decay-corrected current (139 pA) had to be compen-sated for a quasi-parabolic increase of 0.092% in 10 years. The latter is likely due to ingrowth of 210Pb, assuming that the 226Ra was not in perfect equilibrium with its daughter nuclides when the source was produced. A weighted mean of the weekly aver-ages of the residuals is presented in igure 16: there is no indi-cation of an annual effect (A = 0.003 (2)%, a = 363 d). 2.7. 226Ra series @NPL
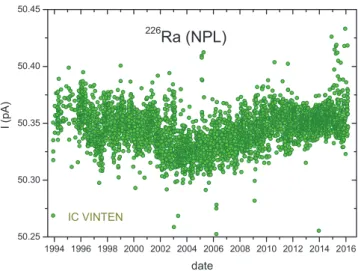
At the NPL (UK) ICs are intensively used for secondary stan-dardisation of activity. A long history of 226Ra check source measurements were provided for two well-type re-entrant ICs: a PA782 (2 MPa argon gas, steel inner well) and a Vinten (1 MPa nitrogen gas, 3 mm Al inner well). Figure 17 shows 4306 raw decay-corrected current readouts in the PA782 from 1993 to 2016. The apparent small systematic shifts are caused by appli-cation of changing calibration factors. The data were analysed in a pragmatic manner by applying a renormalisation for every Figure 14. Residuals from exponential decay for 226Ra (source #1)
activity measurements with the IG12 IC of the JRC.
Figure 16. Annual average residuals from exponential decay for 226Ra activity measurements with the IG12 IC of the JRC, taken as a weighted mean for sources #1 and #2.
Figure 17. Decay-corrected ionisation current of a 226Ra source with the PA782 IC of NPL, in which different calibration factors were applied over periods in time.
Figure 15. Residuals from exponential decay for 226Ra (source #2) activity measurements with the IG12 IC of the JRC.
calendar year and elimination of 6% data at both extremes, resulting in the individual residuals of igure 18 and the averages
in igure 19. These data represent conclusive evidence that there is no annual effect (A = 0.0025 (18)%, a = 60 d).
The 4017 current readouts obtained with the Vinten (igure 20) show even less dispersion, but make noticeable jumps on long-term due to recalibrations. Applying renormalisation per calendar year and removal of 0.6% of extreme data, the residual plot in igure 21 was obtained and the averages in igure 22. In spite of the crude renormalisation procedure, there is only a small residual trend in the annual averages (A = 0.005 (1)%, a = 73 d).
2.8. 226Ra series @NMISA
Additional evidence was collected from the southern hemi-sphere, at NMISA (South Africa) and ANSTO (Australia) (see next section). The 226Ra readouts between 1994 and 2015 (igure 23) in the Isocal IV well-type IC at NMISA showed large variability and regular adjustments were done to keep them within speciications. The averages in igure 24 do not have the required precision to make statements about Figure 21. Residuals from exponential decay for 226Ra activity measurements with the Vinten IC of NPL, after renormalisation per calendar year.
Figure 22. Annual average residuals from exponential decay for the renormalized 226Ra activity measurements with the Vinten IC of NPL.
Figure 19. Annual average residuals from exponential decay for the renormalized 226Ra activity measurements with the PA782 IC of NPL.
Figure 20. Decay-corrected ionisation current of a 226Ra source with the Vinten IC of the NPL, in which different calibration factors were applied over periods in time.
Figure 18. Residuals from exponential decay for 226Ra activity measurements with the PA782 IC of NPL, after normalisation per calendar year.
sub-permille variations, but this case exempliies the notion that instrumental instabilities can be signiicant and should be considered prior to postulating new physics.
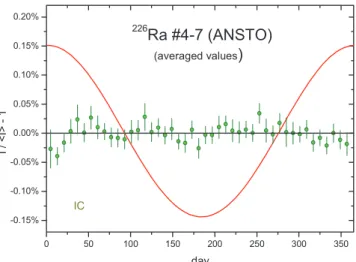
2.9. 226Ra series @ANSTO
ANSTO (Australia) provided 9 data sets of IC measurements of 226Ra sources#1, #3, #4, #5, #6, #7 in standard as well as special conigurations (source #4 in vial, #5 in ampoule, and #7 in Al Au). The IC is a TPA Mk-II illed with 2 MPa of argon and operated at a bias of 520 V. Ionisation current is measured with a Keithley 6517A electrometer. A selection of 4 sets of residuals from an exponential curve are presented in igures 25–28. All data were renormalised after mid February 2015, when a new electrometer was brought in use. The latter had a noticeable effect on the background current and readout for low-activity sources. In igure 29 a mean is shown from 7 data sets for sources #4–7. There is some residual time dependence, but annual effects are negligibly low (A = 0.005 (3)%, a = 256 d) also in the southern hemisphere.
ANSTO kept additional records of the response of a medical calibrator (TPA ionisation chamber with Keithley electrometer) to a 226Ra reference source. The statistical precision of these data is in the 1% range (see igure 30), but averages of the 1749 Figure 23. Residuals from exponential decay for 226Ra activity
measurements with the IC of NMISA.
Figure 24. Annual average residuals from exponential decay for the 226Ra activity measurements with the IC of NMISA.
Figure 25. Residuals from exponential decay for 226Ra (source #4) activity measurements with the TPA Mk-II IC of ANSTO.
Figure 26. Residuals from exponential decay for 226Ra (source #5 in an ampoule) activity measurements with the IC of ANSTO. The dotted line marks the installation of a new electrometer.
Figure 27. Residuals from exponential decay for 226Ra (source #6) activity measurements with the IC of ANSTO. The dotted line marks the installation of a new electrometer.
data points obtained between 2009 and 2015 demonstrate the absence of annual oscillations at the10−3 level (igure 31).
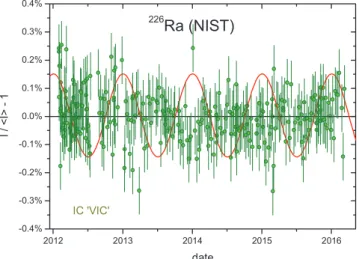
2.10. 226Ra series @NIST
At the NIST, two 226Ra sources were measured in total 99 times in the ‘AutoIC’ ionisation chamber [74] between 2008 and 2016 (igure 32). The AutoIC consists of a Centronic IG11 re-entrant IC shielded by lead on all sides. The detector bias is negative 1.10 kV and the ionisation current is measured by a Keithley 6517A digital electrom-eter (Keithley Instruments, Inc, Cleveland, OH, USA). The samples are loaded into the chamber by a custom-designed automatic sample changer. Instrument stability is regularly checked with sealed 226Ra needle sources encapsulated in acrylic right-circular cylinders. The mean residuals in igure 33 show a mild annual modulation (A = 0.015 (3)%, a = 255 d).
An additional set of 272 226Ra measurements were per-formed between 2012 and 2016 in the NIST Vinten 671 IC (‘VIC’) [75] (serial number 3–2, Vinten Instruments, Surrey, UK), which is biased to 1500 V and is also read by a Keithley 6517A electrometer. The data of the VIC have a larger variance compared to the AutoIC (igure 34), Figure 28. Residuals from exponential decay for 226Ra (source #7
in Al–Au) activity measurements with the IC of ANSTO. The dotted line marks the installation of a new electrometer.
Figure 30. Residuals from exponential decay for 226Ra activity measurements with a medical calibrator (IC) of ANSTO. Figure 29. Annual average residuals from exponential decay for 226Ra (7 data sets for sources #4–7) activity measurements with the IC of ANSTO.
Figure 32. Residuals from exponential decay for activity measurements of two 226Ra sources with the ‘AutoIC’ of NIST. Figure 31. Annual average residuals from exponential decay for 226Ra activity measurements with a medical calibrator (IC) of ANSTO.
but the average residuals (igure 35) show no annual trend (A = 0.002 (8)%, a = 8 d). The modulations in the AutoIC data are therefore not driven by a common effect on the decay constants.
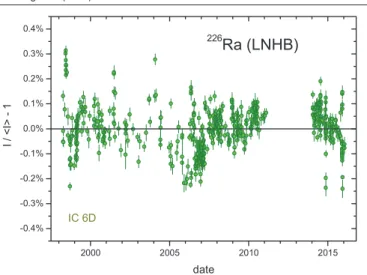
2.11. 226Ra series @LNHB
At the LNHB (France), 226Ra measurements were performed between 1998 and 2016 in ICs 2A and 6D. The IC 2A is a 1 MPa nitrogen-illed Vinten 671 (Centronic, UK) and the IC 6D is a Vacutec 70129 (Nuklear-Medizintechnik Dresden GmbH, Germany) illed with a 1.1 MPa mixture of xenon and argon gas. Both ICs have an aluminium alloy wall, are surrounded by a 5-cm-thick lead shield, and their current is read out with a Keithley 6517A electrometer. The −400 V high voltage of both ICs is supplied by the electrometer. The 226Ra ionis ation current data obtained with the IC 2A were linearised, a few outliers removed, and the 455 residuals are presented in igure 36. The mean residuals in igure 37 show a mild annual modulation of A = 0.026 (6) % and a = 328 d. The same data treatment was performed on the IC 6D, resulting in the 499 residuals in igure 38. The amplitude of the annual modulations (igure 39) in this device is twice as high as in the IC 2A and the phase is slightly different: A = 0.042 (7) % and a = 294 d.
Figure 33. Annual average residuals from exponential decay for 226Ra activity measurements with the ‘AutoIC’ of NIST.
Figure 34. Residuals from exponential decay for 226Ra activity measurements with the ‘VIC’ of NIST.
Figure 35. Annual average residuals from exponential decay for 226Ra activity measurements with the ‘VIC’ of NIST.
Figure 36. Residuals from exponential decay for 226Ra activity measurements with the IC 2A of LNHB.
Figure 37. Annual average residuals from exponential decay for 226Ra activity measurements with the IC 2A of LNHB.
3. Polonium-209
3.1. Decay characteristics
Polonium-209 (122.9 (23) a) decays by α emissions (99.546 (7)%) to excited levels and the ground state level of 205Pb and by EC (0.454 (7)%) to the 896 keV excited level of 209Bi. 3.2. 209Po @JRC
Pommé and Benedik [76] published an improved half-life value for 209Po based on the continuous measurement of emitted alpha particles from two drop-deposited sources in close geometry with a planar silicon detector (PIPS©
). The decay curve of source #1 is presented in igure 40 (and of source #2 in [76]). The residuals are purely of statistical nature, and therefore the annual oscillations in igure 41 (A = 0.006 (5)%, a = 6 d) are insigniicant. This type of measurement is quasi-free of interference because the alpha particles have a high energy of 5 MeV and can be easily
separated from electronic noise in the detection chain. The background signal is close to zero and the geometry was stable because the 209Po source was resting in a source mount placed directly on the detector housing in a vacuum chamber and the whole set-up remained untouched for two years.
4. Americium-241
4.1. Decay characteristics
Americium-241 (432.6 (2) a) decays 100% by α emission to
237Np, mostly populating the excited level at 59.54 keV. There is a small spontaneous ission branch of 3.6 (9) × 10−10 %. Two (partly converted) characteristic γ transitions useful for spectrometer calibration at low energy are 26.34 keV and 59.54 keV. The main alpha emission energy is at 5.5 MeV. This radionuclide is frequently used in calibration sources for gamma and alpha spectrometry.
Figure 38. Residuals from exponential decay for 226Ra activity measurements with the IC 6D of LNHB.
Figure 39. Annual average residuals from exponential decay for 226Ra activity measurements with the IC 6D of LNHB.
Figure 40. Measured relative alpha-particle count rates from the decay of 209Po source #1 with a planar silicon detector at JRC, not corrected for decay.
Figure 41. Annual average residuals from exponential decay for 209Po activity measurements with a planar silicon detector at JRC.
4.2. 241Am @JRC
Whereas the 209Po experiment in section 2.8 is an example of how an alpha emitter can be measured free of interference and with stable counting eficiency, the opposite can be realised by applying unfavourable measurement conditions. At the JRC, an 241Am source was used for checking the stability of an x-ray counter with deined solid angle [77] in the frame of an 55Fe half-life experiment [78] (see part II [58] of this trilogy), but eventually turned out to be unsuited for the task. The alpha particles were stopped by a Be window and the photons were measured in a proportional counter (PC) at a counter gas pressure of 1.14 × 10⁵ Pa (compared to a reference pressure vessel). The count rate (igure 42) appeared to increase as a function of time, tentatively ascribed to the ingrowth of 237Np and/or rising of the room temperature from 19 °C to 22 °C and later 24 °C (igure 43). Possibly, small changes in the detector volume and threshold settings may have affected the counting eficiency for the wide range of photons (and conversion
electrons) emitted in 241Am and 237Np decay (igure 44), whereas for the 0.6–6 keV x-rays from 55Fe it remained fairly stable (close to 100% eficiency). The instabilities in the mea-surement conditions seemingly support the idea of variability of decay constants (igure 45) with an amplitude of A = 0.101 (16)% (a = 104 d) or half that size in the period from mid 2004 to mid 2005 (with laboratory temperatures within 18.6 °C–22.9 °C). In this context, publication of a failure report is instructive.
4.3. 241Am @SCK
The γ-ray spectrometry service of the SCK•CEN (Belgium) provided 8 data sets of quality control measurements of a mixed 241Am–152Eu source on HPGe spectrometers #8, 10, 11, 13, 16, 25, 26, 27 between 2008 and 2016. The back-ground- and decay-corrected area of the 59 keV peak for each detector (see e.g. igure 46 for detector #10) shows a quasi-linearly increasing trend with time and a jump in 2011 due to a change in data acquisition system [79]. The trend prob-ably results from uncompensated count loss by pulse pileup Figure 42. Measured count rate from photon (and electron)
emission in the decay of 241Am with a gas-illed proportional counter in ixed low solid angle geometry at JRC.
Figure 43. Measured count rate from the decay of 241Am with a proportional counter as a function of temperature in the laboratory at JRC.
Figure 44. Residuals from exponential decay for 241Am activity measurements with a proportional counter at JRC.
Figure 45. Annual average residuals from exponential decay for 241Am activity measurements with a proportional counter at JRC (comprising all data from igure 44).
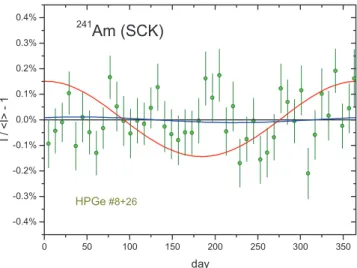
[80]. The data groups have been linearised and connected by means of the it of two slopes and a scaling factor. The residuals have varying statistical accuracy, mainly depending on the detection eficiency at 59 keV, and also the stability for annual oscillations is largely different from one detector to another. Three groups of results were averaged: two detec-tors showing no annual effects in igure 47 (A = 0.011 (20)%, a = 51 d), three detectors with intermediately sized oscillations in igure 48 (A = 0.065 (13)%, a = 255 d), and three with large oscillations in igure 49 (A = 0.139 (20)%, a = 244 d).
The amplitudes (and phases) of the oscillation effects in each detector are almost identical for the 152Eu data (see part III [59]), as can be veriied in igure 50. They are mostly likely caused by seasonal effects on the detection eficiency, pos-sibly through temperature effects on the geometry and elec-tronics. One can exclude an explanation through changes in the decay constants in correlation with Earth–Sun distance,
because the most stable data sets conirm the invariability of the 241Am decay constant down to sub-permille level.
4.4. 241Am @PTB
At the PTB, 704 decay rate measurements were performed between 2014 and 2016 by means of a commercial TriCarb 2810 TR liquid scintillation counter. Two 241Am and one background sample were prepared with Ultima Gold AB and water in glass vials. The duration of individual measure-ments was 12 h in all cases. The net counting rate was about 1200 s−1 and the relative statistical uncertainty was about 0.014%. One outlier (December 2014) was removed from the data sets. The background- and decay-corrected count rates show a slightly negative slope with time (igure 51). A possible explanation for this trend could be sample insta-bility due to slight colour quenching [81]. Rate-related non-linearity of the counter is less plausible considering that the counting rates did not vary much due to the long half-life of 241Am. After having applied a linear correction, the average Figure 46. Decay-corrected net peak count rates at 59 keV from
the decay of 241Am measured with HPGe detector #10 at the SCK•CEN. The dotted line marks a change of data acquisition system and the full lines represent linear trend lines.
Figure 47. Annual average residuals from exponential decay for 241Am activity measurements with HPGe-ray spectrometers #8 and #26 at SCK•CEN.
Figure 48. Annual average residuals from exponential decay for 241Am activity measurements with HPGe-ray spectrometers #11, #16 and #25 at SCK•CEN.
Figure 49. Annual average residuals from exponential decay for 241Am activity measurements with HPGe-ray spectrometers #10, #13 and #27 at SCK•CEN.
residuals in igure 52 show exceptional stability proving invariability of the decay constant down to the 10−6 level (A = 0.0001 (6)%, a = 324 d).
5. Uranium-230
5.1. Decay characteristics
Uranium-230 is a pure alpha emitter with a half-life of 20.23 (2) d [82] and its decay chain continues through a subsequent cascade of four alpha-emitting daughter nuclides with relatively short half-lives ranging between 30.70 (3) min (226Th) and 164.2 (6) µs (214Po) [83, 84]. It then proceeds through the long-lived beta emitter 210Pb (22.23 (12) a), predominantly followed by another beta emitter (210Bi) and an alpha emitter (210Po). 5.2. 230U @JRC
At the JRC, the decay of 230U has been followed between November 2010 and mid 2011 with 5 detectors [82] (PIPS© alpha particle counter at deined solid angle, liquid scintillation
counter, CsI sandwich spectrometer, HPGe γ-spectrometer, and PIPS© in 2π geometry [29]). The residuals to the expo-nential its for parent and daughter nuclides have been pub-lished [82]. The averaged residuals over a period of nearly 200 d in igure 53 (excluding data affected by the ingrowth of the daughter products) show stability at a sub-permille level (A = 0.007 (7)%, a = 173 d). Since not a full year was cov-ered, one could argue that oscillation effects may have been partly obscured by itting the best matching exponential func-tion, but the presence of annual oscillations at a permille level can be excluded.
6. Thorium-228
6.1. Decay characteristics
Thorium-228 (T1/2 = 1.9126 (9) a) decays 100% by alpha emission to 224Ra (3.631 (2) d). The main alpha emission energy is at 5.4 MeV. The 228Th decay can also be measured through characteristic γ rays of 224Ra at 84 keV, 216 keV and some less intense peaks at higher energies.
Figure 52. Annual average residuals from exponential decay for 241Am activity measurements with a liquid scintillation counter (LSC) at PTB.
Figure 53. Annual average residuals from exponential decay for 230U activity measurements with 5 different detectors at the JRC. Figure 50. Amplitude of average annual oscillations in the decay
rate of 241Am and 152Eu measured by γ-ray spectrometry with 8 detectors at SCK between 2008 and 2016.
Figure 51. Residuals from exponential decay for 241Am activity measurements with a liquid scintillation counter (LSC) at PTB. Metrologia 54 (2017) 1
6.2. 228Th @NIST
At the NIST, the decay of a 228Th source has been measured in IC ‘A’ 70 times between 1968 and 1978 [85]. Smoothly varying correction factors (<0.03%) were applied to com-pensate for geometrical instability of the source holder [86], which explains some remaining auto-correlation effects in the residuals of igure 54. In spite of the slight trending, the average of the residuals (igure 55) show absence of annual oscillations at permille level (A = 0.031 (22)%, a = 327 d). 7. Conclusions
The 226Ra decay curves from different laboratories show differences in stability which are uncorrelated in amplitude or time, but are strongly dependent on source activity and changes in the measurement set-up. The observed oscillations in the decay rates are not in phase with Earth–Sun distance, nor mutually coherent. Instability in the instrument and its local environment are the most plausible root cause of the
different periods spanning six decades. They are particularly indebted to Michael Unterweger, Ryan Fitzgerald, Denis Bergeron and Leticia Pibida of the National Institute of Stan-dards and Technology (NIST, USA) for generously providing data sets for various nuclides.
Disclaimer
Certain commercial equipment is identiied in this paper to foster understanding. Such identiication does not imply recommendation or endorsement by the participating labo-ratories, nor does it imply that the materials or equipment identiied are necessarily the best available for the purpose.
References
[1] Semkow T M 2007 Exponential decay law and nuclear statistics Applied Modeling and Computations in Nuclear
Science (ACS Symposium Series vol 945) ed T M Semkow et al (Washington, DC: ACS/OUP) pp 42–56
[2] Pommé S 2015 The uncertainty of the half-life Metrologia
52 S51–65
[3] Emery G T 1972 Perturbation of nuclear decay rates Annu.
Rev. Nucl. Sci. 22 165–202
[4] Hahn H-P, Born H-J and Kim J I 1976 Survey on the rate perturbation of nuclear decay Radiochim. Acta 23 23–37 [5] Bateman H 1910 The solution of a system of differential
equations occurring in the theory of radio-active transformations Proc. Camb. Phil. Soc. 15 423–7 [6] Pommé S et al 1996 General activation and decay formulas
and their application in neutron activation analysis with k0 standardization Anal. Chem. 68 4326–34
[7] Arnold J R and Libby W F 1949 Age determinations by radiocarbon content: checks with samples of known age
Science 110 678–80
[8] Begemann F et al 2001 Geochim. Cosmochim. Acta
65 111–21
[9] Pommé S, Jerome S M and Venchiarutti C 2014 Uncertainty propagation in nuclear forensics Appl. Radiat. Isot.
89 58–64
[10] Pommé S and Collins S 2014 Unbiased equations for 95Zr–95Nb chronometry Appl. Radiat. Isot. 90 234–40 [11] Pommé S, Collins S M, Harms A and Jerome S M 2016 Fundamental uncertainty equations for nuclear dating applied to the 140Ba–140La and 227Th–223Ra chronometers J. Environ. Radioact. 162 358–70
[12] Nir-El Y et al 2007 Precision measurement of the decay rate of 7Be in host materials Phys. Rev. C 75 012801
Figure 54. Annual average residuals from exponential decay for 228Th decay rate measurements with IC ‘A’ at NIST, after minor corrections for geometrical instability of the source holder.
Figure 55. Annual average residuals from exponential decay for 228Th decay rate measurements with IC ‘A’ at NIST, after minor corrections for geometrical instability of the source holder.
[13] Litvinov Y A and Bosch F 2011 Beta decay of highly charged ions Rep. Prog. Phys. 74 016301
[14] Atanasov D et al 2015 Between atomic and nuclear physics: radioactive decays of highly-charged ions J. Phys. B: At.
Mol. Opt. Phys. 48 144024
[15] Woods M J and Collins S M 2004 Half-life data—a critical review of TECDOC-619 update Appl. Radiat. Isot.
60 257–62
[16] DDEP, 2004–2013. Table of radionuclides vol 1–7, monographie BIPM-5 BIPM, sèvres, website: www. nucleide.org/DDEP_WG/DDEPdata.htm
[17] Jenkins J H et al 2009 Evidence of correlations between nuclear decay rates and Earth–Sun distance Astropart. Phys.
32 42–6
[18] Jenkins J H, Mundy D W and Fischbach E 2010 Analysis of environmental inluences in nuclear half-life measurements exhibiting time-dependent decay rates Nucl. Instrum.
Methods. A 620 332–42
[19] Fischbach E et al 2009 Time-dependent nuclear decay parameters: new evidence for new forces? Space Sci. Rev.
145 285–335
[20] Jenkins J H and Fischbach E 2009 Perturbation of nuclear decay rates during the solar lare of 2006 December 13
Astropart. Phys. 31 407–11
[21] Mohsinally T, Fancher S, Czerny M, Fischbach E,
Gruenwald J T, Heim J and Jenkins J H 2016 Evidence for correlations between luctuations in 54Mn decay rates and solar storms Astropart. Phys. 75 29–37
[22] Jenkins J H et al 2013 Concerning the time dependence of the decay rate of 137Cs Appl. Radiat. Isot. 74 50–5
[23] Parkhomov A G J 2011 Deviations from beta radioactivity exponential drop Mod. Phys. 2 1310–7
[24] Hardy J C et al 2010 Tests of nuclear half-lives as a function of the host medium and temperature: refutation of recent claims Appl. Radiat. Isot. 68 1550–4
[25] Belloni F 2016 Alpha decay in electron environments of increasing density: from the bare nucleus to compressed matter Eur. Phys. J. A 52 32
[26] Muir H 2006 Half-life heresy New Sci. 192 36–9
[27] Mullins J 2009 Is the sun reaching into Earthly atoms? New
Sci. 202 42–5
[28] Clark S 2012 Half-life heresy: strange goings on at the heart of the atom New Sci. 216 42–5
[29] Pommé S 2007 Methods for primary standardization of activity Metrologia 44 S17–26
[30] Simpson B and Judge S 2007 Special issue on radionuclide metrology Metrologia 44 S1–152
[31] Karam L, Keightley J and Los Arcos J M 2015 Special issue on uncertainties in radionuclide metrology Metrologia
52 S1–212
[32] Karam L and Ratel G 2016 Consultative committee on ionizing radiation: impact on radionuclide metrology
Appl. Radiat. Isot. 109 12–6
[33] Ratel G 2007 The Système International de référence and its application in key comparisons Metrologia 44 S7–16 [34] Pommé S 2006 An intuitive visualisation of intercomparison
results applied to the KCDB Appl. Radiat. Isot.
64 1158–1162
[35] Pommé S and Keightley J 2015 Determination of a reference value and its uncertainty through a power-moderated mean
Metrologia 52 S200–12
[36] Pommé S 2016 When the model doesn’t cover reality: examples from radionuclide metrology Metrologia 53 S55–64
[37] Lindstrom R 2016 Believable statements of uncertainty and believable science J. Radioanal. Nucl. Chem. (doi: 10.1007/ s10967-016-4912-4)
[38] Norman E B et al 2009 Evidence against correlations between nuclear decay rates and Earth–Sun distance Astropart. Phys.
31 135–7
[39] Bellotti E et al 2012 Search for time dependence of the 137Cs decay constant Phys. Lett. B 710 114–7
[40] Kossert K and Nähle O 2014 Long-term measurements of 36Cl to investigate potential solar inluence on the decay rate
Astropart. Phys. 55 33–6
[41] Bellotti E et al 2015 Search for time modulations in the decay rate of 40K and 232Th Astropart. Phys. 61 82–7
[42] Nähle O and Kossert K 2015 Comment on ‘Comparative study of beta-decay data for eight nuclides measured at the Physikalisch–TechnischeBundesanstalt’(2014 Astropart.
Phys. 59 47–58) Astropart. Phys. 66 8–10
[43] Kossert K and Nähle O 2015 Disproof of solar inluence on the decay rates of 90Sr/90Y Astropart. Phys. 69 18–23 [44] García-Toraño E et al 2016 Standardisation and precise
determination of the half-life of 44Sc Appl. Radiat. Isot. 109 314–8
[45] Novković D et al 2006 Testing the exponential decay law of gold 198Au Nucl. Instrum. Methods A 566 477–80 [46] Hardy J C, Goodwin J R and Iacob V E 2012 Do radioactive
half-lives vary with the Earth-to-Sun distance? Appl.
Radiat. Isot. 70 1931–3
[47] Bellotti E et al 2015 Precise measurement of the 222Rn half-life: a probe to monitor the stability of radioactivity Phys.
Lett. B 743 526–30
[48] Marouli M et al 2013 Decay data measurements on 213Bi using recoil atoms Appl. Radiat. Isot. 74 123–7
[49] Suliman G et al 2013 Half-lives of 221Fr, 217At, 213Bi, 213Po and 209Pb from the 225Ac decay series Appl. Radiat. Isot. 77 32–7 [50] Bellotti E et al 2013 Search for correlations between solar
lares and decay rate of radioactive nuclei Phys. Lett. B
720 116–9
[51] Lindstrom R M et al 2011 Absence of a self-induced decay effect in 198Au Nucl. Instrum. Methods A 659 269–71 Lindstrom R M et al 2012 Absence of a self-induced decay
effect in 198Au Nucl. Instrum. Methods A 664 231 (erratum) [52] de Meijer R J, Blaauw M and Smit F D 2011 No evidence for antineutrinos signiicantly inluencing exponential β+ decay Appl. Radiat. Isot. 69 320–6
[53] Barnes V E et al 2016 Search for perturbations of nuclear decay rates induced by reactor electron antineutrinos arXiv:1606.09325
[54] Meier M M M and Wieler R 2014 No evidence for a decrease of nuclear decay rates with increasing heliocentric distance based on radiochronology of meteorites Astropart. Phys.
55 63–75
[55] Cooper P S 2009 Searching for modiications to the exponential radioactive decay law with the Cassini spacecraftAstropart. Phys. 31 267–9
[56] Krause D E et al 2012 Searches for solar-inluenced radioactive decay anomalies using spacecraft RTGs
Astropart. Phys. 36 51–6
[57] Pierre S et al 2010 On the variation of the 210Po half-life at low temperature Appl. Radiat. Isot. 68 1467–70
[58] Pommé S et al On decay constants and orbital distance to the Sun—part II: beta minus decay Metrologia 5419–35 [59] Pommé S et al On decay constants and orbital distance to
the Sun—part III: beta plus and electron capture decay
Metrologia 5436–50
[60] Pommé S et al Evidence against solar inluence on decay constants Phys. Lett. B 761 281–6
[61] Schrader H 2007 Ionization chambers Metrologia
44 S53–66
[62] Siegert H, Schrader H and Schötzig U 1998 Half-life measurements of europium radionuclides and the long-term stability of detectors Appl. Radiat. Isot.
49 1397–401
[63] Schrader H 2004 Half-life measurements with ionization chambers—a study of systematic effects and results
Appl. Radiat. Isot. 60 317–23 Metrologia 54 (2017) 1
half-lives Nucl. Instrum. Methods A 812 60–7 [70] https://weatherspark.com/averages/28660/
Brunswick-Niedersachsen-Germany
[71] Semkow T M 2009 Oscillations in radioactive exponential decay Phys. Lett. B 675 415–9
[72] Hayashi K et al 2015 Normal seasonal variations for atmospheric radon concentration: a sinusoidal model
J. Environ. Radioact. 139 149–53
[73] Paepen J et al 2010 Half-life measurement of 124Sb Appl. Radiat. Isot. 68 1555–60
[74] Fitzgerald R P 2009 An automated ionization chamber for secondary radioactivity standards Appl. Radiat. Isot.
68 1507–9
[82] Pommé S et al 2012 Measurement of the 230U half-life Appl. Radiat. Isot. 70 1900–6
[83] Suliman G et al 2012 Measurements of the half-life of 214Po and 218Rn using digital electronics Appl. Radiat. Isot. 70 1907–12
[84] Pommé S et al 2012 Measurement of the 226Th and 222Ra half-lives Appl. Radiat. Isot. 70 1913–8
[85] Unterweger M P and Fitzgerald 2014 Update of NIST half-life results corrected for ionization chamber source-holder instability Appl. Radiat. Isot. 87 92–4
[86] Fitzgerald R 2012 NIST Ionization chamber‘A’ sample-height corrections J. Res. Natl Inst. Stand. Technol.