ANOMALY DETECTION IN AIRLINE ROUTINE OPERATIONS
USING FLIGHT DATA RECORDER DATA
Lishuai Li and R. John Hansman
This report is based on the Doctoral Dissertation of Lishuai Li submitted to the Department of Aeronautics and Astronautics in partial fulfillment of the requirements for the degree of
Doctor of Philosophy at the Massachusetts Institute of Technology. The work presented in this report was also conducted in collaboration with the members of the Doctoral Committee:
Prof. R. John Hansman (Chair) Prof. Roy Welsch Prof. Rafael Palacios
Prof. Julie Shah
Report No. ICAT-2013-4
June 2013
MIT International Center for Air Transportation (ICAT)
Department of Aeronautics & Astronautics
Massachusetts Institute of Technology
Cambridge, MA 02139 USA
ANOMALY DETECTION IN AIRLINE ROUTINE OPERATIONS USING
FLIGHT DATA RECORDER DATA
by
Lishuai Li and R. John Hansman
Abstract
In order to improve safety in current air carrier operations, there is a growing emphasis on proactive safety management systems. These systems identify and mitigate risks before accidents occur. This thesis develops a new anomaly detection approach using routine operational data to support proactive safety management. The research applies cluster analysis to detect abnormal flights based on Flight Data Recorder (FDR) data. Results from cluster analysis are provided to domain experts to verify operational significance of such anomalies and associated safety hazards. Compared with existing methods, the cluster-based approach is capable of identifying new types of anomalies that were previously unaccounted for. It can help airlines detect early signs of performance deviation, identify safety degradation, deploy predictive maintenance, and train staff accordingly.
The first part of the detection approach employs data-mining algorithms to identify flights of interest from FDR data. These data are transformed into a high-dimensional space for cluster analysis, where normal patterns are identified in clusters while anomalies are detected as outliers. Two cluster-based anomaly detection algorithms were developed to explore different transformation techniques: ClusterAD-Flight and ClusterAD-Data Sample.
The second part of the detection approach is domain expert review. The review process is to determine whether detected anomalies are operationally significant and whether they represent safety risks. Several data visualization tools were developed to support the review process which can be otherwise labor-intensive: the Flight Parameter Plots can present raw FDR data in informative graphics; The Flight Abnormality Visualization can help domain experts quickly locate the source of such anomalies.
A number of evaluation studies were conducted using airline FDR data. ClusterAD-Flight and ClusterAD-Data Sample were compared with Exceedance Detection, the current method in use by airlines, and MKAD, another anomaly detection algorithm developed at NASA, using a dataset of 25519 A320 flights. An evaluation of the entire detection approach was conducted with domain experts using a dataset of 10,528 A320 flights. Results showed that both cluster-based detection algorithms were able to identify operationally significant anomalies that beyond the capacities of
Acknowledgments
The work was supported by the Federal Aviation Administration under the Joint University Project (JUP) FAA 11-G-016 and the National Aeronautics and Space Administration (NASA) under Grant # NNA06CN23A.
Contents
Chapter 1 Introduction ... 7
1.1 Current Aviation Safety Level and Proactive Safety Management ... 7
1.2 Current Use of Flight Data Recorder Data ... 9
1.2.1 Flight Data Recorder ... 9
1.2.2 Flight Operational Quality Assurance (FOQA) Program ... 10
1.3 Research Objectives... 13
1.4 Research Overview ... 13
Chapter 2 Literature Review ... 15
2.1 Flight Data Monitoring ... 15
2.1.1 Flight Data Monitoring Process ... 15
2.1.2 Flight Data Analysis Tools ... 17
2.2 Anomaly Detection ... 20
2.2.1 Anomaly Detection Categorization... 20
2.2.2 Anomaly Detection in This Research ... 22
2.3 General Anomaly Detection Techniques ... 23
2.3.1 Statistical Anomaly Detection Approaches ... 23
2.3.2 Classification-based Anomaly Detection Approaches ... 24
2.3.3 Cluster-based Anomaly Detection Approaches ... 25
2.4 Anomaly Detection Techniques for Time Series ... 28
2.4.1 Data-based Approaches ... 29
2.4.2 Model-based Approaches ... 30
2.5 Anomaly Detection in Aviation ... 31
Chapter 3 Cluster-based Anomaly Detection Algorithms ... 34
3.1 Challenges in Detecting Anomalies in FDR Data ... 34
3.2 Concept of Cluster-based Anomaly Detection Algorithms ... 35
3.3 Pattern-based Anomalies and Instantaneous Anomalies ... 37
3.4 ClusterAD-Flight ... 38
3.4.1 Data Transformation ... 39
3.4.2 Dimension Reduction ... 40
3.4.3 Cluster Analysis ... 43
3.5 Initial Testing of ClusterAD-Flight ... 44
3.5.1 Dataset and Data Preparation ... 45
3.5.2 Results Overview ... 46
3.5.3 Abnormal Behaviors in Flights Detected ... 48
3.6.2 Characterization of Mode Distribution ... 61
3.6.3 Detecting Anomalies Based on Nominal Modes ... 63
3.7 Initial Testing of ClusterAD-Data Sample ... 65
3.7.1 Dataset and Data Preparation ... 65
3.7.2 Optimal Number of Nominal Modes ... 66
3.7.3 Nominal Modes ... 67
3.7.4 Anomaly Detection ... 69
3.8 Summary ... 73
Chapter 4 Expert Review and Data Representation ... 74
4.1 Expert Review Process and Practical Challenges ... 74
4.2 Data Visualization Tools for Expert Review ... 76
4.2.1 Flight Parameter Plot ... 77
4.2.2 Flight Abnormality Visualization ... 82
Chapter 5 Evaluation Studies ... 85
5.1 Overview of Evaluation Studies ... 85
5.1.1 Evaluation Challenges ... 85
5.1.2 Overview of Evaluation Studies ... 85
5.1.3 Overview of FDR Datasets ... 88
5.2 Evaluation Study I: Comparison of ClusterAD-Flight, MKAD and Exceedance Detection .. 89
5.2.1 Background: Evaluation Challenges in Anomaly Detection ... 89
5.2.2 Comparison Design and Setup ... 90
5.2.3 Results Overview ... 93
5.2.4 Comparison between ClusterAD-Flight and MKAD... 95
5.2.5 Comparison with Exceedance Detection ... 107
5.2.6 Study Summary ... 110
5.3 Evaluation Study II: Comparison of ClusterAD-Flight, ClusterAD-Data Sample, and MKAD in Detecting Exceedances ... 110
5.3.1 Comparison Design and Setup ... 110
5.3.2 Results ... 111
5.3.3 Study Summary ... 112
5.4 Evaluation Study III: Evaluation of ClusterAD algorithms and Data Visualization Tools with Domain Experts ... 112
5.4.1 Evaluation Design ... 113
5.4.2 Apparatus, Participants, and Procedure ... 119
5.4.3 Results on Perceived Operational Significance of Abnormal Flights ... 121
5.4.4 Results on Data Visualization Tools ... 135
5.4.5 Study Summary ... 137
Chapter 6 Conclusions and Future Work ... 139
6.1 Conclusions ... 139
6.2 Recommendations for Future Work ... 141
Chapter 1
Introduction
1.1
Current Aviation Safety Level and Proactive Safety
Management
Aviation safety has been improving steadily over the past 50 years. The annual accident rate and fatal accident rate decreased significantly as shown in Figure 1.1 and Figure 1.2 (Boeing Commercial Airplanes, 2012.) In recent years, the accident rate has been stable. As an industry which receives extensive public attention, the pressure on safety is always present.
Figure 1.1 Accident Rates and Onboard Fatalities by Year (Boeing Commercial Airplanes, 2012)
Figure 1.2 U.S. and Canadian Operators Accident Rates by Year (Boeing Commercial Airplanes, 2012)
In the past, airline safety has been improved by identifying problems after accidents. Accidents trigger the development and implementation of mitigation strategies (Logan, 2008). Further improvement of safety requires a proactive approach, in which potential hazards are identified and corrective actions are taken before accidents even occur.
In recent years, the airline industry has been making several efforts towards a more proactive safety management system. The Federal Aviation Administration (FAA) participants in three major voluntary programs (Federal Aviation Administration, 2010a)
Aviation Safety Action Program (ASAP) - A joint FAA/industry program that allows aviation employees to self-report safety violations to air carriers and FAA free from legal or disciplinary consequences.
Flight Operational Quality Assurance (FOQA) - A program for the routine collection and analysis of digital flight data generated during aircraft operations.
Advanced Qualification Program (AQP) - A voluntary alternative to traditional pilot training regulations that replaces programmed hours with proficiency-based training. AQP incorporates data-driven processes enabling air carriers to refine training based on identified individual needs.
Along with the implementation of voluntary safety programs, the airline industry has also developed a systems approach to manage risks via a systematic, explicit, and comprehensive process. The 2006 Advisory Circular (AC120-92) (Federal Aviation Administration, 2006), titled Introduction to Safety Management Systems for Air Operators, introduced the concept of a Safety Management System (SMS) to aviation service providers. The 2010 Advisory Circular (AC120-92A) (Federal Aviation Administration, 2010b) provided a Framework for Safety Management Systems development by aviation service providers.
The implementation of the voluntary safety programs has made progress. Meanwhile, SMS plans have been developed further along with other safety initiatives (Federal Aviation Administration, 2013). All these efforts identify detailed information on hazards, processes, and precursor events, in order to support risk assessment and mitigation actions. They converge in one direction: proactive safety management.
1.2
Current Use of Flight Data Recorder Data
1.2.1 Flight Data Recorder
Every aircraft is equipped with a Flight Data Recorder (FDR). Historically, it was used for accident investigations only. A FDR records flight parameters onboard during an entire flight. Typical flight parameters include altitude, airspeed, accelerations, thrust, engine pressures and temperatures, control surfaces etc. An example of the FDR data is shown in Figure 1.3. It displays a few flight parameters recorded in the last 110 seconds of the Cogan Air Flight 3407 before impact (NTSB, 2009).
Today, the recording capacity of FDR is significantly increased. The number of flight parameters being recorded increased significantly as shown in Table 1.1. The specification of flight parameters recorded and sampling rates vary by the type of recorder and the configuration requirements of the airline. FAA defined the minimum requirements of what flight parameters to be recorded and minimum sampling rates (Federal Aviation Administration, 2011) for US airlines. However, the recording capability on modern airplanes is much larger than the minimum requirements, as it was shown in Table 1.1. The FDR on Boeing 787 can record approximately 2000 flight parameters for 50 hours (Rosenkrans, 2008). The sampling rates vary by the nature of the flight parameter. For example, the vertical acceleration is recorded at 8 Hz, while the outside air temperature is recorded at 0.5 Hz.
Table 1.1 Evolution of FDR (N. A. H. Campbell, 2007) Aircraft Time into Service FDR Type Number of parameters FDR data capacity
Boeing 707 1958 Analogue 5 Mechanical limit of ~10 parameter Airbus 330 1993 Digital 280 128 words per second (wps) Embraer 170 2004 Digital Combi-recorder1 774 256 wps
Airbus 380 2007 Digital > 1000 1024 wps Boeing 787 2009 (first flight) Digital EAFR2 > 1000 Ethernet system
As FDR data is digitalized, it is also easier to access the data. FDR data can be downloaded periodically during routine operations. Therefore, it is possible to utilize FDR data from routine operations before accidents happen.
1.2.2 Flight Operational Quality Assurance (FOQA) Program
Program Overview
The Flight Operations Quality Assurance (FOQA) program, also called the Flight Data Monitoring (FDM) in Europe, aims to use detailed flight data recorded during daily flights to improve airline operations and safety. The general process of a FOQA program consists of data recording, downloading, and analysis. The recording of the data happens during every flight,
1 The combi-recorder stores both cockpit audio and flight data 2 EAFR: Enhanced Airborne Flight Recorder
measuring various flight parameters by airplane sensors and recording onboard using FDR. Data are downloaded and stored in a large database at the airline through manual retrieval or wireless transmission. For manual retrieval, the downloading process is performed once in several days or weeks when the aircraft park at a station or maintenance base. For wireless transmission, the downloading can be completed within 15 minutes after aircraft landing (Teledyne Controls, 2011). Downloaded data are analyzed by FOQA analysts to evaluate daily operations.
Data Analysis
Currently, analysis of FDR data is conducted by using a number of special purpose software programs. Details of each program may vary, yet data analysis is using two primary approaches: the Exceedance Detection approach and the Statistical Analysis approach (Federal Aviation Administration, 2004).
Exceedance Detection. The exceedance detection approach detects pre-defined operationally undesired events. It monitors if particular flight parameters exceed the predefined limits under certain conditions. The list of flight parameters and the limits of those parameters need to be specified by safety specialists in advance. Usually, the watch list coincide with the airline’s standard operating procedures, such as the pitch at takeoff, the speed at takeoff climb, the time of flap retraction, etc. A few examples are shown in Table 1.2 (Federal Aviation Administration, 2004).
Table 1.2 Examples of Exceedance Event Parameters and Definitions (Federal Aviation Administration, 2004)
Event Parameters Basic Event Definition Event Description Pitch High
at Takeoff Air/Ground Switch, Pitch Air/Ground = Ground, Pitch > x degrees An event that measures pitch at takeoff in relation to the angle required to strike the tail of the aircraft
Takeoff Climb Speed High
CAS, Gross
Weight, HAT HAT > x feet, HAA < x feet, CAS > V2 + x knots
An event to detect climb speed higher than desired during the Takeoff Phase of flight Early Flap
Retraction HAT, Flap Position HAT< x feet, Flap Position < Flap Position in the preceding sample
An event to detect any flap movement from the takeoff position prior to reaching the altitude at which flap retraction should begin
Approach
Speed High Gross Weight, CAS, HAT, Flaps
HAT > 1000 feet, HAT < 3000 feet, CAS > VFE - x
knots
HAT < 1000 feet, CAS > VREF + x knots
An event to detect operation on approach that is in excess of its computed final approach speed
Excessive Power Increase
HAT, N1 HAT < 500 feet, Δ of
N1 > x
An event to detect an excessive power increase during final phase of approach Operation Below Glideslope Glide Slope Deviation Low, HAT
Glide Slope Deviation Low > x dots, HAT < x feet
An event to detect deviation below glideslope
Statistical Analysis. In the statistical analysis approach, distributions of certain flight parameters are plotted to examine a particular flight operation. Compared with the Exceedance Detection, a carrier can gain a more complete picture of the operation based on the distribution of all flights using the Statistical Analysis. Figure 1.4 provides an example of the distribution analysis on “altitude at which landing flap is set”.
Figure 1.4 Distribution Analysis of "Altitude at Which Landing Flap Is Set" (N. Campbell, 2003)
The current FOQA data analysis performs well on known issues. However, it is incapable in identifying the unknowns. Both approaches need a pre-defined watch list of key parameters under certain operational conditions; the Exceedance Detection requires the thresholds of key parameters to be precisely defined in advance. As a result, only known issues are examined; emerging risks will remain undetected.
1.3
Research Objectives
This research develops an innovative approach to identify emerging risks from routine airline operations using FDR data, which combines the strength of data mining and the knowledge of domain experts: data mining techniques are applied to detect abnormal flights from FDR data, and then abnormal flights are referred to domain experts for in-depth analysis to identify emerging risks.
The objectives of this research are:
1) Develop algorithms to detect abnormal flights from FDR data without pre-specification of parameter limits.
The objective of the algorithms is to identify abnormal flights from FDR data without pre-specification of detection scope. The detection is independent of prior knowledge of safe operations or specification of risks. The algorithms will detect flights based on data patterns, rather than testing a limited set of hypotheses, possibly exposing unknown issues.
2) Develop data visualizations to support expert reviewing abnormal flights.
The flights detected by data mining method are not always operationally significant. They need to be referred to domain experts for an in-depth review. Data visualization tools are developed to help experts interpret results and quickly identify what is abnormal about flights detected by the algorithms.
1.4
Research Overview
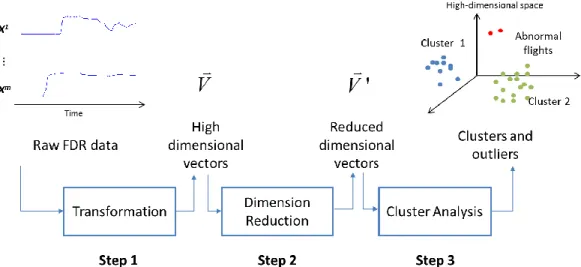
In order to identify unknown issues from routine flights’ FDR data, this thesis proposed a new approach that uses data mining techniques to process FDR data efficiently, and it relies on domain experts to interpret the results and operational implications. Cluster analysis is used to detect flights of potential interest from FDR data, and these flights are referred to domain experts for in-depth analysis via data visualization tools developed in this thesis. An overview of the approach developed in this thesis is illustrated in Figure 1.5.
majority of these flights demonstrate similar patterns in their FDR data. Assuming the majority are safe, flights with uncommon data patterns indicate abnormal situations, which might indicate increased level of risk. Therefore, flights with abnormal data patterns are labeled as potentially interesting flights for further inspection. Two cluster-based anomaly detection (ClusterAD) algorithms were developed: ClusterAD-Flight and ClusterAD-Data Sample.
The second step of the approach relies on domain experts to review the flights detected by anomaly detection algorithms. The algorithms are able to detect flights with abnormal data patterns, but these flights are not necessarily abnormal by operational standards. The system relies on domain experts to review flight details to draw conclusions based on their operational experience and knowledge. Challenges of presenting raw FDR data to domain experts are identified during the research. In response, this thesis developed data visualization tools to support the review process of domain experts.
Chapter 2
Literature Review
2.1
Flight Data Monitoring
Many airlines collect and analyze flight data of routine flights. The process is generally referred as flight data monitoring, which involves data acquisition, transmission, storage and analysis, which are described in detail in this section. By reviewing a number of software tools for flight data analysis, a benchmark of current flight data analysis methods was established. Improvement opportunities were identified from the literature review, which motivated this research.
2.1.1 Flight Data Monitoring Process
Major steps in the current process of flight data monitoring include data acquisition, transmission, and analysis, as illustrated in Figure 2.1. The equipment and technology to support each step is described below.
Data acquisition and recording. Flight data are measured by hundreds to thousands of sensors on an aircraft during an entire flight. They are collected and converted into a single stream of digital format by the Flight Data Interface Management Unit (FDIMU), also named as Flight Data Acquisition Unit (FDAU), Flight Data and Management Systems (FDAMS), or other variations depending on the manufacturer and the technology used. The converted single stream of data is then sent to the Flight Data Recorder (FDR) and the Quick Access Recorder (QAR) if equipped. The FDR, known as the black box, is a crash-survivable unit that stores flight data mainly for accident investigations. The QAR is similar to FDR, but have no crash survivability case. It is normally located in the avionics bay beneath the flight deck for easier access, and records data in tape, diskette, magneto-optical, or PCMCIA media for convenient data download.
Figure 2.1 Flight Data Monitoring Process (Sagem, 2013)
Data transfer. Data stored in QAR or Digital FDR are periodically downloaded to ground stations by electronic transmission, wireless transmission, or manual data retrieval. The download period coincides with the recording memory capability of the media, or meets the operator’s need for timely analysis of flight data. Using wireless transmission can reduce data delivery delays, from several days or weeks when using manual data retrieval, to 10-15 minutes after an aircraft is landed (Teledyne Controls, 2011).
Data analysis. Once the data are downloaded from QAR or Digital FDR, they are forwarded to the Ground Data Replay and Analysis Station (GDRAS), which transforms raw digital flight data into engineering values for processing and analysis. It also consists of flight data analysis, statistical reporting, flight animation, and other analytic tools based on the configuration, which is set by objective and scope of flight data monitoring programs at the operator, such as the FOQA or Maintenance Operational Quality Assurance (MOQA) program. Software tools for data analysis are discussed in detail in Section 2.1.2. After the analysis, flight data are archived for further analysis in the future.
2.1.2 Flight Data Analysis Tools
Data analysis is the core of flight data monitoring. A number of commercial software tools are available to perform various types of analysis on flight data. They are often addressed as Ground Data Replay and Analysis Station (GDRAS) software, FOQA software, or MOQA software, most of which have one or more of the following functions – Analysis, Animation, and Reporting
Analysis. All current commercial software packages analyze flight data based on a pre-defined library of undesired events. The techniques used include exceedance detection, statistical analysis, and trend analysis. Exceedance Detection identifies pre-defined undesired operational events by checking if particular flight parameters exceed the predefined limits under certain conditions. The list of flight parameters to watch and the limits of those parameters need to be specified by safety specialists in advance. The watch list is usually chosen to coincide with the airline’s standard operating procedures, such as the pitch at takeoff, the speed at takeoff climb, the time of flap retraction, etc. Statistical Analysis creates profiles of flight, maintenance, or engineering operational data. Airlines can gain a more complete picture of its operations from those profiles, than individual exceedance events. In Trend Analysis, airlines periodically aggregate and analyze exceedance events over time—for example, the number of unstabilized approaches at a particular airport per month, over the last 12 months. This type of analysis provides valuable information to the airline, especially in terms of whether the airline’s performance is improving, holding steady, or deteriorating.
Animation. Exceedance events detected by software are selected and validated by specialists to confirm if they are unsafe operations, or if they are benign cases. Integrated 3-D flight animation is used to support the validation process. With libraries of cockpit panels, instruments, 3D aircraft models, airport runways and terrain information, flight animations can be created from the flight data, which help specialists to review what happened during the flight.
Figure 2.2 Flight Animation (Aerobytes Ltd., n.d.)
Reporting. Results from exceedance detection, statistical analysis, and trend analysis, are reported in various formats by GDRAS software. Exceedances are normally aggregated before reporting, yet individual exceedances can be examined as shown in Figure 2.3. Reports of trend analysis include aggregated exceedance information over time (Figure 2.4). Figure 2.5 shows an example of statistical analysis on airspeed deviation at 500 feet across fleet type.
Figure 2.4 Report: Events per 100 Flights (CAE Flightscape, n.d.-b)
Figure 2.5 Statistical Reports of Fleet Activity (Sagem, n.d.)
In summary, current technology and equipment have enabled flight data monitoring, analysis, and anomaly detection. Flight data can be collected during flight, downloaded to ground, and analyzed to inform airlines about the safety and efficiency of their operations. Software tools currently available focus on event-based analysis, which requires events-to-watch to be defined in advance, with specific parameter criteria. Information on those pre-defined events can be
A limitation of the event-based data analysis approach is that it only detects known issues. One needs to specify what to look for in advance. However, accidents often happen because of unknown risks. The goal of this research is to develop a method to detect unknown issues without specifying what events to detect in advance.
2.2
Anomaly Detection
This thesis proposes a new approach that detects abnormal flights from routine airline operations using FDR data and asks domain experts to interpret the results and operational implications. Thus, anomaly detection algorithms will be developed to detect anomalies from FDR data.
Anomaly detection refers to the problem of detecting an observation (or patterns of observations) that is inconsistent with the majority members of the dataset. It is also referred to as novelty detection, anomaly detection, fault detection, deviation detection, or exception mining in different application domains. A significant number of anomaly detection techniques have been developed. While some of the techniques are generic and can be applied to different application problems, many of them are focused on solving particular types of problems in an application domain.
2.2.1 Anomaly Detection Categorization
Anomaly detection varies significantly depending on the requirements and constraints of the application. The different characteristics of anomaly detection applications bring the need for developing so many diverse techniques, as how to solve the problem largely depends on how the problem is formulated.
The anomaly detection problems are classified along three aspects as summarized in (Chandola, Banerjee, & Kumar, 2009): type of input data, type of supervision, and type of anomalies (Table 2.1.)
Table 2.1 Anomaly Detection Categorization Problem Aspect Categories
Input data Binary, categorical, continuous; Univariate, multivariate;
Point data, data with structures (time series, sequences, spatial data); Type of
supervision Supervised, semi-supervised, unsupervised
Anomalies context-based outliers, instantaneous anomalies, pattern-based outliers, correlation-based outliers
Input data are the data in which anomalies are detected. The input data can be univariate or multivariate depending on the number of variables. Each variable can be binary, categorical or continuous. Moreover, the input data can also be categorized based on whether the observations are independent or not. Independent observations are referred as point data (Chandola et al., 2009). Dependent observations have temporal structure, spatial structure, or other type of structures among them. Examples are time series, sequences and spatial data. Different types of input data require different techniques to extract relevant information from raw input data.
Depending on whether training data is needed or not, anomaly detection algorithms can be grouped into supervised techniques, semi-supervised techniques, and unsupervised techniques. Supervised anomaly detection techniques build a model based on training data sets which have both nominal and outlier classes. Semi-supervised techniques only need one labeled class in the dataset, such as nominal instances (or outlier instances). Most of the semi-supervised techniques construct a representative model for the nominal behavior based on the nominal instances and detect outliers if any test instances do not fit the model. Unsupervised anomaly detection techniques do not require labeled training data, but detect outliers assumes parametric distributions of difference classes of the data, or assumes that frequent occurrences are nominal while rare occurrences are outliers.
The exact notion of an anomaly is different for different application domains. Depending on the specific definition of anomalies, detection techniques are different. The most basic type of anomaly is a data sample with values that are inconsistent with the normal3 samples in the entire
since the relations among variables might be more important than individual variable values. In the case of input data with structures, it is often more meaningful to evaluate values in a specific context. A data sample is considered as an anomaly or not depending on when and where it occurs. Thus, the anomalies of interest might be sudden changes in time series, location specific deviations in spatial data, etc. Moreover, one might be interested in the patterns of temporal/spatial changes in the data, rather than values of individual data samples. Therefore, the pattern-based outliers are detected by examining trends over time/space, ordering of sequences, and frequency of occurrence.
2.2.2 Anomaly Detection in This Research
The objective of the anomaly detection in this thesis is to detect abnormal flights within routine flight data without prior knowledge. The problem has the following characteristics:
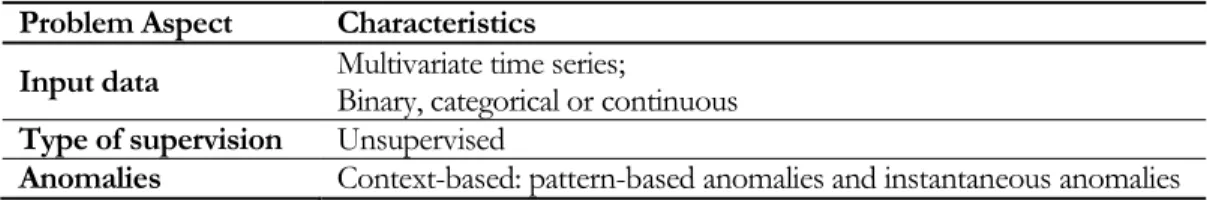
The input data are multivariate time series, which are continuous, categorical or binary depending on the flight parameter.
Unsupervised techniques are required by the nature of the main objective of the thesis: detecting abnormal flights without prior knowledge.
The anomalies to detect are context-based and include both pattern-based anomalies and instantaneous anomalies. Context-based means that a data sample is considered as an anomaly or not depending on when it occurs. A modern aircraft is operated under many different system states. Whether a set of values is abnormal or not depends on which specific mode that aircraft is at that time. Within context-based anomalies, two types are of interest to detect: pattern-based anomalies which have abnormal patterns over a period of time, and instantaneous anomalies are instantaneous observations that are abnormal. Techniques used to detect these two types of anomalies are different.
Table 2.2 Characteristics of Anomaly Detection in This Research Problem Aspect Characteristics
Input data Multivariate time series; Binary, categorical or continuous Type of supervision Unsupervised
No existing anomaly detection technique can be directly applied to the anomaly detection problem in this thesis. The following literature review of anomaly detection methods are centered on approaches related to the anomaly detection problem in this thesis.
2.3
General Anomaly Detection Techniques
Many anomaly detection techniques have been developed to address anomaly detection problems in many application domains. Three main approaches have been taken: statistical approach, classification approach, and clustering approach. The categories are not mutually exclusive as some of the techniques adopt concepts from more than one basic approach. (Chandola et al., 2009; Hodge & Austin, 2004) provide the most recent and extensive review of the anomaly detection techniques in various domains. Typical techniques and algorithms of each approach are reviewed in this part.
2.3.1 Statistical Anomaly Detection Approaches
The earliest approaches used for anomaly detection were based on statistical models (Hodge & Austin, 2004). In these approaches, a statistical distribution of data is assumed or estimated during training phase. Whether a data instance is an outlier or not depends on how well it fits the distribution.
The most popular distribution assumed in this type of work is Gaussian model. The parameters of the Gaussian model are estimated in the training phase using techniques like Maximum Likelihood Estimates. Then statistical tests are used in the testing phase to determine if a given sample belongs to the distribution or not. Common outlier statistical tests include the Box-Plot rule (Laurikkala, Juhola, & Kentala, 2000), the Grubbs test (Anscombe & Guttman, 1960; Grubbs, 1969; Stefansky, 1972), and variants of the Grubb test (Gibbons, Bhaumik, & Aryal, 2009; Rosner, 1983).
Many techniques using a mixture of parametric models were developed for the situations in which a single statistical model is not sufficient to represent the data. If both normal and abnormal training data are available, separate parametric distributions are modeled for normal cases and abnormal cases using Expectation Maximization (EM) (Byers & Raftery, 1998; Eskin,
training data are available, a mixture of models for only normal data is developed. The test data are considered as outliers if they do not belong to any normal models.
Another type of the statistical approaches uses non-parametric techniques that do not assume the knowledge of the data distribution. One stream of the non-parametric techniques was based on histogram analysis (Endler, 1998; Hofmeyr, Forrest, & Somayaji, 1998). Another stream was the kernel-based approaches, which approximate the density distribution using kernel functions (Desforges, Jacob, & Cooper, 1998).
The statistical approach was traditionally developed for univariate data, or multivariate data with known distributions. Most of the techniques are not directly applicable to complex unknown data because this approach is effective for analysis with independent variables. However, the statistical approach is the basis of many other techniques, which are built on statistical concepts. Many techniques convert the original multivariate problem into simple data representation (e.g. univariate) in order to use the basic statistical approach.
2.3.2 Classification-based Anomaly Detection Approaches
The classification methods are used in supervised learning, which requires a training data set with examples of normal cases and (or) abnormal cases. In the training phase, boundaries between classes are created from learning the labeled data. Then in the testing phase, the trained classifier is used to assign a test data instance into one of the classes. Classification models used in this approach include neural networks, Bayesian networks, Support Vector Machines(Cortes & Vapnik, 1995), decision trees and regression models.
However, a dataset with both normal and abnormal class labels is not available for training in many anomaly detection problems. Variations and extensions of the traditional classification techniques are developed to perform semi-supervised learning. One-class classification (Tax & Duin, 1999) was developed to distinguish one class of objects from all other objects. Typically, data belonging to the normal class are available for training. Outliers are the data instances that fail to be classified into the normal class. Occasionally, only examples of abnormal cases are known. Anomalies are detected by testing data instance in the learnt anomaly dictionaries (Cabrera & Lewis, 2001).
The classification-based techniques are not directly suitable to address the anomaly detection problem in this research because the goal is to detect anomalies without prior knowledge of what is “normal” and what is “abnormal”.
2.3.3 Cluster-based Anomaly Detection Approaches
Cluster analysis refers to techniques that identify groups of data points such that data points in the same group are similar to each other than to those in other groups. The groups of data points are called as clusters in these techniques.
Cluster-based anomaly detection techniques detect objects that do not belong to any cluster, or belong to very small clusters, assuming normal data are grouped in dense and large clusters. There are several different ways to perform the cluster analysis, such as partition-based, hierarchy-based, proximity-hierarchy-based, etc.
Partition-based clustering
K-means is the most basic and representative technique in this category. It partitions the observations into k clusters to minimize the intra-cluster difference and maximize the inter-cluster difference. It finds the “gravity” center of each cluster, named centroid. When it is used for anomaly detection, the clustering is usually performed on training data that only have normal classes. The centroids (or medoids) are considered as normal prototypes. The most distant point in a cluster determines the radius of that cluster. A test instance is compared with the k prototypes. The outlierness is measured by comparing the distance to the centroid with the cluster radius. Variations of k-means include k-medoids that chooses observations as centers, and fuzzy c-means that allows for fuzzy partition, rather than hard partition.
K-means has been used for novelty detection in online news and stories (Allan, Carbonell, & Doddington, 1998), and k-mediods has been used for fraud detection (Bolton & Hand, 2001). CLARANS is a popular k-medoids based algorithm, which can detect outliers as a by-product of the clustering process (Ng & Han, 1994).
The biggest limitation for the partition-based clustering algorithms is that the number of clusters needs to be specified in advance. If the number of clusters is not assigned appropriately, the clustering structure obtained can be ill-defined.
Hierarchical clustering
A hierarchical clustering method seeks to build a hierarchy of clusters. Two types of hierarchical clustering methods are often distinguished: agglomerative and divisive, depending upon whether a bottom-up or top-down strategy is followed. In the agglomerative method, each object is in its own cluster at the bottom of the hierarchy, and pairs of clusters are merged based on similarity as one moves up the hierarchy, until all the objects are in a single cluster or until certain termination conditions are satisfied. The divisive approach works in the opposite way. In either approach, two measures are needed to decide how to merge (or split) the clusters: a measure of pairwise distance between observations, and a linkage criterion that specifies the dissimilarity between sets. The results of clustering are usually presented in a dendrogram. A hierarchy offers the clustering structure at various levels, so data can be reviewed for novelty at a fine-grained or less specific level. The basic hierarchical clustering method was not efficient in handling large datasets. BIRCH (Zhang, Ramakrishnan, & Livny, 1996) and CURE (Guha, Rastogi, & Shim, 1998) are two examples of the algorithms that employ hierarchical approach to clustering large datasets.
Hierarchy clustering is usually performed as a descriptive task before anomaly detection. Algorithm parameters for anomaly detection are better selected after understanding the data distribution. Hierarchy can also be directly used to identify outliers. For example, Baker et al. (1999) employs the hierarchical approach in news story monitoring.
Proximity-based clustering
The proximity-based approaches find clusters by measuring how close a point is to its neighbors, assuming points in a cluster are close to each other and have similar proximity to its neighbors. The distance function needs to be defined to measure the proximity. DBSCAN is a common proximity-based clustering algorithm (Ester, Kriegel, Sander, & Xu, 1996). A cluster starts with k points within distance neighborhood (the density criterion), and grows by finding the neighbors of the points already in the cluster which satisfy the density criterion. Outliers are the points that cannot form a cluster. The method does not require prior knowledge of the number of clusters in the data. Clusters are automatically formed until all data points have been processed. DBSCAN is used for one of the anomaly detection algorithms developed in this thesis.
Some techniques were developed with the only objective of detecting outliers. Outliers are identified in an optimized way, rather than as a by-product of clustering. The algorithm developed by (Breunig, Kriegel, Ng, & Sander, 2000) assigns an outlier score to every data point, referred as Local Outlier Factor (LOF), which is calculated by comparing the local density of an object to the local densities of its neighbors. Points that have a substantially lower density than their neighbors are considered outliers. LOF shares the similar concepts with DBSCAN and OPTICS in measuring density. LoOP (Kriegel, Kröger, & Zimek, 2009) was developed to overcome the problem of how to interpret the numeric outlier score in determining whether a data object indeed is an outlier. The LoOP technique provides an outlier score in the range of [0, 1] that is directly interpretable as a probability of a data object for being an outlier.
Along the proximity-based clustering, many techniques were developed to overcome the limitations of DBSCAN. DENCLUE (Hinneburg & Keim, 1998) was built on a firm mathematical basis and has good clustering properties in handing noise. The OPTICS algorithm (Ankerst, Breunig, Kriegel, & Sander, 1999) provides information of the intrinsic clustering structure that offers additional insights into the distribution of the data.
Besides the three clustering approaches introduced above, many other clustering techniques have been developed recently. The efforts were made to address problems with high dimensionality, large datasets, and time series. Some techniques use different measures for similarity, such as connectivity-based measures, angle-based measures, etc. Some techniques focused on reducing dimensions, such as subspace clustering and projected clustering. Since the research problem is a multivariate time series problem, the methods developed for time series are reviewed separately in Section 2.4.
The cluster-based approaches suit the requirements of this research problem the best among the basic anomaly detection approaches. One advantage is that cluster-based approaches do not have to be supervised. Moreover, they are capable of being used in an incremental mode. After learning the clusters initially, new flights data can be fed and tested for outliers, and the clusters can be updated with the new data.
Lastly, the three groups of anomaly detection approaches are not mutually exclusive. Some anomaly detection techniques combine different approaches together. For example, the Gaussian
clustering approach. A GMM is a parametric probability density function represented as a weighted sum of Gaussian component densities(Dempster, Laird, & Rubin, 1977; McLachlan & Basford, 1988; Reynolds, 2008). When it is used for anomaly detection, a mixture of Gaussian components for normal data is developed. Each component is a multivariate Gaussian that represents a type of normal data. The test data are considered as anomalies if they do not belong to any Gaussian component. Compared to K-means, GMM is able to give statistical inferences on clusters. Because of its flexibility and statistical features, GMMs have been commonly used to model complex multivariate data for a number of applications, most notably speech recognition(Reynolds, 2008). It is chosen to perform cluster analysis in one of the anomaly detection algorithms developed in this thesis.
2.4
Anomaly Detection Techniques for Time Series
Anomaly detection in time series has gained great interest due to an increasing need in many domains. In a wide range of fields, a huge amount of data is collected at specific time intervals and each sample is linked to previous and upcoming values; yet, it is challenging to utilize the collected data effectively. Most of the techniques described in Section 2.3 are dedicated to non-structured data and therefore are not adapted to exploit temporal relationships among observations. The special constraints and requirements brought by time series generate a number of specific anomaly detection techniques (Chandola et al., 2009). The clustering techniques for time series were reviewed in (Liao, 2005). A broader view on all kinds of data mining techniques for data streams was provided in (Gaber, Zaslavsky, & Krishnaswamy, 2005).
Common techniques for anomaly detection on time series data are reviewed in this part. Despite their differences, all of the techniques have two basic components: measuring the dissimilarity between time series, and identifying outliers based on the dissimilarity. The former component is the key for time series techniques. The latter component often applies one of the techniques described in Section 2.3 directly or with modifications. Thus, the techniques are grouped into two categories based on how the dissimilarity is measured: data-based and model-based as shown in Figure 2.6.
Figure 2.6 Categorization of Anomaly Detection Techniques for Time Series
2.4.1 Data-based Approaches
Data-based approaches measure the dissimilarity between two time series based on data observations directly, without fitting the data into a model. The dissimilarity is measured by a distance function, which differs by technique.
Euclidean distance. Approaches in this category measure the dissimilarity between two time series by aligning observations according to a temporal reference, and calculate the difference between every observation. They transform the sequential data into a vector of attributes and then calculate the Euclidean distance between vectors. The attribute value is determined by the value at each time. Then the problem of time series becomes a problem of static data with high dimensions. For example, a time series with a length of 50 samples can be converted to a vector of 50 dimensions. The temporal information is kept by increasing the number of dimensions. The similarity can be measured in the vector space using the standard Euclidean distance, the root mean square distance, Mikowski distance, or any other variations. This approach has been adopted in a wide range of time series analysis, such as identifying cyclone regimes in weather
Anomaly Detection for Time Series
Data-based Approaches Euclidean distance Dynamic time warping distance Probability-based distance Correlation-based distance Model-based Approaches Regression model Markovian model Compression model
(Gariel, Srivastava, & Feron, 2010), etc. Box Modeling was introduced as a transformation technique to incorporate un-equal length sequences (Chan & Mahoney, 2005). In general, Euclidean distance is very sensitive to any shift in the data. If two samples are not perfectly aligned, the distance can be huge. Also if the event involves several phases that can shrink or expand, Euclidean distance does not perform well, e.g. it is useless in voice recognition.
Dynamic time warping distance. Dynamic time warping (DTW) aligns two time series so that their difference is minimized. The DTW distance measures the dissimilarity between two series after an optimal alignment under certain constraints. Many algorithms use DTW as data pre-possessing step before clustering or anomaly detection (Keogh, Lonardi, & Ratanamahatana, 2004). High-level patterns in the time series can be better compared by minimizing small shifts in time.
Probability-based distance. Some techniques extract probability information of each time sample from time series, rather than using raw data. Kumar & Woo (2002) assume each time series is made of samples drawn from Gaussian models, and then calculate the Chi-square statistics for every pair of time series as the similarity measure for hierarchical clustering. The distance function is scale-invariant so that clustering results are independent of the units of measuring data.
Correlation-based distance. The correlations between time series are used to measure dissimilarity in this approach. Various measures of correlation can be used. Golay et al. (1998) include the Peason’s correlation factor in a distance function. Möller-Levet, Klawonn, Cho, & Wolkenhauer (2003) proposed Short Time Series distance (STS) that measures the differences of slopes in two time series.
2.4.2 Model-based Approaches
Model-based approaches utilize the temporal structure in the time series. Time series models or sequence models are built based on the raw data. Then time series are compared based on the parameters of the models, or the residuals obtained from the models.
Regression model. Regression-based models are one of the earliest and widely used methods in modeling time series. Residuals or errors between the model prediction and the actual observation are used as the indicator of outlierness. Rousseeuw & Leroy (1987) gave a comprehensive description on the use of robust regression to build models and detect outliers. Fox (1972) modeled
time series as an auto-regressive process (AR). Autoregressive moving average (ARMA) models were used in (Abraham & Box, 1979; Abraham, 1989). The autoregressive integrated moving average (ARIMA) model, a generalization of ARMA, was used in (Bianco, et al., 2001).
Markovian model. The markovian models are the most popular approach to model sequential behaviors in the time series that are not properly aligned in time. Time series are modeled using a Markov chain, Hidden Markov Model (HMM), or Finite State Machine (FSM). The outlierness of a sequence is determined by the likelihood of that sequence computed by a learnt model, or the difference between a prediction and an actual event. A great number of anomaly detection techniques has been developed using Markovian models, eg. Markov chain-based approaches (Ihler, Hutchins, & Smyth, 2006; Smyth, 1994). HMM-based techniques include (Boussemart, Las Fargeas, Cummings, & Roy, 2009; Ilgun, Kemmerer, & Porras, 1995; Sekar et al., 2002; Warrender, Forrest, & Pearlmutter, 1999). Most of data used in HMM approaches are symbolic sequences, so time series consisting of continuous values are converted to symbolic sequences before building Markovian models (Srivastava, 2005).
Compression model. Another branch of techniques extracts features from the time series using some compression methods, such as wavelet transformation, Fourier transformation, and Principal Component Analysis (PCA). The dissimilarity between time series is calculated based on extracted features. For example, (B. Amidan & Ferryman, 2000) summarized a time series by four coefficients (intercept, slope, quadratic, and error) using a quadratic equation model. (Vlachos, Lin, Keogh, & Gunopulos, 2003) presented an approach to cluster time series at various resolutions using the Haar wavelet transform.
2.5
Anomaly Detection in Aviation
Anomaly detection in aviation systems has been focused on detecting defects on mechanical components in the past. Recently, more studies have been conducted to model and monitor complex systems. (B. Amidan & Ferryman, 2000; B. G. Amidan & Ferryman, 2005) were earliest efforts made to identify atypical flights using onboard recorded flight data. A software package called the “morning report” tool was developed. In their approach, each time series was summarized by four coefficients using quadratic equation model and then an “atypical score” for
features in the signal may not be captured by just four parameters. Second, using Mahalanobis distance as the only measure to detect outliers is not the best approach, as the distribution of flights in the feature space is complex and cannot be measured only by the distance to origin. Maille & Statler (2009) compared the “morning report” tool with the traditional FOQA analysis software on a set of digital flight recorded data. The study showed some potential value of using the “morning report” tool in finding newly emergent patterns. However, the performance and effectiveness of the “morning report” was not explicitly evaluated.
Some studies focused on detecting anomalies in discrete data. (S. Budalakoti, Srivastava, & Akella, 2006; Suratna Budalakoti, Srivastava, & Otey, 2008) developed an algorithm called sequenceMiner to discover anomalies in discrete parameter sequences recorded from flight data based on the Longest Common Subsequence (LCS) measure. Both clustering analysis and Bayesian model were used in this algorithm. (Srivastava, 2005) proposed a statistical framework that can work with both continuous data and discrete data based on HMMs. In the framework, the continuous data were pre-processed to symbolic data with a few representative states using clustering analysis, and then they were treated equally as the discrete data.
In another group of studies, normal behavior data were available and hence supervised or semi-supervised learning was the primary approach. (Iverson, 2004) developed the Inductive Monitoring System (IMS) software for real time monitoring of complex system. IMS used nominal data sets to extract general classes for typical system behaviors. During testing, real time operational data were compared with these classes to find any abnormal behaviors. Two application examples were presented, one for monitoring temperature sensors in the wings of a Space Shuttle Orbiter, and one for analyzing archived telemetry data collected from the ill-fated STS-107 Columbia Space Shuttle mission. (Schwabacher & Oza, 2007) compared four anomaly detection algorithms using data from two rocket propulsion testbeds. The four algorithms were Orca (Bay & Schwabacher, 2003), GritBot (RuleQuest Research software package), IMS (Iverson, 2004) and SVM (Tax & Duin, 1999). Except for Orca, training data were required for all four algorithms. They were designed for general complex systems, rather than explicitly for aerospace systems. Thus, temporal structures cannot be directly captured. (Das, Matthews, Srivastava, & Oza, 2010) introduced an approach based on kernel learning to incorporate the temporal structure. The method was a semi-supervised approach as it used one-class SVM for anomaly detection.
Some other studies on applying data mining techniques in aviation were generated due to the recent fast development in data mining techniques. (Larder & Summerhayes, 2004; Treder & Craine, 2005) were two examples that demonstrate the use of data mining techniques on various data collected at airlines, such as recorded flight data, safety reports, maintenance logs, etc. These two studies showed potential values of using data mining techniques in analyzing large amounts of data to find causalities, such as finding associations between incidents and flight information. However, anomaly detection problems in this research were not addressed in these studies.
Chapter 3
Cluster-based Anomaly Detection
Algorithms
3.1
Challenges in Detecting Anomalies in FDR Data
This thesis develops a new approach to identify unknown issues from FDR data of routine airline flights. The new approach detects flights of interest without specifying what to look for in advance, and then relies on domain experts to review detected flights for operational implications. It is a step forward compared with existing methods, which rely on fixed flight parameters watch-list and predefined thresholds. Two challenges are identified in developing anomaly detection algorithms in this thesis:
The first challenge is detecting flights of interest from FDR data without specifying what to look for. No simple formulas can explain multivariate relationships among parameters as well as their temporal patterns. In general, flight parameters recorded in raw FDR data vary widely over time. An individual flight parameter is often associated with others depending on flight dynamics, specific procedures, and various environmental conditions. When one flight parameter changes, it will affect a number of others accordingly.
The second is the absence of prior knowledge on standard data patterns. Most existing anomaly detection methods assume one standard pattern, thus considering deviations from the standard as anomalies. However, multiple standard patterns exist in real-world operational data. Different phases of flight and variations in operational procedures, such as airport-specific procedures, air traffic control requirements, and company policies, may result in different data patterns. The assumption of one standard pattern is therefore not valid. The anomaly detection method in this thesis should be able to handle multiple standard patterns in the FDR data.
3.2
Concept
of
Cluster-based
Anomaly
Detection
Algorithms
This section presents the concept of cluster-based anomaly detection algorithms and terminologies used in describing the algorithms: cluster, outlier, anomalies, and abnormal flights.
Two anomaly detection algorithms were developed to detect abnormal flights using the cluster-based concept. Cluster analysis is used to identify common patterns in FDR data. Multiple patterns exist in real-world operational data, however, the number of common patterns is finite because operations of commercial airline flights are highly standardized and a majority of flights share a few most common data patterns.
To facilitate cluster analysis, a prior step is to transform raw FDR data into high dimensional vectors, on which cluster analysis can be performed. The transformation can be performed in two ways: 1) convert the data of each flight for a specific phase into a vector 2) convert each data sample of the original FDR data into a vector. Both techniques were explored and developed into two detection algorithms: ClusterAD-Flight and ClusterAD-Data Sample. Details of each method will be presented in later sections in this chapter.
After data transformation, cluster analysis is performed on vectors in the high dimensional space. Groups of proximate vectors are identified as clusters, which represent common data patterns in the dataset; vectors that do not belong to any clusters are detected as outliers, which indicate uncommon data patterns.
In the last step, anomaly detection is performed based on cluster analysis result. In ClusterAD-Flight, outliers identified in cluster analysis are the anomalies to detect. In ClusterAD-Data Sample, both outliers and vectors that do not belong to appropriate clusters are the
anomalies that we want to detect. Finally, the anomalies are summarized by flight. Abnormal flights are flights that have relatively more or severer anomalies.
Figure 3.1 Concept of Cluster-based Anomaly Detection
Figure 3.2 Framework of Cluster-based Anomaly Detection
3.3
Pattern-based
Anomalies
and
Instantaneous
Anomalies
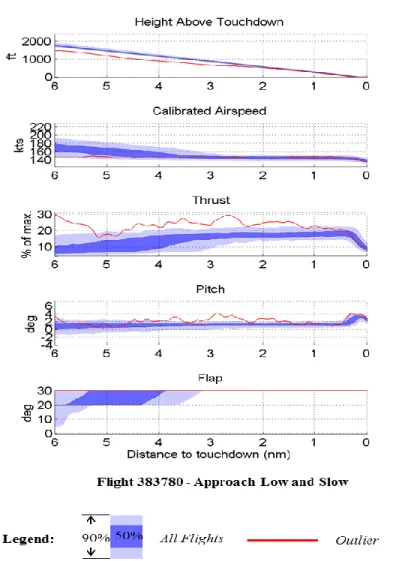
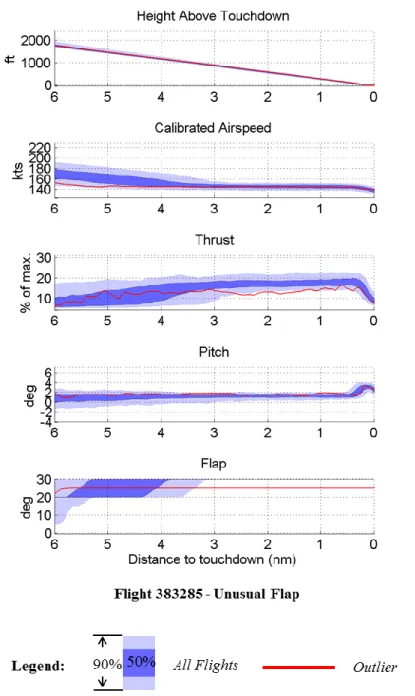
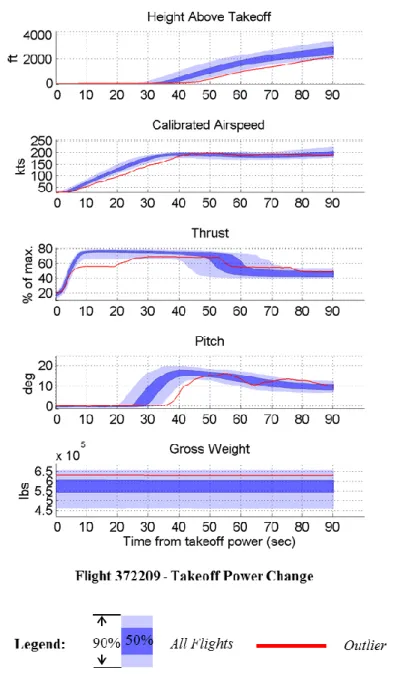
Anomalies in FDR data can be categorized in two types: pattern-based anomalies and instantaneous anomalies. Figure 3.4 and Figure 3.5 shows examples of these two types of anomalies. In these two plots, anomaly signal is depicted in red. A normal profile is presented by blue areas – the center blue line shows the median of normal values, the dark blue area gives the range of 50% of normal values, and the light blue area depicts the range of 90% of normal values.
Pattern-based anomalies are data with abnormal patterns over a specific flight phase. As shown in Figure 3.4, pattern-based anomalies are observed in engine parameter “N1”, which measures fan speed and is representative of engine thrust. The profile of “N1” is different from the normal profile from 6nm before touchdown to 1nm before touchdown; each individual data sample is not significantly deviating from the normal value. In comparison, instantaneous anomalies are abnormal data that occurs instantaneously. Figure 3.5 gives an example of an instantaneous anomaly in “Angle of Attack”.
The objective of anomaly detection in this thesis is to detect both types of anomalies. Because distinct data transformation techniques are used in ClusterAD-Flight and ClusterAD-Data Sample, we expect the two methods to be sensitive to different types of anomalies. Thus, an evaluation on which types of anomalies are better detected by which method was performed in this research.
3.4
ClusterAD-Flight
ClusterAD-Flight converts data of an entire flight phase into a single point in a high-dimensional space, where data patterns are represented by vectors. It then uses cluster analysis to identify clusters and outliers in the high-dimensional space. Anomalies are detected from such outliers. ClusterAD-Flight consists of three key steps, as illustrated in Figure 3.6:
1. Data transformation: transforming time series into high-dimensional vectors
2. Dimension reduction: addressing problems of multicollinearity and high dimensionality 3. Cluster analysis: identifying clusters and outliers in high-dimensional space
The first step transforms multivariate time series data into high dimensional vectors. The transformation technique anchors time series by a specific event, such as touchdown, which reserves the temporal information and makes it comparable among different flights. Then, in the second step, techniques are developed to address problems of multicollinearity and high dimensionality. The dimensionality of vectors is reduced for computational viability while maintaining essential information. In the last step, cluster analysis is performed to detect outliers and clusters of normal flights in the feature space of reduced dimensions. Each step is described in detail in the following paragraphs.
ClusterAD-Flight is limited to flight phases that start or end with a specific event: takeoff or final approach. These two phases are critical phases in terms of safety because 53% of fatal accidents and 47% of onboard fatalities happened during those two phases for worldwide commercial jet fleet from 2002 to 2011 (Boeing Commercial Airplanes, 2012).
Figure 3.6. Cluster-based Detection Algorithm: ClusterAD-Flight
3.4.1 Data Transformation
In order to map raw data into comparable vectors in the high dimensional space, time series data from different flights are anchored by a specific event to make temporal patterns comparable. Then, every flight parameter is sampled at fixed intervals by time, distance or other reference from the reference event. All sampled values are arranged to form a vector for each flight:
]
,
,
,
,
,
,
,
,
,
[
1 2 1 2 1 1 1 n j n t m t m t m t i t t tx
x
x
x
x
x
x
where tj ix
is the value of the ith flight parameter at sample time tj; m is the number of flight
parameters; n is the number of samples for every flight parameter. The total dimensionality of every vector is m*n. Each dimension represents the value of a flight parameter at a particular time. The similarity between flights can be measured by the Euclidian distance between the vectors.
Raw FDR data are anchored from a specific event and sampled at fixed intervals by time, distance, or other reference. For the takeoff phase, the time of takeoff power application is used as the reference time and a number of samples are obtained at fixed time intervals, as shown in Figure 3.7. For the approach phase, the time series are first transformed into a “distance-series” and then a number of samples are obtained backtracking from the touchdown point (Figure 3.8).
Distance is used as the reference rather than time in the approach phase as procedures during approach are often specified based on distance or height above ground.
Figure 3.7. Sampling Time Series in Takeoff Phase
Figure 3.8. Sampling Time Series in Approach Phase
3.4.2 Dimension Reduction
Because of the temporal aspect, the vectors formed in the first step will normally have thousands of dimensions. For example if 100 parameters are evaluated over 100 time steps, this will result in an 10,000 dimension analysis space. In comparison, the number of daily flights at a large airline is on the order of 1000 flights. This implies the typical daily dataset will have more
dimensions than data points. It is difficult to identify data clouds in such sparse distribution. Therefore, Principal Component Analysis (PCA) was used to reduce the number of dimensions before performing cluster analysis. PCA is a common procedure to transform data into an orthogonal coordinate system based on the variance in the data (Hotelling, 1933). The coordinates in the new system are referred as components. The largest variance by any projection of the data comes to lie on the first component, the second largest variance on the 2nd, and so on. As a consequence, a number of last components could be dropped to reduce the hyperspace dimension without losing significant information. In this study, the first K components that capture 90% of the variance in the data are kept.
% 90 1 1
N i i K i i whereiis the variance explained by principal component i. N is the total number of principal components, which equals to the original number of dimensions. K is the number of principal components kept. The magnitude of dimensional reduction will vary with the dataset but can be significant. As an example, in the initial testing of ClusterAD-Flight discussed later in this chapter (Section 3.5), the dimensions were typically reduced from 6188 to 77 for the takeoff data and from 6279 to 95 for the landing data using this criterion.
The use of PCA is unnecessary for large datasets that are dense enough to apply cluster analysis. However, anomaly detection could be biased by correlations among parameters in the absence of PCA. For example, if a majority of parameters in a FDR dataset are engine related, anomalies would be dominated be engine problems in the absence of PCA. Correlations between parameters are common in FDR datasets. As an example, linear correlations among parameters in the dataset used in the initial testing of ClusterAD-Flight are shown in Figure 3.9.