HAL Id: hal-01880711
https://hal.umontpellier.fr/hal-01880711
Submitted on 26 May 2020
HAL is a multi-disciplinary open access
archive for the deposit and dissemination of sci-entific research documents, whether they are pub-lished or not. The documents may come from teaching and research institutions in France or abroad, or from public or private research centers.
L’archive ouverte pluridisciplinaire HAL, est destinée au dépôt et à la diffusion de documents scientifiques de niveau recherche, publiés ou non, émanant des établissements d’enseignement et de recherche français ou étrangers, des laboratoires publics ou privés.
Distributed under a Creative Commons Attribution - NonCommercial - NoDerivatives| 4.0
Increase in insulin sensitivity by the association of
chicoric acid and chlorogenic acid contained in a natural
chicoric acid extract (NCRAE) of chicory ( Cichorium
intybus L.) for an antidiabetic effect
Karine Ferrare, Luc Bidel, Abdulmomem Awwad, Patrick Poucheret,
Guillaume Cazals, Françoise Lazennec, Jacqueline Azay-Milhau, Michel
Tournier, Anne-Dominique Lajoix, Didier Tousch, et al.
To cite this version:
Karine Ferrare, Luc Bidel, Abdulmomem Awwad, Patrick Poucheret, Guillaume Cazals, et al.. In-crease in insulin sensitivity by the association of chicoric acid and chlorogenic acid contained in a natural chicoric acid extract (NCRAE) of chicory ( Cichorium intybus L.) for an antidiabetic ef-fect. Journal of Ethnopharmacology, Elsevier, 2018, 215, pp.241 - 248. �10.1016/j.jep.2017.12.035�. �hal-01880711�
Version postprint
Author’s Accepted Manuscript
Increase in insulin sensitivity by the association of
chicoric acid and chlorogenic acid contained in a
natural chicoric acid extract (NCRAE) of chicory
(
Cichorium intybus
L.) for an antidiabetic effect
Karine Ferrare, Luc. P.R. Bidel, Abdulmomem
Awwad, Patrick Poucheret, Guillaume Cazals,
Françoise Lazennec, Jacqueline Azay-Milhau,
Michel Tournier, Anne-Dominique Lajoix, Didier
Tousch
PII:
S0378-8741(17)33242-7
DOI:
https://doi.org/10.1016/j.jep.2017.12.035
Reference:
JEP11166
To appear in:
Journal of Ethnopharmacology
Received date: 29 August 2017
Revised date:
18 December 2017
Accepted date: 24 December 2017
Cite this article as: Karine Ferrare, Luc. P.R. Bidel, Abdulmomem Awwad,
Patrick Poucheret, Guillaume Cazals, Françoise Lazennec, Jacqueline
Azay-Milhau, Michel Tournier, Anne-Dominique Lajoix and Didier Tousch, Increase
in insulin sensitivity by the association of chicoric acid and chlorogenic acid
contained in a natural chicoric acid extract (NCRAE) of chicory (
Cichorium
intybus
L.) for an antidiabetic effect,
Journal of Ethnopharmacology,
https://doi.org/10.1016/j.jep.2017.12.035
This is a PDF file of an unedited manuscript that has been accepted for
publication. As a service to our customers we are providing this early version of
the manuscript. The manuscript will undergo copyediting, typesetting, and
review of the resulting galley proof before it is published in its final citable form.
Please note that during the production process errors may be discovered which
could affect the content, and all legal disclaimers that apply to the journal pertain.
Version postprint
Increase in insulin sensitivity by the association of chicoric acid and chlorogenic acid contained in a natural chicoric acid extract (NCRAE) of chicory (Cichorium intybus L.) for an antidiabetic effect
Karine Ferrarea1, Luc. P. R. Bidelb1, Abdulmomem Awwada, Patrick Pouchereta, Guillaume Cazalsc, Françoise Lazenneca, Jacqueline Azay-Milhaud, Michel Tournierd, Anne-Dominique Lajoixd, Didier Touscha*
a
University Montpellier, UMR 95 Qualisud, CIRAD, SupAgro Montpellier, University of Avignon, University of the Reunion,15 Avenue Charles Flahault, BP 14491, 34093 Montpellier Cedex 5, France
b
INRA, UMR AGAP, CIRAD, SupAgro, 2 Place Pierre Viala, 34060 Montpellier, France
c
University Montpellier, IBMM UMR5247, CNRS, Montpellier Cedex 5, France
d
University Montpellier, EA 7288, Biocommunication in Cardio-Metabolism, 15 Avenue Charles Flahault, BP14491, 34093 Montpellier Cedex 5, France
*
Corresponding author: Tel.: +33 411 75 95 60. didier.tousch@umontpellier.fr
ABSTRACT
Ethnopharmacological relevance
Chicory (Cichorium intybus L.) is an indigenous vegetable widely cultivated in Europe,
America and Asia. In ancient times, the leaves, flowers, seeds, and roots have been used as a
wealth of health benefits including its tonic effects, the ability to ease digestive problems and
to detoxify liver. In Indian traditional therapy, chicory was known to possess antidiabetic
effect. In the traditional medicine of Bulgaria and Italy, chicory was used as hypoglycemic
decoctions.
Aims of the studies
We wanted to obtain the complete chemical composition of the natural chicoric acid extract
(NCRAE), a chicory root extract rich in chicoric acid, which previously showed its glucose
tolerance effect in normal rats. To investigate if the whole NCRAE is required to be effective,
we performed a comparative in vivo experiment on STZ diabetic rats treated either with
NCRAE or a mixture composed of the two major compounds of NCRAE.
Materials and Methods
1
Version postprint
LC-MS method has been used to analyze the exhaustive composition of NCRAE: we have
determined that chicoric acid and chlorogenic acid represented 83.8% of NCRAE. So, we
have prepared a solution mixture of chicoric acid and chlorogenic acid named SCCAM, in
order to compare in vivo the antidiabetic effects of this last and NCRAE in streptozotocin
diabetic rats. In vitro experiments were performed on L6 cell line both for glucose uptake and
for the protective effect against H2O2 oxidative stress. Also, we have evaluated DPPH and
ORAC (Oxygen Radical Absorbance Capacity) antioxidative capacities of the two
compositions.
Results
The LC-MS analysis confirmed the high abundance of chicoric acid (64.2%) in NCRAE and a
second part of NCRAE is composed of caffeoylquinic acids (CQAs) at 19.6% with among
them the chlorogenic acid. This result has permitted us to prepare a mixture of synthetic
L-chicoric acid (70%) and synthetic chlorogenic acid (30%): the solution is designated SCCAM.
Our results showed that both NCRAE and SCCAM are able to improve a glucose tolerance in
STZ diabetic rats after a subchronic administration of seven days. Alone NCRAE allows to
significantly decrease the basal hyperglycemia after six days of treatment. To explain these
difference of effects between NCRAE and SCCAM, we have compared their in vitro effects
on the L6 muscle cell line both for the insulin sensitizing effect and for their protective action
in pretreatment against H2O2. We have also compared their antioxidant capacities. In
conclusion, we demonstrated that NCRAE, a natural extract of chicory (Cichorium intybus)
rich in CRA and CQAs improves glucose tolerance and reduces the basal hyperglycemia in
Version postprint
Graphical abstract
Keywords
Cichorium intybus L. root extract; LC-MS analysis; Chicoric acid and chlorogenic acid;
Streptozotocin diabetic rats; Antidiabetic effect; L6 cells oxidative stress assay; L6 cell
glucose uptake
Extraction / chromatography method
Root Cichorium intybus caffeoyls derivatives enriched extract Chicoric acid 70 % Chlorogenic LC-MS analysis : In vivo experiments on streptozotocin Chicoric acid 72.4 % Caffeoyl-quinic acids 19.6 %
NCRAE contained a mixture of CRA, CGA and others caffeoyl derivatives that confer this antidiabetic
- NCRAE induced a antidiabetic effect,
Version postprint
1. Introduction
Type 2 diabetes (T2D) is amongst the most common metabolic diseases worldwide. It
affected about 350 million people in 2011 and this number will achieve 550 million in 2030
(Whiting et al., 2011). To treat this illness, oral hypoglycemic agents including insulin
secretagogues such as sulfonylureas, insulin sensitizing agents such as metformin and
intestinal alpha glucosidase inhibitors such as acarbose are currently used. To restore a normal
glycemia, alternative therapeutics consisting to use natural compounds extracted from plants
are in studies. In traditional medicine, the chicory (Cichorium intybus L.) was widely used to
treat diabetes in India and Pakistan (Street et al., 2013). In their review of beneficial plants
used in the popular traditional medicine of Italy and Bulgaria, Leporatti and Ivancheva (2003)
have reported the traditional use of Cichorium intybus L. decoctions for their hypoglycemic
property. The antidiabetic effect of an alcoholic chicory extract in streptozotocin-induced
diabetic rats have been published by Pushparaj et al. (2007) and more recently by Ghamarian
et al. (2012). Often, the anti-hyperglycemic properties of the polyphenolic compounds have
been described (Cheng et al., 2003; Jung et al., 2006; Namura et al., 2003; Meng et al., 2013).
In our previous works, we have demonstrated the anti-hyperglycemic properties of a chicory
(Cichoryum intybus L.) root extract (natural chicoric acid extract; NCRAE) and a burdock
(Arctium lappa L.) root (dried burdock root extract; DBRE) extract (Azay-Milhau et al., 2013;
Tousch et al., 2014). These two Asteraceas extracts contain a lot of caffeoyl-derivatives. The
chicory extract (NCRAE), rich in chicoric acid (dicaffeoyl tartaric acid) has a in vitro ability
to increase glucose uptake in L6 muscular cell line (Tousch et al., 2008; Azay-Milhau et al.,
2013). Moreover, in vivo experiments by an intraperitoneal glucose tolerance test on normal
rats have brought evidence that NCRAE can improve glucose tolerance (Azay-Milhau et al.,
Version postprint
well documented in the literature for their antioxidant capacities (Fraisse et al., 2011;
Schlernitzauer et al., 2013; Niggeweg et al., 2004; Sato et al., 2011).
In the present work, we have investigated the antidiabetic capacity of NCRAE and
endeavored understand the part played by the two most abundant caffeoyl compounds
contained in this extract. For that, we performed initially the identification of all caffeoyl
derivatives of the extract by LC-MS analysis. On the basis of the chemical characterization of
NCRAE, we have prepared a composition named SCCAM (Synthetic Chicoric and
Chlorogenic Acids Mixture) containing the two major compounds of NCRAE, in proportion
of 70% of synthetic L-chicoric acid (CRA) and 30% of synthetic CGA. This ratio is very
close of the NCRAE CRA/CQAs ratio. We performed an in vivo experiment on streptozotocin
(STZ) diabetic rats treated by subchronic administrations of NCRAE or SCCAM. The results
have shown that the two compositions are able to improve the glucose tolerance, but only
NCRAE possesses the capacity to decrease the basal hyperglycemia in animals. To
understand the differences of effect between NCRAE and SCCAM, we have compared their
in vitro insulin sensitizing effects and their protective actions in pretreatment against H2O2 on
theL6 muscle cell line and also their antioxidant capacities.
2. Materials and methods
2.1. Biological material and drugs
Chicory (Cichorium intybus L.) plants were collected in Montpellier (France) and identified
by botanical biologists of Botanical Institute of Montpellier (Tela Botanica-Cichorium intybus
L., identification number: 2121). Natural chicoric acid extract (NCRAE) of roots was
obtained using the method previously described (Azay-Milhau et al., 2013) with
modifications. Briefly, the powder of the part of plant was poured in a cellulose cartridge and
placed in a EtOH-Water (70 : 30). The concentrated crude extract was passed through an
Version postprint
polyphenols in a EtOH-Water (40 : 60). Commercial synthetic chicoric acid (CRA) and
chlorogenic acid (CGA) were purchased by Sigma-Aldrich. For L6 rat muscular cell culture,
Dulbecco's Modified Eagle's Medium (DMEM) and Fetal calf serum (FCS) was provided
from Biochrom (Berlin, Germany). Cocktail medium, 2 mM L-glutamine,100 U/mL penicillin
and 100 µg/mL streptomycin, were purchased by Sigma-Aldrich. For diabetes induction,
streptozotocin (STZ) was also provided by Sigma-Aldrich. For LC-MS analysis, acetonitrile
(Carlo-Erba, France) and formic acid (Merck, Germany) were of HPLC-grade quality. Water
was permuted using a reverse osmosis Milli-Q system (Millipore, France). Chlorogenic acid,
L-chicoric acid, tartaric acid, quercetin-3-O-glucuronide, kaempferol-3-O-glucuronide were
provided by Sigma-Aldrich.
2.2. Chemical analysis of NCRAE by LC-MS
In a first step, the extract was characterized using a Synapt G2-S high definition mass
spectrometry system (Waters Corp., Milford, MA) equipped with electrospray ionization
source, to characterize elemental composition of parent and fragment ions. Chromatographic
separation was carried out at a flow rate of 0.4 mL.min-1 on Acquity H-Class ultrahigh
performance liquid chromatography (UPLC) system (Waters Corp., Milford, MA), equipped
with a Kinetex C18 100A column (100 x 2.1 mm, 2.6µm beads) from Phenomenex (France).
The mobile phase consisted of permuted water (solvent A) and acetonitrile (solvent B), both
phases acidified by 0.1% (v/v) formic acid. Mass spectra were acquired in the positive and
negative ionization mode with a capillary voltage of 3 kV. Tandem mass spectra were
acquired in Fast-DDA (Data Directed Analysis) mode so that the two most abundant ions in
full scan MS would trigger tandem mass spectrometry (MS2). The TOF mass analyzer was
calibrated using phosphoric acid in 1:1 (v:v) acetonitrile:H2O from 50 to 1500 m/z to obtain
mass accuracy within 3 ppm. The Synapt parameters were optimized using a chlorogenic acid
standard as follows: the sample cone was set at 20 V, the source and desolvation temperature
were set at 120 and 600 °C, respectively. Each sample was processed with MassLynx (V4.1)
Version postprint
In a second step, area of the absorbance peak of each hydroxycinnamic acid was integrated at
326 nm (maximal absorbance of CGA) and expressed as equivalent absorbance of the
authentic L-chicoric acid standard (Sigma-Aldrich, Munich, Germany). Compounds were
identified by their retention times, UV absorbance spectra, and MS fragmentation pattern and
numbered in conformity with the IUPAC numbering system (IUPAC, 1976). For peak ss m w k s r f r s L − / h r r z s fr m L d H r y (2 8), Jaiswal and Kuhnert (2011), Maruta et al. (1995). Isomers were assigned by using the
appropriate standards (chlorogenic acid, caffeic acid). Since other caffeoylquinic acid
derivatives were not commercially available, they were identified by comparison with
chromatograms of plants belonging to Asteraceae: Arctium lapa L. root and shoot extracts,
Arnica montana L. flower extract, Cynaria scolymus L. leaves, Lactuca sativa L. leaves, Taraxacum officinale WEB. ex WIGG. Comparison to the leaf extract from Coffea canephora
and Ilex paraguariensis was also necessary for dimethoxycinnamoyl-caffeolquinic acids
(Alonso-Salces et al., 2009).
2.3. In vivo experiments
Experiments were performed in male Wistar rats from Charles River Laboratory (Lyon,
France) and maintained on a 12h/12h light dark schedule. Institutional guidelines for animal
care and use were followed and the ethical committee Languedoc-Roussillon agreed our
protocol (number 101). Diabetes was obtained by intraperitoneal injection of STZ at the dose
of 65 mg.kg-1 in rats weighing 300-320 g and thereafter maintained in individual metabolic
cages. Seven days after diabetes induction, animals were divided in three groups ( four
animals by group). The first group received a daily intraperitoneal (IP) administration of
NCRAE at the dose of 15 mg.kg-1 dissolved in saline for 7 days. The second cohort of
diabetic rats were treated by IP injections for 7 days with the SCCAM (15 mg.kg-1). The last
group of diabetic animals received only IP saline as controls. During the treatments, we
studied the time course of the following parameters: body weight, food intake,
Version postprint
oral glucose tolerance test (OGTT, glucose 3 g.kg-1). Blood samples were collected from the
tail vein of unfasting rats for plasma glucose determinations. For OGTT, animals were fasted
for 4 h. Plasma and urinary glucose determinations were performed using the Glucose
GOD-PAP kit (BIOLABO SA, France). Results are expressed as mg.dL-1 for glycemia. In addition,
for a better analysis of the time course of glycemia, values were calculated in % from basal
values. Glycosuria evaluations were expressed as the urinary volume per 24 h x urinary
glucose concentrations (g/24 h).
2.4. Determination of total polyphenol content
Total polyphenol content was determined by using the Folin-Ciocalteu reagent (Singleton and
Rossi, 1965). Samples (50 µg) was diluted in a final volume of 1 mL with 0.2N of
Folin-Ciocalteu reagent in water and were incubated in the dark at ambient temperature for 30
minutes. Discoloration was estimated by spectrophotometry analysis at 665 nm. Gallic acid
(GA) was used as the standard for curve calibration. The total phenol content of extracts was
expressed as mg of GAE (equivalents GA) per g of dry extract.
2.5. 2-Glucose uptake test on L6 cells.
L6 rat myocyte cells (LGC Promochem, France) were cultured in 12-well plates as previously
described by Tousch et al. (2008). Briefly, on the day of the experiment, cells were first
starved during 4 h in DMEM supplemented with 0.1% BSA and then incubated during one
hour in KRB supplemented with 0.1% BSA, 5 mM glucose in the absence or in the presence
of 100 nM insulin. The two compounds at 50 µg.mL-1 were tested in the presence of 100 nM
insulin. Cells were then gently washed and then incubated in 1 ml KRB containing 0.5 µCi
[3H] deoxyglucose per well. Uptake was stopped by three washings in cold PBS and cells
were lysed in 0.1N NaOH. Radioactivity was measured and total protein concentration
evaluated by a Bradford method (Bradford, 1976); results are expressed in cpm . mgprotein-1
Version postprint
2.6. Survival test at an H2O2 oxidative stress on L6 cells.
The L6 cell culture has been managed as described above. Cells were seeded in 96-well plates
(104 cells per well). On day 4, the culture medium was changed by an DMEM supplemented
with FCS, cocktail medium and with the different extracts at the final concentration of 50
µg.mL-1 during 12 h. The next day, the cells were washed twice by 200 µL per well of
Krebs-Ringer bicarbonate buffer, 0.1% BSA and then placed in the same buffer (200 µL per well)
with or without H2O2 at 40 µM. After three hours of incubation at 37°C in a 5% CO2
chamber, cells were washed once by PBS and incubated 5 min in 100 µL of Trypan-blue
(Sigma-Aldrich) solution diluted by 3 with PBS. The trypan-blue solution was eliminated and
the cell layers were visualized by Stereo Zoom Microscope for Large Fields with 16 x zoom
(Axio Zoom.V16, Zeiss) with a magnification of 40%. The images were checked in and the
blue color densities were calculated using ImageJ 1.48v (Image Processing and Analysis in
Java: https://imagej.nih.gov/ij/) software (Schneider et al., 2012). The data are expressed as %
of mortality.
2.7. Evaluation of the antioxidant capacities
We used both the DPPH (2,2-diphenyl-1-picryl-hydrazyl-hydrate) and the ORAC (Oxygen
Radical Absorbance Capacity) tests. For DPPH test, we have used 100 nmoles of DPPH by
assay with different quantities of samples. The decrease of absorbance at 517 nm were
quantified on spectrophotometer as described by Villano et al. (2007). The free radical
scavenging activity of an extracts is defined by the IC50, i.e., the quantity of sample needed to
obtain 50% of inhibition of the DPPH absorbance. Using quercetin standard (with an IC50 of
20 µg.mL-1 in our conditions), we have been also expressed the results in nmole of quercetin
equivalent (QE) per mg of sample (dry material).
The ORAC test w s s m d w h h Ox ™ ORA Ass y k ( bs I .)
Version postprint
10 µg.mL-1 of both NCRAE and other compounds. I h b f 2
2’-azobis-(2-methylpropionamidine) dihydrochloride (AAPH) oxidation of the antioxidant compounds led
to a reduction of fluorescein fluorescence quenching measured using the Infinite 200Pro
spectrofluorimeter (TECAN). Using Trolox as standard, the antioxidant activities were
expressed as nmole of Trolox equivalent (TE) per mg of sample (dry material).
2.8. Data analysis
Statistical analyses were performed using analysis of variance. In vitro data are expressed as
mean ±SD and in vivo data as means ± SEM. Difference were considered significant at p <
0.05 (*) or p<0.01 (**) or p<0.001 (***) using the Statgraphics 18® software.
3. Results
3.1. Chemical analysis of NCRAE content (Table 1 and 2)
Using the Folin-Ciocalteu method, we have observed that NCRAE contains essentially
polyphenols (1390 mg GAE/g of dry extract). LC-MS mass spectrometry analysis has
allowed us to assign and characterize these compounds: the data are shown in Table 1 and
Table 2. Twenty-three peaks were separated with the column and the chromatographic
gradient we used. Most of the peaks showed absorbance spectra with two bands at
220-245 nm and 315-335 nm separated by a shoulder at 290-300 nm, which were characteristic of
hydroxycinnamic acids (P1 to P9, P12 to P16, P19 to P22). Four peaks exhibited absorbance
spectra with two maximum bands at 254-256 nm and 352-354 nm (P10, P11, P17, P18)
characteristic of flavonoids. Peaks P7, P10, P11 and P13 were unequivocally identified on the
basis of their concordance with retention times, UV absorbance spectra, and MS2 fragment
proportions to pure authentic standards. Other peaks were tentatively assigned based on
bibliographic data. Sesquiterpene lactones (three classes of bitter) previously identified in
Cichorium intybus L. (Bais and Ravishankar, 2001; Al-Snafi, 2016) were completely missing
Version postprint
(Brieudes et al., 2016) was not found in NCRAE. Similarly, saponins such as cynaragenins
also identified in C. intybus were not identified in NCRAE.
3.1.1. Assigment of hydroxycinnamic acid derivatives
Tartaric acid esters:
Peaks P1, P2, P7, P8 and P9 shared the daughter ion at m/z 149.0086 corresponding to
[tartaric acid-H]- fragment ion. This one gave under MS2 fragmentation three fragments ions
at m/z 131 [tartaric acid-H2O-H]- , at m/z 103 and at m/z 87. Peak P1 and P2 m/z 311.0407
[M-H]- yielded MS2 fragment ions at m/z 179 [caffeic acid-H]- and m/z 135 [caffeic
acid-CO2-H]-, and were identified as caffeoyl-O-tartaric acid isomers, also named caftaric acid
isomers. Peak 2 predominantly formed the adduct m/z 623 [2 caftaric acid –H]- in MS1
experiment, already observed by Schütz et al. (2005) for the trans isomer. Consequently, peak
1 was consistent with the cis-caftaric acid and peak 2, with the trans-caftaric acid. Peaks 7, 8,
9 exhibited absorbance spectra shapes similar to trans-chicoric acid (L-chicoric acid) with the
pseudo-molecular ion m/z 473.0699 of dicaffeoyltartaric acid esters and exhibited daughter
ions at m/z 311, 293, 179, 149. They corresponded to m/z 311 [caffeoyltartaric acid-H]- , 293
[caffeoyltartaric acid-H2O-H]-, 179 [caffeic acid-H]-, 149 [tartaric acid-H]-. This
fragmentation behavior was in accordance with previous reports (Bergeron et al., 2002;
Schultz et al., 2005). Peak 7 was positively identified as L-chicoric acid using pure standard.
P7 is the preponderant compound of the extract. Peaks 8 and 9 may correspond to its two
other diastereoisomers, D-chicoric acid and meso-chicoric acid described by Buiarelli et al.
(2010) and Carazzone et al. (2013). Similarly to Khoza et al. (2016), we observed that the
fragmentation pattern of the three isomers is tightly similar in electrospray ionization
conditions. Peak 9 was attributed to the meso isomer because of its lower amount of fragment
m/z 293 previously described (Llorach et al., 2008). No guarantee can be given that the
formation of these two later isomers was not occurring during extraction, elution or
L-Version postprint
chicoric acid. Peak P6 exhibited a parent ion m/z 491.0794, which formed in MS2 experiment,
two fragment ions at m/z 293 and m/z 329, and a fragmentation pattern already found for a
tartaric acid derivative of root and herb juice of Taraxacum officinale Web. Ex Wigg.
(Schultz et al., 2005) and root extract of Taraxacum formosanum Kitam (Chen et al., 2012).
Presence of fragment ion m/z 329 indicated the loss of a caffeic moiety, which was confirmed
by presence of fragment ions m/z 179 [caffeic acid-H]- and m/z 135 [caffeic acid-CO2-H]-.
MS3 fragmentation of ion m/z 329 yielded m/z 311 [caffeoyltartaric acid-H]- , m/z 149
[tartaric acid-H]- and m/z 135 [caffeic acid-CO2-H]-. Presence of fragment m/z 293 was
attributed to the loss of dihydroxyphenyllactic acid plus H2O [M- dihydroxyphenyllactic acid
- H2O-H]- by Schütz et al. (2005) and Chen et al. (2012). In addition, peak 6 had similar
absorbance spectrum to peak 8 previously described (Schultz et al, 2005) for dandelion
(246 nm, 300 sh, 332 nm). The minor peak P6 was consistent with
caffeoyl-dihydroxyphenyllactoyltartaric acid.
Caffeoylquinic acid esters :
Peaks 12, 13, 14, 16 and 19 exhibited absorbance spectra shapes similar to chlorogenic acid
with the daughter ion at m/z 191.0563 corresponding to [quinic acid-H]-. This one gave under
MSn fragmentation two fragments ions at m/z 127 [quinic acid-CO-2H2O-H]- and m/z 173
[quinic acid-H2O-H]-. Monocaffeoylquinic acids (parent ion of m/z 353.0877) and
dicaffeoylquinic acids (parent ion of m/z 515.1194) were assigned using the identification
hierarchical key of quinic acid derivatives proposed by Clifford et al. (2006). Peaks 12 and 16
displayed a fragment ion at m/z 173 [quinic acid-H2O-H]- base peak, characteristic of the
caffeoyl group esterified to the 4-OH position of quinic acid. When caffeoyl groups are
esterified to the 3-OH position and 5-OH position of quinic acid, the m/z 191 [quinic acid-H]
-fragment ion remains the base peak and the signal of m/z 179 [caffeic acid-H]- fragment ion is
more significant for 3-OH acyled position of the quinic acid (Peak 13 and 14). The minor
peak P19 had a parent ion m/z 615.1428 corresponding to C29H28O15 and had 3 daughter ions,
Version postprint
the fragment [caffeoyl-succinoylquinic acid-H]-. We observed the presence of a secondary
peak at m/z 335 [caffeoylquinic acid-H2O–H] - in the MS2 spectrum, which indicated that the
succinoyl group is esterified at the 4-acyl chlorogenic acid (Jaiswal and Kuhnert, 2011). We
found that P19 correspond to 1,5-di-O-caffeoyl-3-O-succinoylquinic acid previously
described in Arctium lapa L. by Tousch et al. (2014). Peak 20 and 21 shared a
pseudo-molecular ion m/z 543.1508 [M-H]- corresponding to C27H28O12 characteristic of
dimethoxycinnamoyl-caffeoylquinic acids (Alonso-Salces et al., 2009), also referred as
methylferuloyl-O-caffeoylquinic acid (Jaiswal and Kuhnert, 2011). They shared the
secondary ion m/z 381.1191 [M-H]-, corresponding to the loss of the methylferuloyl moiety.
This is confirmed in MS2 experiment by the appearance of fragment ions m/z 207
[dimethoxycinnamic acid-H]- and m/z 103 [dimethoxycinnamic acid-H-H2O-2CH3
●
-2CO]-.
The absence of the secondary ion m/z 349 indicated that the second acyl group esterified on
quinic acid is not a dihydroxy-methoxy-cinnamic acid residue. Therefore, according to the
identification key based on the fragmentation pattern of dimethoxycinnamoyl-caffeoylquinic
acids in Collision Induced Dissociation-MS-MS, established by Alonso-Salces et al. (2009),
peaks 20 and 21 were tentatively assigned O-methylferuloyl-4-O-caffeoylquinic acid and
3-O-methylferuloyl-5-O-caffeoylquinic acid, respectively.
3.1.2. Assigment of flavonoids and coumarins.
Analysis by MS2 fragmentation of peaks P10 and P17 resulted in a common ion at m/z
301.0353. Its MS3 fragmentation gave 4 fragments: m/z 271 ([M–H–CH2O]–), m/z 255 ([M–
H–H2O–CO]–), m/z 179 ([1,2A–H]–) and ions at m/z 151 (1,2A–CO), originating from a
retro-Diels-Alder (RDA) reaction similarly to that from the fragmentation of a standard solution of
quercetin. We observed that Peak P10 had a parent ion m/z 477.0644 [M-H]– and that its
fragment ion m/z 301 corresponded to the loss of the glucuronide moiety (176 amu). In MS2
experiment, P10 conformed to fragmentation of quercetin-3-O-glucuronide, since
quercetin-4-O-glucuronide and quercetin-7-quercetin-4-O-glucuronide have additional characteristic fragments not
quercetin-3-O-Version postprint
glucuronide. Peak P17 had a parent ion m/z 505.0994 [M-H]– and yield to m/z 463 in MS2
and the loss of 206 amu, which indicates a hexoside moiety (162 amu) linked to an acetyl
group (44 amu). It could correspond to quercetin-7-O-(6''-acetyl-glucoside) since it has
already been found in Cichorium (Llorach et al., 2008) and Lettuce (Ribas-Agusti et al.,
2011). Analysis by MS2 fragmentation of peaks P11 and P18 resulted in the ion at m/z
285.0435. Fragmentation of the ion at m/z 285 gave a fragment ion at m/z 255 (loss of 30
amu, [Y0- -CH2OH]-) which is characteristic of kaempferol. The loss of 176 amu in MS2
experiment by Peak P11 suggests the loss of glucuronide moiety. Peak P11 was assigned to
kaempferol-7-O-rutinoside and positively confirmed by its authentic standard. Peak P18 had a
pseudo-molecular ion m/z 593.1511 [M-H]-, producing secondary ions m/z 285
[kaempferol-H]- and m/z 447 [(kaempferol+hexose)-H]-, It was assigned to an undetermined
kaempferol-O-hexosyl-rhamnoside. Peak P22 had a parent ion m/z 339.0650 [M-H]- corresponding to C15H15O9, and the daughter ions at m/z 177.0193 (C9H5O4) corresponding to the loss of
hexoside moiety. The MS2 experiment yielded to m/z 133.0301 [esculetin-H]-. Peak 22 was
assigned to esculin and positively identified using authentic standard. P22 is a common
coumarin in Cichorium species (Kisiel and Michalska, 2002) also name cichoriin.
In summary, NCRAE is essentially composed of 72.4% of caffeoyl tartaric acids with
chicoric (dicaffeoyls) acids that represent 64.2% of the extract and 19.6% of caffeoyl quinic
acids (mono and diCQAs) among which 2.1% of methylferuloyl-O-caffeoylquinic acid. The
rest of the NCRAE content is flavonoïds derivatives (6.6%). These results have led to the
preparation of the SCCAM solution combining 70% of CRA and 30% of CGA, close to the
0.3 CQAs/CRA ratio of NCRAE.
3.2. In vivo experiments.
3.2.1. Evidence of the obtaining of a severe diabetic state
Seven days after STZ injection in rats, glycemia raised from 108 ± 3 to 561 ± 21 mg. dL-1 and
Version postprint
3.2.2. Time course of the physiological parameters
The first consequences of the diabetes were a stop in the gain of body weight and a clear
increase in food intake (p<0.01) (Fig. 1). The daily administration of NCRAE or SCCAM did
not modify these evolutions (Fig. 1A, 1B). After STZ injection, glycosuria appeared and
raised to high values for all animals. NCRAE or SCCAM treatments induced a significant
stabilization (Fig. 1C). So at the 6th day glycosurias of treated rats were 12.9 ± 0.6 and 14.3 ±
0.5 g/24 h respectively under NCRAE or SCCAM administrations versus 18.5 ± 1.3 g/24 h
for control diabetic animals (p<0.01).
3.2.3. Effect on blood glucose levels
Time course of hyperglycemia.
In control diabetic rats, we observed a continuous hyperglycemia of about 600 mg.dL-1 (Fig.
2). NCRAE treatment induced a clear decrease in hyperglycemia from the 2th to the 6th day
(433 ± 33 mg.dL-1) (p<0.01). In contrast SCCAM treatment did not significantly change the
time course of hyperglycemia (Fig. 2A and 2B). Thus, we only observed a reduction of
hyperglycemia with NCRAE administration (-18% on the 6th day, p<0.01) (Fig 2B).
Oral glucose tolerance test (OGTT) (Fig. 3).
The oral charge in glucose induced a clear increase in hyperglycemia in all diabetic animals.
However, this increase is slight during the first 30 minutes with SCCAM. From 90 minutes a
more rapid decrease in hyperglycemia is observed in both groups of treated rats. So at 180
minutes hyperglycemia was 412 ± 17 and 415 ± 17 mg.dL-1 respectively, for NCRAE and
SCCAM treated animals versus 530 ± 40 mg.dL-1 for control diabetic rats (p<0.001).
3.3. In vitro experiments (Fig.4).
3.3.1. Insulin sensitizing investigations on L6 cells.
The results were reported on the Fig.4A: As expected, insulin (100 nM) increased basal
Version postprint
mg.mL-1 (p<0.05) which is in agreement with our previous report (Tousch et al., 2008). At the
same concentration of 50 µg.mL-1, SCCAM solution has also led to an increase of the glucose
uptake (p<0.01) with a value that is close to the NCRAE values.
3.3.2. Oxidative stress (H2O2) survival test on L6 cells.
L6 cells were submitted at a pretreatment with NCRAE or SCCAM during 12 hours after that
the compounds are eliminated by two washes. Then, 40 µM H2O2 oxidative treatment are
applied. The mortality of the cells is quantified using a vital trypan blue dye (Fig.4B). In these
conditions, the SCCAM pretreatment did not have a significant protective effect while
NCRAE pretreatment induced a low but significant protective effect with a mortality of 46.8
± 3.6 % comparatively in the control at 55.4 ± 3.6 % (p<0.05).
3.4. Quantification of the antioxidant capacities.
NCRAE exhibited a DPPH-free radical scavenging with a IC50 at 61.4±1.75 µg.mL-1 and a
QE.mg-1 at 1077 ± 31 nmoles compared at SCCAM with a IC50 at 29.6±1.2 µg.mL-1 and a
QE.mg-1 at 2240 ± 91 nmoles. The ORAC (Oxygen Radical Absorbance Capacity) test results
were similar to those of DPPH tests with a TE at 3619 ± 48 nmoles.mg-1 for NCRAE and
7020 ± 69 nmoles.mg-1 for SCCAM. So, the chemical antioxidant capacity of SCCAM is
clearly higher that NCRAE.
4. Discussion
The present study demonstrates that NCRAE, a natural caffeoyl derivatives extract, is able to
reduce basal hyperglycemia and to improve oral glucose tolerance in streptozotocin diabetic
rats, pointing out that NCRAE may be considered of interest for the treatment of diabetes.
The chemical analysis by LC-MS has allowed to obtain interesting information on the
NCRAE composition, essentially composed of caffeoyltartaric acid isomers with L-chicoric
acid (64.2%) and its other isomers and derivatives esters of caffeoylquinic acids (CQAs)
(19.6%). The presence of CQAs under mono and di-caffeoylquinic acids forms has been
Version postprint
described in lower quantity in roots than in the aerial parts of chicory (Al-Snafi et al., 2016;
Brieudes et al., 2016) shows that the chromatography procedure we used allows to
concentrate the caffeoyl derivatives. The presence of quercetin-3-O-glucuronide in NCRAE
was described in the roots of chicory (Schultz et al., 2005). We can also note the presence of
Ferulic acid derivatives at a lower proportion (2.1%).
STZ diabetes induced rat model is known as an appropriate model to search for potential
therapies since it mimics several metabolic disorders observed in human diabetes (Urgate et
al., 2012). In our STZ model, the increase in food intake and the absence in body weight gain
are in agreement with the previous report (Akbarzadeh et al., 2007). STZ injection induced a
severe diabetes, i.e., insulinemia dramatically dropped (-90%) due to the fall in the pancreatic
insulin content (Masiello et al., 1998). In these conditions, the antidiabetic effect of NCRAE
cannot be the consequence of a pancreatic insulinotropic action previously reported on INS1
cells (Tousch et al, 2008). One possibility to explain the antidiabetic property of NCRAE
could be an insulin sensitizing effect on peripheral tissues as muscles. Indeed, we have
previously demonstrated that NCRAE has the ability in vitro to enhance glucose uptake in L6
muscle cell line and does not act on hepatic glucagon-induced glycogenolysis via hepatic
glucose 6 phosphatase activity (Azay-Milhau et al., 2013). The results on L6 muscular cells
are in agreement with the report of Lee et al. (2007) on the same in vitro model. Here, we
have shown that SCCAM possess a similar capacity that NCRAE to enhance the glucose
uptake on the L6 cells, indicating the value of the mixture of chicoric acid and chlorogenic
acid on insulin sensitivity. The presence of Ferulic acid derivatives in NCRAE can be
beneficial since trans-Ferulic acid has been reported to exert an antidiabetic effect by
modulating insulin signaling pathway in the liver of type 2 diabetic rats (Narasimhan et al.,
2015). The delayed improvement in OGTT can be due to the insulin sensitizing action of
NCRAE by caffeoyltartaric acid derivatives and the stabilization of glycosuria may be related
Version postprint
Regarding the SCCAM treatment, it did not change basal hyperglycemia in STZ diabetic rats.
However an immediate and clear improvement in OGTT was observed. The capacity of CGA
to enhance glucose uptake in peripheral tissues and to reduce hepatic glycogenolysis (Meng et
al., 2013) by inhibition of glucose 6-phosphatase activity (Hemmerle et al., 1997) can explain
the stabilization in glycosuria and OGTT improvement with SCCAM treatment. Moreover,
increasing evidence showed that oxidative stress participates in pathogenesis of diabetes
(Maritim et al., 2003; Msolly et al., 2013; Nikolic et al., 2014). So, it has been necessary to
consider the antioxidant capacities of the two products. For their antioxidant potential, the two
compositions revealed significant activities, around twice for SCCAM. Consequently, a direct
antioxidant effect cannot be responsible of the basal glycemia decrease observed only with
NCRAE. In regard to the capacity of cell protection against H2O2 oxidative stress, the
treatment of 12 hours with NCRAE induced a small decrease of mortality while no effect are
observed with SCCAM. Moreover in our experiments conditions, the chemical antioxidant
capacity does not have any correlation with the cellular protective capacity of these
compositions against H2O2.
Through a better control of hyperglycemia known to induce oxidative stress (Esposito et al.,
2002; Ceriello and Testa, 2009), NCRAE could have a protective effect on the evolution
course and complications of diabetes.
In conclusion, we demonstrated that NCRAE, a natural extract rich in CRA from chicory
(Cichorium intybus) improves glucose tolerance and reduces the basal hyperglycemia in STZ
diabetic rats. These interesting effects of NCRAE are the result of the association of CRA and
CGA but also at the presence of other hydroxycinnamic acids.
Declaration of interest
The authors declare no conflict of interest and no financialinterference with the IP rights of
Version postprint
Author Contributions
D.T., K.F. and L.P.R.B. designed the research. L.P.R.B. and G.C. performed the LC-MS
analysis. K.F. and A.A. performed the in vitro and in vivo experiments. P.P. and J.A.-M.
performed the in vivo experiment. D.T., P.P. and A.D.L. analyzed the data and wrote the
manuscript. All authors reviewed the manuscript.
Acknowledgments
We sincerely thank Dr. Gérard Ribes for consenting to give us precious scientific advice and his help to the redaction of this publication.
REFERENCES
Akbarzadeh, A., Narouzian, D., Mehrabi, M.R., Jamshidi, Sh., Farhangi, A., Allah Verdi,
A., Mofidian, S. M. A., Lame Rad, B., 2007. Induction of diabetes by streptozotocin in
rats. Indian J. Clin. Biochem. 22, 60-64.
Alonso-Salces, R.M., Guillou, C., Berrueta, L.A., 2009. Liquid chromatography coupled with
ultraviolet absorbance detection electrospray ionization, collision induced dissociation
and tandem mass spectrometry on a triple quadripole for the on-line characterization of
polyphenols and methylxanthines in green coffee beans. Rapid Commun. Mass
Spectrom. 23, 363-383.
Al-Snafi, A.E., 2016. The contents and Pharmacological Importance of Corchorus capsularis:
A Review. Chemist. Res. J. 1, 9-16.
Azay-Milhau, J., Ferrare, K., Leroy, J., Aubaterre, J., Tournier, M., Lajoix, A.-D., Tousch,
D., 2013. Antihyperglycemic effect of a natural chicoric acid extract of chicory
(Cichorium intybus L.): A comparative in vitro study with the effects of caffeic and
Version postprint
Bais, H. P., Ravishankar G. A., 2001. Cichorium intybus L. - cultivation, processing, utility,
value addition and biotechnology, with an emphasis on current status and future
prospects. J. Sci. Food Agric. 81, 467-484.
Bergeron, C., Gafner, S., Batcha, L.L., Angerhofer, C. K., 2002. Stabilization of caffeic acid
derivatives in Echinacea purpurea L. glycerin extract. J. Agric. Food Chem. 50,
3967-3970.
Bradford, M.M., 1976. A dye binding assay for protein. Anal. Biochem. 72, 248-254.
Brieudes, V., Angelis, A., Vougogiannopoulou, K., Pratsinis, H., Kletsas, D., Mitakou, S.,
Halabalaki, M.; Skaltsounis, L.A., 2016. Phytochemical analysis and antioxidant
potential of the phytonutrient-rich decoction of Cichorium spinosum and C. intybus.
Planta Med. 82, 1070-1078.
Buiarelli, F., Coccioli, F., Merolle, M., Jasionowska, R., Terracciano, A., 2010. Identification
of hydroxycinnamic acid-tartaric acid esters in wine by HPLC-tandem mass
spectrometry. Food Chem. 123, 827-833.
Carazzone, C., Mascherpa, D., Gazzani, G., Papetti, A., 2013. Identification of phenolic
constituents in red chicory salads (Cichorium intybus) by high-performance liquid
chromatography with diode array detection and electrospray ionization tandem mass
spectrometry. Food Chem. 138, 1062-1071.
Ceriello, A., Testa, R., 2009. Antioxidant anti-inflammatory treatment in type 2 diabetes.
Diabetes Care. 32 Suppl 2, S232-S236.
Chen, H.J., Inbaraj, B.S., Chen, B.H., 2012. Determination of phenolic acids and flavonoids
in Taraxacum formosanum Kitam by liquid chromatography-tandem mass spectrometry
Version postprint
Cheng, J.T., Lin, L.M., Tzeng, T.E., Chen, W.C., Hayakama, S., Yamamoto, T., 2003.
Release of beta-endorphin by caffeic acid to lower plasma glucose in streptozotocin
induced diabetic rats. Horm. Metab. Res. 35, 251-258.
Clifford, M.N., Knight, S., Surucu, B., Kuhnert, N., 2006. Characterization by LC-MSn of
four new classes of chlorogenic acids in green coffee beans: dimethoxycinnamoylquinic
acids, diferuloylquinic acids, caffeoyl-dimethoxycinnamoylquinic acids and
feruloyl-dimethoxycinnamoylquinic acids. J. Agric. Food Chem. 54, 1957-1969.
Davis, B.D., Needs, P.W., Kroon, P.A., Brodbelt, J.S., 2006. Identification of isomeric
flavonoid glucuronides in urine and plasma by metal complexation and LC-ESI-MS/MS.
J. Mass Spectrom. 41, 911-920.
Esposito, K., Nappo, F., Marfella, R., Giugliano, G., Giugliano, F., Ciotola, M., Quagliaro, L.,
Ceriello, A., Giugliano, D., 2002. Inflammatory cytokine concentrations are acutely
increased by hyperglycemia in humans: role of oxidative stress. Circulation. 106,
2067-2072.
Fraisse, D., Felgines, C., Texier, O., Lamaison, J.L., 2011. Caffeoyl derivatives major
antioxidant compounds of some wild herbs of the Asteraceae family. Food Nutr. Sci. 2,
181-192.
Ghamarian A., Abdollahi M., Su X., Amiri A., Ahadi A., Nowrouzi A., 2012. Effect of
chicory seed extract on glucose tolerance test (GTT) and metabolic profile in early and
late stage diabetic rats. Daru. 20, 56-64.
Hemmerle, H., Burger, H.J., Below, P., Schubert, G., Rippel, R., Schindler, P.W., Paulus, E.,
Herling, A.W., 1997. Chlorogenic acid and synthetic chlorogenic acid derivatives: novel
inhibitors of hepatic glucose-6-phosphate translocase. J. Med. Chem. 40, 137-145.
Huang, D., Ou, B., Hampsch-Woodill, M., Flanagan, J.A., Deemer, E.K., 2002. Development
Version postprint
using randomly methylated beta-cyclodextrin as the solubility enhancer. J. Agric Food
Chem. 50, 1815-1821.
IUPAC Commission on the Nomenclature of Organic Chemistry (CNOC) and IUPAC-IUB
Commission on Biochemical Nomenclature (CBN), 1976. Nomenclature of cyclitols.
Recommendations. Biochem J. 153, 23-31.
Jaiswal, R., Kuhnert, N., 2011. How to identify and discriminate between the methyl quinates
of chlorogenic acids by liquid chromatography-tandem mass spectrometry. J. Mass.
Spectrom. 46, 269-281.
Jung, U.J., Lee, M.K., Park, Y.B., Jean, S.M., Choi, M.S., 2006. Antihyperglycemic and
antioxydant properties of caffeic acid in db/db mice. J. Pharma. Exp. Ther. 318, 476-483.
Khoza, B.S., Gbashi, S., Steenkamp, P.A., Njobeh, P.B., Madala, N.E., 2016. Identification of
hydroxylcinnamoyl tartaric acid esters in Bidens pilosa by UPLC-tandem mass
spectrometry. S. Afr. J. Bot. 103, 95-100.
Kisiel, W., Michalska, K., 2002. A new coumarin glucoside ester from Cichorium intybus.
Fitoterapia. 73, 544-546.
Lee, E.S., Uhm, K.O., Lee, Y.M., Han, M., Lee, M., Park, J.M., Suh, P.G., Park, S.H., Kim,
H.S., 2007. CAPE (caffeic acid phenethyl ester) stimulates glucose uptake through
AMPK (AMP-activated protein kinase) activation in skeletal muscle cells. Biochem
Biophys Res Commun. 361, 854-858.
Leporatti, M.L., Ivancheva, S., 2003. Preliminary comparative analysis of medicinal plants
used in the traditional medicine of Bulgaria and Italy. J Ethnopharmacol. 87, 123-142.
Lin, L.-Z., Harnly, J.M., 2008. Identification of hydroxycinnamoylquinic acids of Arnica
flowers and burdock roots using a standardized LC-DAD-ESI/MS profiling method. J.
Version postprint
Llorach, R., Martinez-Sanchez, A., Tomas-Barberan, F.A., Gil, M.I., Ferreres, F., 2008.
Characterisation of polyphenols and antioxidant properties of five lettuce varieties and
escarole. Food Chem. 108, 1028-1038.
Maruta, Y., Kawabata, J., Niki, R., 1995. Antioxidative caffeoyl-quinic acid derivatives in the
roots of burdock (Arctium lappa L.). J Agric Food Chem. 43, 2592-2595.
Maritim, A.C., Sanders, R.A., Watkins, J. B., 2003. Diabetes, oxidative stress, and
antioxidants: A review. J. Bioch. Molecul. Toxicol. 17, 24-38.
Masiello, P., Broca, C., Gross, R., Roye, M., Manteghetti, M., Hillaire-Buys, D., Novelli, M.,
Ribes G., 1998. Experimental NIDDM. Development of a new model in adult rats
administered streptozotocin and nicotinamide. Diabetes. 47, 224-229.
Meng, S., Cao, J., Feng, Q., Peng, J., Hu, Y., 2013. Roles of Chlorogenic acid on Regulating
Glucose and Lipids Metabolism: A review. Evid Based complement Alternat Med., 2013,
801457. http://dx.doi.org/10.1155/2013/801457.
J. Grz k K. Kró . J śk w z J. Zd ń zyk, Z., 2009. Composition and properties of Chicorium extracts rich in fructans and polyphenols. Pol. J. Food Nutr. Sci.
59, 35-43.
Msolly, A., Miled, A., Kassab, A., 2013. Hydrogen peroxide: an oxidant stress indicator in
type 2 diabetes mellitus. JCvD. 1, 48-52.
Namura, E., Kashiwada, A., Hasada, A., Nakamura, K., Marishita, X., Tsimo, T., Tamiguchi,
H., 2003. Synthesis of amide compounds of ferulic acid and their stimulatory effects on
insulin secretion in vitro. Bioorg. Med. Chem. 11, 3807-3813.
Narasimhan, A., Chinnaiyan, M., Karundevi, B., 2015. Ferulic acid exerts its antidiabetic
effect by modulating insulin-signaling molecules in the liver of high-fat diet and
Version postprint
Niggeweg, R., Michael, A.J., Martin, C., 2004. Engineering plants with increased levels of the
antioxydant chlorogenic acid. Nat. Biotechno. 22, 746-754.
Nikolic, D., Stanimirovic, J., Bjelogrlic, P., Isenovic, E.R., 2014. Oxidative stress and the
role of antioxidative treatment in diabetes mellitus. Oxid. Antioxid. Med. Sci. 3, 9-14.
shp r j L w HK k d J T K T H. 2 7. Anti-diabetic effects of
Cichorium intybus in streptozotocininduced diabetic rats. J h ph rm . 111
.
Ribas-Agustí, A., Gratacós-Cubarsí, M., Sárraga, C., García-Regueiro, J.A., Castellari, M.,
2011. Analysis of eleven phenolic compounds including novel p-coumaroyl derivatives
in lettuce (Lactuca sativa L.) by ultra-high-performance liquid chromatography with
photodiode array and mass spectrometry detection. Phytochem. Anal. 22, 555-563.
Sato, Y., Itagaki, S., Kurokawa, T., Ogura, J., Kobayashi, M., Hirano, T., Sugawara, M.,
Iseki, K., 2011. In vitro and in vivo antioxidant properties of chlorogenic acid and caffeic
acid. Int. J. Pharm. 403, 136-138.
Schlernitzauer, A., Oiry, C., Hamad, R., Galas, S., Cortade, F., Chabi, B., Casas, F.,
Pessemesse, L., Fouret, G., Feillet-Coudray, C., Cros, G., Cabello, G., Magous, R.,
Wrutniak-Cabello, C., 2013. Chicoric acid is an antioxidant molecule that stimulates
AMP Kinase pathway in L6 myotubes and extends lifespan in Caenorhabditis elegans.
PLoS ONE. 8, e78788.
Schneider, C.A., Rasband, W.S., Eliceiri, K.W., 2012. NIH Image to ImageJ: 25 years of
image analysis. Nat. Methods. 9, 671- 675.
Schultz, K., Kammerer, D.R., Carle, R., Schieber A., 2005. Characterization of phenolic acids
and flavonoids in dandelion (Taraxacum officinale Web. ex Wigg.) root and herb by
high-performance liquid chromatography/electrospray ionization mass spectrometry.
Version postprint
Singleton, V.L. and Rossi, J.A., 1965. Colorimetry of total phenolics with phosphomolybdic–
phosphotungstic acid reagents. American Journal of Enology Viticulture. 16, 144-158.
Street, R.A., Sidana, J., Prinsloo, G., 2013. Cichorium intybus: Traditional Uses,
Phytochemistry, Pharmacology, and Toxicology. Evid Based Complement Alternat Med.,
2013, 579319.doi: 10.1155/2013/579319.
Tousch, D., Bidel, L. . R. z s G. rr r K. L r y J. . h ss s, H.,
Tournier, M., Lajoix, A.-D., Azay-Milhau, J., 2014. Chemical analysis and
antihyperglycemic activity of an original extract from Burdock root (Arctium lappa). J.
Agric. Food Chem. 62, 7738-7745.
Tousch, D., Lajoix, A.-D., Hosy, E., Azay-Milhau, J., Ferrare, K., Jahannault, C., Cros, G.,
Petit, P., 2008. Chicoric acid, a new compound able to enhance insulin release and
glucose uptake. Biochem. Biophys. Res. Commun. 377, 131-135.
Urgate, M., Brown, M., Hollywood, K.A., Cooper, G.J., Bishop, P.N., Dunn, W.B., 2012.
Metabolomic analysis of rat serum in streptozotocin-induced diabetes and after treatment
with oral triethylenetetramine (TETA). Genome Med. 4, 35.
https://doi.org/10.1186/gm334.
Villano, D., Fernandez- h . . y .L. Tr s A. . G r ı -Parrilla, M.C.,
2007. Radical scavenging ability of polyphenolic compounds towards DPPH free radical.
Talanta. 71, 230-235.
Whiting, D.R., Guariguata, I., Weil, C., Shaw, J., 2011. IDF diabetes atlas: global estimates of
the prevalence of diabetes for 2011 and 2030. Diabetes Res. Clin. Pract. 94, 311-321.
Zhen, Y. N., Liu, K.Y., Jia, G.Y., Li, H.P., Han, L.K.; Mucun, S.X., 2007. Effect of hot-water
extract of coffee seeds on postprandial blood glucose concentration in rats. Chinese
Version postprint
Legends of Figures and Tables:
Figure 1: Time course of body weight (A), food intake (B) and Glycosuria (C) in STZ diabetic rats before and during the daily intraperitoneal administrations of NCRAE (15 mg.Kg-1) or SCCAM (15 mg.Kg-1). Control animals received only IP saline solution. Four animals were used for each experimental group and the values are the means (±SEM). (**) p<0.01.
Figure 2: Time course of hyperglycemia (mg.dL-1) in STZ diabetic rats during the daily intraperitoneal administrations of NCRAE (15 mg.Kg-1) or SCCAM (15 mg.Kg-1). Control animals received only IP saline solution. Four animals were used for each experimental group. Basal values were respectively 600 ± 25 mg.dL-1, 563 ± 32 mg.dL-1 and 525±38 mg.dL-1 for control, SCCAM and NCRAE treated diabetic rats. In the box (surrounded by a black border) the glycemia is presented in % from basal values. Values are the means (±SEM) by group. (*) p<0.05 and (**) p<0.01.
Figure 3: Effects of daily intraperitoneal administrations of NCRAE (15 mg.Kg-1) or SCCAM (15 mg.Kg-1) on oral glucose tolerance test (OGTT) (glucose at 3g.Kg-1) in STZ diabetic rats. OGTT were performed the 7th day of treatments (n=4 rats for each experimental group) and values are the means (±SEM). (**) p<0.01 and (***) p<0.001.
Figure 4: Effect of a SCCAM treatment in comparison of NCRAE on the glucose-uptake in L6 muscle cell line (A) . Values are the means (±SD) of three independent experiments. (*) p< 0.05 and (**) p<0.01. Effect of a SCCAM treatment in comparison with NCRAE on the mortality induced by H2O2 oxidative stress applied on L6 muscle cell line (B). The duration of
the treatment has been of 14 hours before the H2O2 application at 40 µM. Values are the
Version postprint
Table 1: LC−MS Fingerprint with Fragmentation of NCRAE Compounds. Peaks obtained are listed in the order of elution, with their names, molecular formulas, precursor ions, and fragmentation data. TR (min): retention time in minutes. Mol. form.: molecular formula. Theo. mass: theoretical monoisotopic mass of precursor ion [M − H]−. Δppm: mass tolerance expressed in parts per million.
peak RT (min)b Parent ion mol. form.c Parent ion theoretical mass (m/z)d Fragmentation data (m/z) [M-H] -P1 10.21 C13H12O9 311.0403 311(100), 179(89), 149(100), 135(32) P2 12.24 C13H12O9 311.0403 311(100), 179(40), 149(25), 135(4) P3 19.83 C16H18O9 353.0878 179(75), 161(10), 135(19), 85(25) P4 21.64 C16H18O9 353.0878 191(100), 85(12) P5 22.59 C16H18O9 353.0878 191(34), 179(75), 173(100), 135(26) P6 23.63 C22H19O13 491.0794 329(100), 311(10), 293(80) P7 35.19 C22H18O12 473.0720 311(100), 293(115), 219(10), 179(20), 149(31), 135(44) P8 37.20 C22H18O12 473.0720 311(100), 293(88), 219(6), 179(55), 149(24), 135(17) P9 38.10 C22H18O12 473.0720 311(100), 293( 95), 219(5), 179(23), 149(25), 135(30) P10 39.46 C21H18O13 477.0669 301(100), 273(5), 245(10), 151(120), 179(45) P11 40.39 C21H18O12 461.0720 285(100), 93(12) P12 40.86 C25H24O12 515.1189 353(100), 335(10), 191(7), 179(19), 173(25) P13 41.80 C25H24O12 515.1195 353(100), 191(12), 179(4), 85(10) P14 43.47 C25H24O12 515.1195 353(100), 191(15), 179(7), 149(12), 135(18) P15 43.6 C21H18O12 461.0720 285(100), 93(10) P16 44.36 C25H24O12 515.1195 353(100), 299(8), 203(14), 191(10), 173(25), 179(10) P17 47.44 C23H22O13 505.0994 463(60), 301(45), 151(22) P18 50.67 C27H30O15 593.1511 447(65), 285(43), P19 51.02 C29H28O15 615.1355 515(15), 453(25), 353(100), 335(5), 191(25),
Version postprint 127(14), 93(12), 85(10) P20 51.88 C27H28O12 543.1468 381(100), 161(37), 149(51) , 134(5) P21 53.51 C27H28O12 543.1468 381(100), 161(18), 149(34), 133(4) P22 53.98 C24H21O12 339.0722 177(100), 133(15) P23 53.98 C24H21O12 501.1015 311(100), 293(93), 161(99)
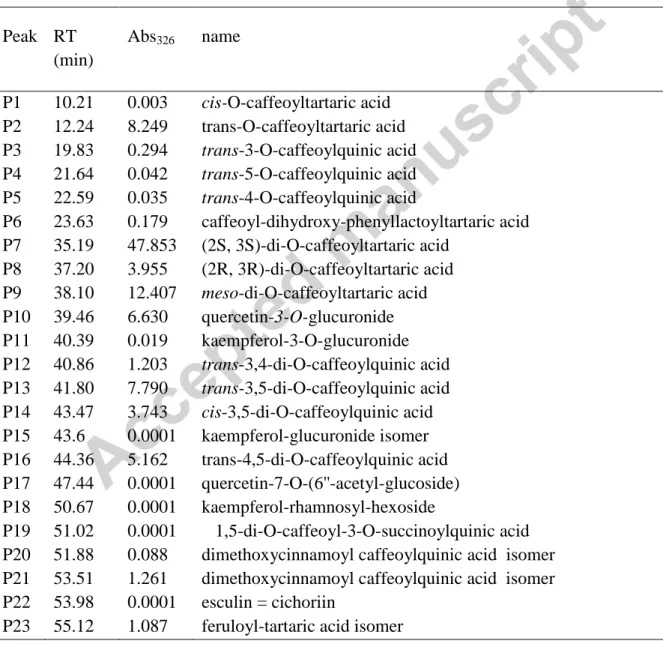
Table 2 : The concentrations of each hydroxycinnamic acid were calculated by integrating Peak areas of chromatograms at 326 nm (maximal absorbance of CGA) and are expressed as Equivalent Absorbance of the authentic L-chicoric acid standard at 10-3 M.
Peak RT (min) Abs326 name P1 10.21 0.003 cis-O-caffeoyltartaric acid P2 12.24 8.249 trans-O-caffeoyltartaric acid P3 19.83 0.294 trans-3-O-caffeoylquinic acid P4 21.64 0.042 trans-5-O-caffeoylquinic acid P5 22.59 0.035 trans-4-O-caffeoylquinic acid P6 23.63 0.179 caffeoyl-dihydroxy-phenyllactoyltartaric acid P7 35.19 47.853 (2S, 3S)-di-O-caffeoyltartaric acid P8 37.20 3.955 (2R, 3R)-di-O-caffeoyltartaric acid P9 38.10 12.407 meso-di-O-caffeoyltartaric acid P10 39.46 6.630 quercetin-3-O-glucuronide P11 40.39 0.019 kaempferol-3-O-glucuronide P12 40.86 1.203 trans-3,4-di-O-caffeoylquinic acid P13 41.80 7.790 trans-3,5-di-O-caffeoylquinic acid P14 43.47 3.743 cis-3,5-di-O-caffeoylquinic acid P15 43.6 0.0001 kaempferol-glucuronide isomer P16 44.36 5.162 trans-4,5-di-O-caffeoylquinic acid P17 47.44 0.0001 quercetin-7-O-(6''-acetyl-glucoside) P18 50.67 0.0001 kaempferol-rhamnosyl-hexoside P19 51.02 0.0001 1,5-di-O-caffeoyl-3-O-succinoylquinic acid P20 51.88 0.088 dimethoxycinnamoyl caffeoylquinic acid isomer P21 53.51 1.261 dimethoxycinnamoyl caffeoylquinic acid isomer P22 53.98 0.0001 esculin = cichoriin
Version postprint
Version postprint Figure 1
*
*
*
-7 -1 0 2
4 6
days
Treatment
IP
ST
Z
Version postprint
Figure 2
G
l
y
Contr
ols
70/3
0 Mix
NCRA
E
C
-7 -1I
P
S
Trea
tme
nt
Con trol SCC AMGl
yce
mia
(mg.dL
-1
)
Version postprint Figure 3
Cont
rol
**
Con
tr
o
ls
SCC
A
M
* * da ys % of glycemiaVersion postprint