ANALYSIS OF FORCES ON CORE STRUCTURES DURING A LOSS-OF-COOLANT ACCIDENT
by
D.P. Griggs, R.B. Vilim, C.H. Wang and J.E. Meyer Energy Laboratory Report No. MIT-EL 80-029
ANALYSIS OF FORCES ON CORE STRUCTURES DURING A
LOSS-OF-COOLANT-ACCIDENT
D.P. Griggs, R.B. Vilim, C.H. Wang and J.E. Meyer
Energy Laboratory and
Department of Nuclear Engineering Massachusetts Institute of Technology
Cambridge MA 02139
Final Report for Research Project
sponsored by
Boston Edison Co. and
Yankee Atomic Electric Co.
under the
MIT Energy Laboratory Electric Utility Program
Energy Laboratory Report No. MIT-EL- 80-029
Table of Contents
Topic Page
1. Introduction 1
1.1 Objectives 1
1.2 Description of LOCA Forces Problem 2
1.3 Organization 4
2. Base Case Illustrative Problem 5
2.1 Major Flow Paths and Components 5
2.2 Description of Transient 7
2.3 Additional Details 9
2.4 Summary 11
3. State-of-the-Art 19
3.1 Description of Design Methods 19
3.1.1 Problem Description 20 3.1.2 Calculation of Blowdown-Induced 20 Hydraulic Forces 3.1.3 Nonequilibrium Thermodynamics 23 3.1.4 Critical Flow 24 3.1.5 Multi-Dimensional Effects 25
3.2 Los Alamos Laboratory Research 26
3.3 Karlsruhe Laboratory Research 30
3.4 Structural Mechanics and Fluid Dynamics Methods 31
4. Examination of Assumptions 49
4.1 Sonic Velocities 49
4.2 Exact One-Dimensional Solution 50
4.3 FLASH/RELAP Solution 53
4.4 Comments on Other Effects 55
4.4.1 Multi-Dimensional Effects 55
4.4.2 Dynamic Structural Analysis 56
4.4.3 Interaction of Motions and Loads 59
5. Conclusions 73
APPENDIX A Additional Figures 77
APPENDIX B Summary of Computer Codes 84
APPENDIX C Exact One-Dimensional Solution 94
APPENDIX D FLASH/RELAP Solution 100
APPENDIX E Circumferential Strain Calculation 113 117 References
List of Figures
Figure Description Page
2.1 Reactor control volumes, base case problem. 14
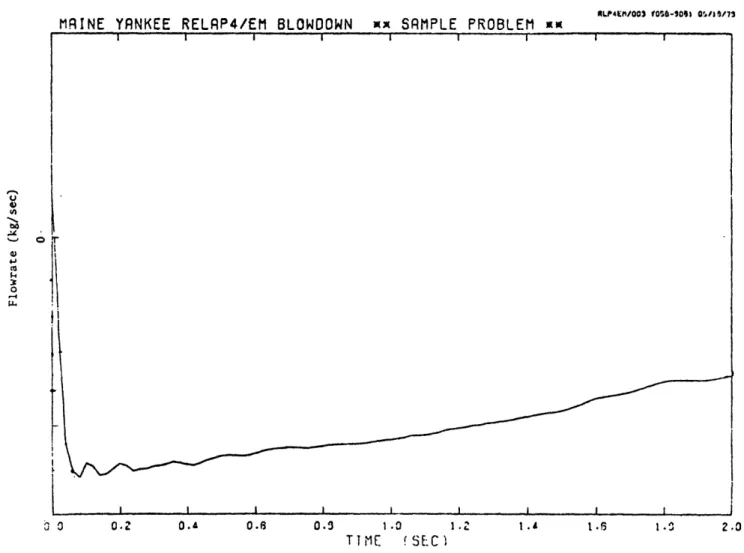
2.2 Flowrate in flowpath 27 following cold leg 15 double ended guillotine break.
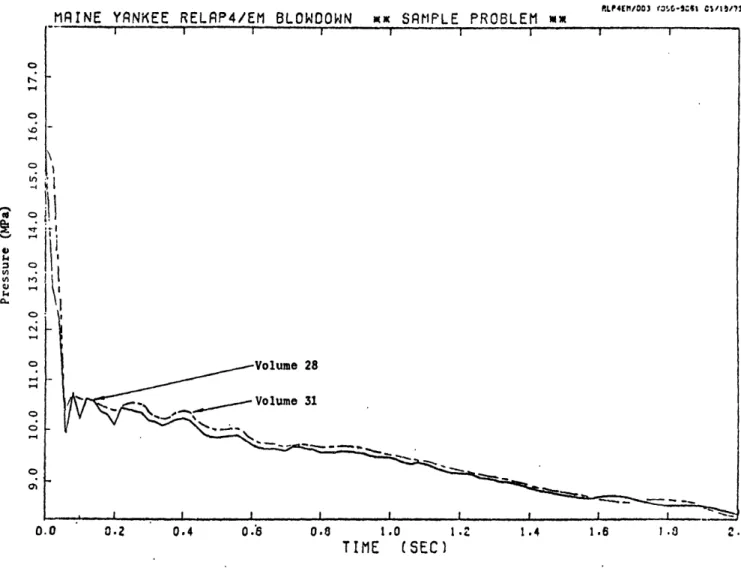
2.3 Pressures in volumes 28 and 31 following 16 cold leg double ended guillotine break.
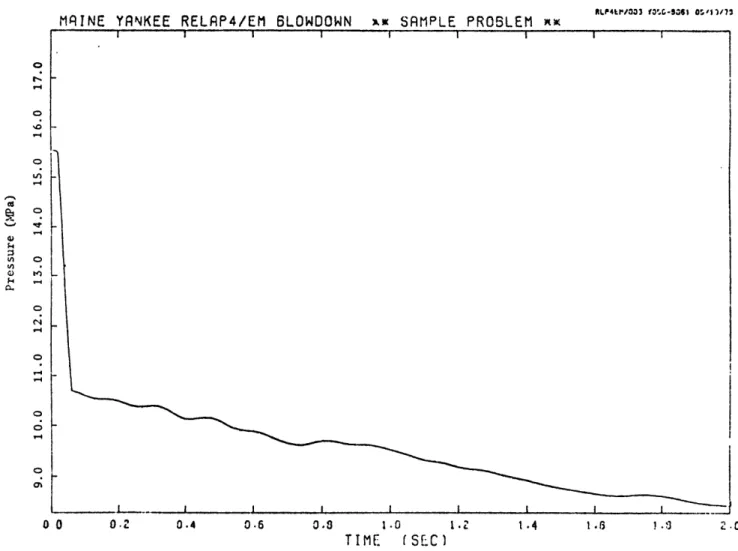
2.4 Pressure in volume 41 following cold leg 17 double ended guillotine break.
2.5 Base case problem unwrapped downcomer. 18
3.1 Geometry of HDR pressurized water reactor vessel. 35
3.2 Prescribed pressure history boundary condition 36 at the HDR cold cold leg break.
3.3 Calculated radial deflections of the HDR core 37 barrel in the plane =0, with and without
fluid-structure coupling.
3.4 Calculated radial deflections of the HDR core 38 barrel bottom directly below the break, with and
without fluid-structure coupling.
3.5 Calculated axial bending stresses at the top, 39 built-in boundary of the HDR core barrel, with
and without fluid-structure coupling.
3.6 Calculated axial bending stresses at the top of 40 the HDR core barrel in the plane c=00, with and
without fluid-structure coupling.
3.7 Calculated radial deflections of the HDR core 41 barrel in the plane =00, two- and
three-dimensional fluid representations.
3.8 Calculated axial bending stresses at the top, 42 built-in boundary of the HDR core barrel,
two-and three-dimensional fluid representations.
3.9 Calculated radial deflections of the HDR core 43 barrel in the plane C=00
, with and without bottom mass ring.
iii
Page 3.10 Calculated radial deflection of the HDR core 44
barrel bottom directly below the break, with and without bottom mass ring.
3.11 Calculated axial bending stresses at the top, 45 built-in boundary of the HDR core barrel, with
and without bottom mass ring.
3.12 Axisymmetric blowdown apparatus. 46
3.13 Geometry of PWR, HDR, and FLUX model. 47
3.14 Geometry parameters in FLUX model. 48
4.1 Core barrel pressure differential during blowdown 65 as calculated by exact analytical and FLASH/RELAP
solutions, for Case 1 boundary conditions.
4.2 Core barrel pressure differential during blowdown 66 as calculated by exact analytical and FLASH/RELAP
solutions, for Case 2 boundary conditions.
4.3 Core barrel pressure differential during blowdown 67 as calculated by exact analytical and FLASH/RELAP
solutions, for Case 3 boundary conditions.
4.4 Core barrel pressure differential during blowdown 68 as calculated by exact analytical and FLASH/RELAP
solutions, for Case 4 boundary conditions.
4.5 Core barrel pressure differential during blowdown 69 as calculated by exact analytical and FLASH/RELAP
solutions, for Case 5 boundary conditions.
4.6 Calculated downcomer pressure field and corres- 70 ponding core barrel radial deflection for a PWR.
4.7 Calculated expansion wave propagation and core 71 barrel deformations for a PWR.
4.8 Eigenfrequencies and corresponding mode shapes 72 for the HDR core barrel.
A.1 Schematic of major reactor structures for base 78 case plant.
A.2 Pressure vessel details, base case plant. 79
A.3 Core bypass region and core shroud details, 80 base case plant.
iv
Page A.4 Core barrel pressure differential during 81
blowdown as calculated by FLASH-RELAP solution technique with different time steps, for Case 1 boundary conditions.
A.5 Core barrel pressure differential during blowdown 82 as calculated by FLASH/RELAP solution technique
with different time steps, for Case 2 boundary conditions.
A.6 Core barrel pressure differential during blowdown 83 as calculated by FLASH/RELAP solution technique
with different time steps, for Case 3 boundary conditions.
LIST OF TABLES
Page 2.1 Base Case Geometric Information and Characteristic Times 12
(Pre-Transient Steady State).
2.2 Base Case Flow Path Operating Conditions (Pre-Transient 13 Steady State).
3.1 Input Parameters for NSR, PWR and RS16 Situations 32
a. Geometric Data 32
b. Core Barrel Physical Constants 33
c. Characteristic Fluid and Input Data 34
4.1 Geometric Parameters for One-Dimensional Model. 61
4.2 Boundary Conditions for One-Dimensional Model. 61
4.3 Error in Computed Frequency of Lowest Mode Compared to 62 Results.
4.4 Differential Pressure Relief Through Component Circumferential 63 Strain: Case Definitions.
4.5 Differential Pressure Relief Through Component Circumferential 64 Strain: Case Parameters.
Nomenclature kg kilogram m meter mm millimeter ms millisecond Mg megagram MN meganewton MPa megapascal N newton s,sec second
1. INTRODUCTION
1.1 Objectives
There are several design requirements related to the emergency core cooling which would follow a hypothetical loss-of-coolant accident (LOCA). One of these requirements is that the core must retain a
coolable geometry throughout the accident. A possible cause of core damage leading to an uncoolable geometry is the action of forces on
the core and associated support structures during the very early
(blowdown) stage of the LOCA. An equally unsatisfactory design result would occur if calculated deformations and failures were so extensive that the geometry used for calculating the next stages of the LOCA
(refill and reflood) could not be known reasonably well. Subsidiary questions involve damage preventing the operation of control assemblies and loss of integrity of other needed safety systems. A reliable
method of calculating these forces is therefore an important part of LOCA analysis.
These concerns provided the motivation for this study. The general objective of the study was to review the state-of-the-art in LOCA force determination. Specific objectives were:
(a) determine state-of-the-art by reviewing current (and projected near future) techniques for LOCA force determination.
(b) consider each of the major assumptions involved in force determination and make a qualitative assessment of their validity.
(c) use a small number of illustrative problems to obtain
quantitative information concerning these assumptions.
This report will attempt to address each of the stated objectives.
1.2 Description of LOCA Forces Problem
The analysis of LOCA forces is a complex problem involving the
marriage of fluid dynamics and structural mechanics techniques to
cal-culate a very severe transient response. Following the initiation of
a LOCA, hydraulic pressure waves result which reverberate within the
reactor loop and core for a short interval of about 50 ms. Flows in
the system experience high amplitude oscillations for a few seconds,
resulting in large magnitude, short duration mechanical loads on
structural elements. Both single phase and two-phase flow conditions
occur during the accident. The character of the flows in the annular
downcomer and in plenum regions is multi-dimensional and the problem
is asymmetric as a whole. Loads are induced on structures by the
action of interface stresses (both pressure and shear) at the surfaces
in contact with the fluid. Pressure differentials in the fluid cause
net forces on the structures and may originate in a number of ways,
including:
- wall shears, expansion/contraction losses, and form losses; - forces needed to turn fluid jets which are directed toward
(or away from) the structure surface;
- fluid acceleration both from velocity changes with position (spatial acceleration) and velocity changes with time
(temporal acceleration); and
- depressurization of different regions around the structure at different rates during the blowdown.
The forces arising from temporal acceleration-induced pressure
differentials can give "water-hammer" effects, taking the form of
pressure waves propagating through the system at sonic velocity (and
being reflected, transmitted, attenuated, etc.). Wall shears not only
cause pressure differentials in the coolant but also are direct forces
on the structure.
The relation between forces on the structures and resulting
stresses is, of course, a dynamic one. Recoil of previously stressed
structures from which applied loads have been reduced is one dynamic
effect. Another dynamic effect is the overshoot to larger than
"static stresses" when a new load is applied rapidly but is sustained for a fairly long time. A third effect is the undershoot to smaller
than static stresses when the new load is applied for only a short
time (with respect to a natural period of vibration of the structure).
This interaction between structural motions and loads may be very
im-portant in calculating the stresses during the accident. Loa
calcu-lated on the basis of a rigid structure (no wall motion) can, in certain
cases, be shown to be quite different than loads calculated with
structural flexibility and resultant wall motion accounted for.
Finally, for a complete description of LOCA forces, a determination
of peak magnitude is not enough. The time-dependent history of the
structural loadings may be necessary in some cases, so methods are
needed for recognizing those cases for which peak magnitudes are
1.3 Organization
In order to address the goals of the project, this report has
been organized as follows: Chapter 2 presents the illustrative problem
which was considered the basis of the analytical work; Chapter 3 is a
review of state-of-the-art methods of LOCA forces analysis; Chapter 4
contains an examination of the major assumptions made in LOCA forces
analysis; Chapter 5 summarizes the conclusionsof the study and gives
suggestions for future work. Appendices and references conclude the
5
2. BASE CASE ILLUSTRATIVE PROBLEM
One of the objectives of the project is to identify the
underlying assumptions of present and projected methods of LOCA force
analysis and to determine the applicability of these assumptions to
Boston Edison and Yankee Atomic reactors. To this end, it was decided
that a base case problem representative of the reactors owned/purchased
by the sponsoring utilities would be identified and examined for the
applicability of such assumptions. Discussions with utility engineers
led to the selection of an instantaneous double-ended guillotine
break of a Maine Yankee primary coolant pipe (pump discharge leg) as
the base case problem.
This chapter describes the geometry and steady-state operating
conditions of the base case. A description of blowdown based on a
one-dimensional fluid representation is also given.
2.1 Major Flow Paths and Components
The Maine Yankee plant is a three loop pressurized water reactor
owned and operated by Maine Yankee Atomic Power Company. Figures
showing major core structures and flowpaths may be found in Appendix A.
A nodal diagram combining reactor details with the calculational
coolant representative is shown in Fig. 2.1. This coolant
representa-tion given in this chapter was taken from a WREM (Water Reactor
Evalu-ation Model) model of the Maine Yankee Reactor (1). This model uses a
version of the code RELAP (2) to solve the one-dimensional conservation
equations. The RELAP codes provide for describing a thermal-hydraulic
system as a series of interconnecting control volumes, as in Fig. 2.1.
balances are solved for the connecting junctions. The solution
as-sumes one-dimensional homogeneous fluid with the vapor and liquid
phases in thermodynamic equilibrium. The importance of these
assump-tions to calculating LOCA forces will be addressed in Chapter 3. The
intent in using the model here is to provide a first order description
of the steady-state and blowdown phases of a cold leg pipe break
accident.
In the WREM representation of the Maine Yankee reactor, twenty
control volumes are used for coolant in and near the reactor core.
The in-vessel volumes are indicated in Fig. 2.1, while the
correspond-ing geometric information is given in Table 2.1. Referrcorrespond-ing to the
table, the volume column gives thke coolant content of each control
volume. The "flow path" column gives the length a typical fluid
par-ticle would traverse in passing through the control volume. These
lengths were either obtained from reference (1) or were estimated
from figures in the Maine Yankee safety analysis report (30).
Flow path operating conditions (pre-transient steady state) are
supplied in Table 2.2. These conditions were combined with the
geo-metric information of Table 2.1 to produce two sets of time constants
that characterize physical processes of interest. The first of these
is the "enthalpy transport time constant" which was defined for a
particular control volume as:
pV h W
where p = coolant density (kg/m3);
V = coolant volume (m3); and
W = mass flow rate (kg/s).
Physically, this time constant is the "fluid transport time" or
"transport delay time" for a pipe-like component. The second time
constant is the "sonic time", the time required for a sonic wave to
travel the length L:
Ts = (L/c)
where L = flow path length (m); and c = sonic velocity (m/s).
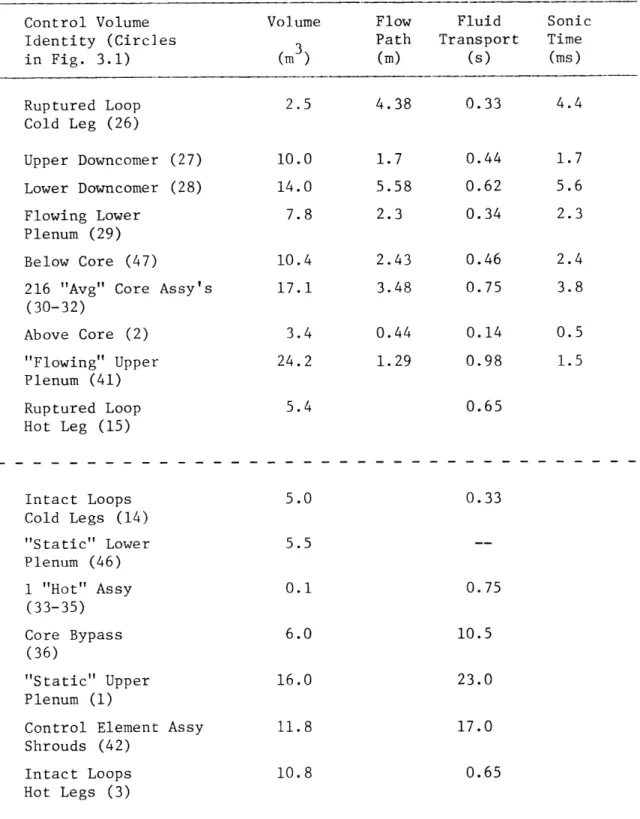
The time constants are given in Table 2.1, giving a basis for
comparing the speeds of fluid transport and sonic/water hammer effects.
The constants indicate, for example, that in steady-state it takes
0.33 seconds for fluid to be transported from the break location to
the reactor inlet nozzle, 1.86 seconds from there to the core inlet
(by summing numbers for volumes 27, 28, 29 and 47), and 0.75 seconds
to pass through the core. The corresponding numbers for sonic
propa-gation are 4.4 ms, 120 ms, and 3.8 ms. Therefore, break occurrence
"information" is transmitted by sonic pressure wave through the usual
coolant path to the core exit in a very short time (20.2 ms).
Short-cuts through structure can cause information transmittal in even
shorter times.
2.2 Description of Transient
The base case transient occurs as a result of a pipe break to
rushes toward the break a decompression wave advances through the
system displayed in Fig. 2.1. The actual pressure wave transmission
is complicated by reflections at area changes and by interactions with
coolant volumes not shown in Fig. 2.1, such as pumps and steam
gener-ators. Figure 2.2 shows the calculated flow rate from the vessel to
the broken loop during the early blowdown portion of the accident. The
magnitude of the flow out the break increases rapidly to a maximum
value (at t=60 ms) or approximately five times the pre-transient
steady-state value. The flow slowly decreases during the next two
seconds. Figure 2.3 shows the pressures in volumes 28 (downcomer)
and 31 (middle core volume), for the first two seconds of the blowdown.
By comparing these two pressure curves, the pressure differential
across the core barrel can be inferred. Although this pressure
dif-ference is actually asymmetric (as multi-dimensional calculation reveal),
Fig. 2.3 correctly shows it to be greatest in the first forty
milli-seconds of the decompression. During this period, the pressures have
not yet reached the saturation values shown in Table 2.2, so pressures
drop very rapidly. Following this subcooled blowdown portion of the
transient, saturation pressures are reached in the hotter portions of
the system resulting in flashing to steam and a slowdown in the rate
of decompression. Examination of the plots from the WREM model indicate
that the first flashing occurs at t=60 ms in the upper plenum and hot
leg regions, taking place at a pressure of approximately 11.0 MPa.
Figure 2.4 shows the decompression of the outlet plenum during the
first two seconds, demonstrating the abrupt change in decompression
in Table 2.2. However, the control volumes (27, 28, 36) that are most
important in influencing core structural behavior remain single phase
liquid for more than two seconds. At t=20 sec the system pressure
has dropped to about 8.3 MPa and these control volumes begin flashing
(at approximately 7.1 MPa) soon thereafter.
2.3 Additional Details
The advance of the decompression wave through the downcomer
(control volumes 27 and 28) supplies the first large forces on the
barrel and the first opportunity for significant striuctural damage.
An "unwrapped" Maine Yankee downcomer is shown, approximately to scale,
in Fig. 2.5. The nozzle that connects to the broken cold leg is at
Z=0, 6=0 in the figure. The decompression wave that spreads out from
this position soon encounters reflections from the top of the downcomer
and from the hot leg pipes which penetrate the downcomer. The wave
also reaches the open pipes leading to the other cold legs before
reaching the bottom of the downcomer. These interactions of pressure
wave and structural features are obviously of a multi-dimensional
nature, a complication whose importance must be assessed.
A thermal shield (see Fig. A.1) is located between the core
barrel and pressure vessel at the same elevation as the active section
of the fuel elements. The purpose of the shield is to reduce the level
of gamma heating in the pressure vessel wall. It is secured at the
top and bottom by seven circumferentially spaced studs anchored to the
outside of the core barrel. These studs present neglible resistance
to flow. The impact of the thermal shield on hydrodynamic response to
There are six bumpers at the bottom of the core support barrel
that prevent excessive motion of the barrel with respect to the reactor
vessel. Each bumper consists of a snubber block and a core restraining
lug. The snubber block is mounted on the bottom of the outside surface
of the core barrel, having a vertical slot in its outside face that
runs the length of the block. The core restraining lug is fastened
to the reactor vessel at the same elevation and azimuthal angle as the
snubber block. The lug is machined in the field to fit snugly
(azimuthally) into the snubber block slot. A clearance of 13.5 mm
exists in the radial direction between the face of the lug and the
face of the snubber block slot. The bottom of the core barrel is
therefore restrained with respect to rotation about its axis but
un-restrained in the axial direction. Local deformations of 13.5 mm are
permitted in the radial direction at each snubber block location. These
movement inhibitors could have an important impact on core barrel
response to asymmetric pressure wave loadings.
The core support barrel is hung from a lip on the inside of the
pressure vessel (see Fig. A.2). An alignment key locates the core
barrel in the azimuthal direction in the pressure vessel. An expansion
ring (Bellevelle spring type) sits on top of the barrel flange and is
compressed by a force of approximately 4 MN when the reactor vessel
head is bolted down. It may be that sufficiently large asymmetric
forces could be applied to the core barrel to result in the flange
being unseated. Since LOCA force analyses consider the core barrel
flange to be properly seated at all times, this effect is not taken into consideration. The importance of this simplification is not known.
The response of the core shroud to different rates of decompression
in the core bypass and core regions may also be important in maintaining
a coolable geometry. The shroud is an open-ended stainless steel can
that covers the outside faces of the peripheral fuel assemblies. The
core bypass region is located between the core shroud and core barrel.
The bypass region is characterized by relatively small inlet/outlet
flow area to volume ratio and hence may decompress at a slower rate
than the core region. This could lead to net inward forces on the
core shroud with possible damage to peripheral fuel elements.
2.4 Summary
For the purpose of performing a one-dimensional thermal-hydraulic
analysis of the Maine Yankee plant during a LOCA, a volume and flow
path representation of the core, reactor vessel and other primary
com-ponents is used. In addition to the assumption of one-dimensionality,
the fluid within a control volume is assumed to be at equilibrium and
structures are rigid. Analyses performed on this basis indicate that
the largest pressure differential across the core barrel occurs during
the subcooled portion of the blowdown. The calculational volumes most
crucial to determining core barrel response do not experience flashing
until about two seconds after the break, well into the saturated
blow-down phase. A multitude of important structural details pose
compli-cations in determining core response to the hydraulic forces created
Table 2.1 Base Case Geometric Information and Characteristic Times (Pre-Transient Steady State)
Control Volume Volume Flow Fluid Sonic
Identity (Circles 3 Path Transport Time
in Fig. 3.1) (m
)
(m) (s) (ms) Ruptured Loop 2.5 4.38 0.33 4.4 Cold Leg (26) Upper Downcomer (27) 10.0 1.7 0.44 1.7 Lower Downcomer (28) 14.0 5.58 0.62 5.6 Flowing Lower 7.8 2.3 0.34 2.3 Plenum (29) Below Core (47) 10.4 2.43 0.46 2.4216 "Avg" Core Assy's 17.1 3.48 0.75 3.8 (30-32) Above Core (2) 3.4 0.44 0.14 0.5 "Flowing" Upper 24.2 1.29 0.98 1.5 Plenum (41) Ruptured Loop 5.4 0.65 Hot Leg (15) Intact Loops 5.0 0.33 Cold Legs (14) "Static" Lower 5.5 Plenum (46) 1 "Hot" Assy 0.1 0.75 (33-35) Core Bypass 6.0 10.5 (36) "Static" Upper 16.0 23.0 Plenum (1)
Control Element Assy 11.8 17.0
Shrouds (42)
Intact Loops 10.8 0.65
Table 2.2 Base Case Flow Path Operating Conditions (Pre-Transient Steady State)
Flow Path Saturation
Identity (Squares Flow Pressure Temperature Pressure
in Fig. 3.1) (Mg/s) (MPa) (C) / (MPa)
Ruptured Loop Cold Leg (27) Downcomer (28) "Avg" Core Exit (37) Ruptured Loop Hot Leg (15) Intact Loops Cold Leg (14) Hot Assy Exit (33) Core Bypass (39) Intact Loops Hot Leg (2) 5.65 16.93 16.42 5.65 11.30 0.08 0.43 11.30 15.64 15.70 15.56 15.50 15.64 15.56 15.56 15.50 290 7.44 290 / 7.44 319 318 11.12 10.98 290 / 7.44 332 / 13.18 290 / 7.44 318 / 10.98 "Leakage" Paths (1) and (47) "Leakage" Path (48) 0.48 0.03 15.50 15.70 318 / 10.98 290 / 7.44 Notes
(a) Leakage paths (1) and (47) pass into and out of the "static" upper plenum (1).
(b) Leakage path (48) passes from the upper downcomer (27) to the "flowing" upper plenum (41).
(c) Pressure and temperature values are given on a "donor cell" basis (i.e., for the control volume providing flow to the
11
t
r r
@
-- t-
©
)
_+_
_+
@I
@
-+-~
i *I
j
I®
Core Control Volumes, Base Case Problem.
-Figure 2.1
O
E_
RLP4tn/003 OSOB-9015 O1 l/73
2 0 0.2 0O. 0.6 0.3 1.0 1.2 1.4 1.6 t1. 2.0
TIME fSE:C
MAINE YANKEE RELAP4/EM BLOW0D
0.0 0.2 0.4 0.8 0.8 1.0 1.Z 1.4 1.6 . .0
TIME (SEC)
Fig. 2.3 Volume 28 and 31 Pressures Following Cold Leg Double Ended Guillotine (Ref. 1)
.LP4EM/00) f=-1*C651 CI/10/72 IN mw SAMPLE PROBLEM mx
AL4P/303 OtG-3361 0r1)/73 O
1
o I o O 0 0 v-0 0 0 0.2 0.4 0.6 0.0 1.0 1.2 1.4 1.5 !.'] 2.0 TIME (SEC)Z = 1.77m 0
N
-1.70 -7.28 -8 = -180* 13.73mI~llllt--L
-!__.~
SNUBBER BLOCKSi_
il
"Control Volume 27 Control Volume 28KI
1
+1800
Figre 2.5 Base Case Problem Unwrapped Downcomer
o z = vertical position above nozzle centerline
* 8 = angular position relative to cold leg of ruptured loop * RI, = ruptured loop
* IL = intact loop
*
0 = cold leg nozzle * = hot leg nozzle* View is from reactor vessel (inside diameter = 4.37 m) toward core support barrel
* Total coolant thickness = 182 mm
9.0 9.05 m
1
IL RL IL 7 I~6-J
I
1
(
----
--
- -I
--3. STATE-OF-THE-ART
This chapter describes the existing state-of-the-art for the
calculation of forces on core structures during blowdown. The
state-of-the-art consists of those methods which are currently being used
commercially as well as those methods which are being developed. The
chapter begins with a presentation of methods that are representative
of those used by vendors. Unfortunately, the proprietary nature of
this work has made it impossible to obtain details on some of the more
interesting aspects of these methods. Research efforts aimed at the
investigation of certain key assumptions used in current blowdown
forces analyses are then described. These studies have centered on
the coupling of fluid and structural interactions, utilizing both new
analytical methods and experiments. To date, most of the work done in
assessing the conservatism of an uncoupled analysis has been part of a
cooperative program between the Los Alamos Scientific Laboratory and
the Karlsruhe Laboratory in Germany. Therefore, a presentation of the
work done at Los Alamos is followed by a description of the related
Karlsruhe results.
3.1 Description of Design Methods
Several vendors perform blowdown calculations as an integral
part of their safety analysis. Understandably each vendor is interested
in protecting the investment required to develop such calculational
methods and hence classifies some of the information as proprietary.
Unfortunately, much of this proprietary information concerns the
selection of the appropriate model to adequately describe a key aspect
of the blowdown process. Where the information was unavailable, an
attempt was made to provide the background upon which a selection should
This section consists of a description of the problem, followed
by a discussion of aspects of calculating the blowdown induced forces.
This is followed by a discussion of three aspects of the blowdown
process which require special attention. These are nonequilibrium
thermodynamics, critical flow and multidimensional flow.
3.1.1 Problem Description
A postulated LOCA can impose large magnitude, short duration
loads on core structures during the blowdown phase of the accident.
These loads result from the rapid depressurization of the reactor
vessel cavity. Failure of reactor vessel internals under such loads
can lead to improper functioning of the control rods or loss of
cool-able core geometry. Therefore, to ensure the structural integrity of
core structures, several vendors (4,5) perform dynamic analysis to
define the transient forces that act during the blowdown phase of a
LOCA.
3.1.2 Calculation of Blowdown Induced Hydraulic Forces
The worst case for adverse loads on core and core supports is
identified as an instantaneous (less than 20 ms) double-ended shear
in the cold (pump discharge) leg pipe (6). Resulting hydraulic
pressure waves reverberate within various regions of the core for a
short interval (about 50 ms). Flows experience high amplitude
oscil-lations for a few seconds. Such an event causes large magnitude, short
duration mechanical loads on structural elements.
The loads induced on components within the reactor vessel result
from the action of interface stresses (both pressure and shear) at the structural surfaces in contact with the coolant. These stresses arise
- momentum transfer;
- spatial acceleration of fluid (caused by change in flow direction or flow area); and
- temporal acceleration of fluid.
These mechanisms appear as terms in the hydraulic model. From
the hydraulic model one determines the interface stresses and hence
the loads induced on components.
In practice it is necessary to model the thermal-hydraulics of
the entire primary system in order to estimate the forces imposed on
the core and core supports. In principle these forces could also be
obtained by studying the reactor pressure vessel as an isolated
com-ponent with boundary conditions specified at the inlet and outlet legs.
The difficulty with this approach is that these boundary conditions
are dependent on the depressurization process in the entire primary
system and hence can be determined accurately only if the total loop
thermal-hydraulics are examined.
With the possible exception of a few key components (to be
mentioned shortly), the primary system thermal-hydraulics are modeled
in one dimension. The Water Reactor Evaluation Model (WREM) used by
Yankee Atomic Electric Company for simulation of its Maine Yankee
plant (7) serves as an example. Control volumes designated as nodes
are connected via flow paths to other nodes. The conservation
equa-tions for mass and energy are applied in the nodes while the one
dimensional conservation equation for momentum is applied in the
flow-paths. A solution is obtained by numerically integrating the
primary system. Other one-dimensional schemes are described in
Refs. 4, 5 and 8.
In components where the flow is complex, a more detailed model
may be required for an accurate prediction of system blowdown. The
downcomer [5,8,27] and broken inlet leg [29] are two cases. Flow
here is usually modeled in two dimensions with the equations for mass,
momentum and energy solved over a finite difference mesh. A detailed
discussion is given later.
Independent of the flow models used, the thermal-hydraulic
analysis of primary system blowdown is carried through with all
struc-tures assumed static. As a result, local volume or pressure changes
that may occur due to structural displacements in the actual system
are not represented in the thermal-hydraulic model. The exclusion of
fluid-structure effects is believed to give conservative estimates of
blowdown loads on core structures. This however, has not been proven
in general.
Three different methods for evaluating the fluid forces acting
on the surface of a structure during blowdown have been identified.
Each is suited to a particular characterization of flow in the vicinity
of the structure. For flow described with the use of an Eulerian mesh,
the shear and normal forces acting on the structure are available
directly from the fluid computational cells adjacent to the
fluid-structure interface. In Ref. 6, the forces exerted by the fluid in
the downcomer region on the core support barrel are determined using
this method. For flow given in terms of an average flow rate, empirical
forces acting on the structure. Reference 5 describes the use of
this method for the computation of the drag forces exerted on a
con-trol element shroud subjected to a large transverse flow component
during blowdown. Finally, when flow is characterized by the
node-flowpath method, the forces on structures such as orifice plates can
be determined from the momentum control volume concept. In this
ap-proach the fluid around the structure is enclosed in a control volume
and the linear momentum equation applied. The control volume is drawn
such that node pressures are the known external forces acting on it
while the forces exerted by the structure on the control volume are
the unknown external forces (5).
3.1.3 Nonequilibrium Thermodynamics
Recall that a two-phase system is in thermodynamic equilibrium
when both phases are at the same pressure and their temperatures are
at the corresponding saturation value. Under any other conditions the
system is in a state of thermodynamic nonequilibritum.
The possible occurrence of nonequilibrium thermodynamic effects
during blowdown has been investigated by several groups (5,9,10).
Their findings indicate that these effects are negligible for the
coolant not immediately adjacent to the break. The fluid here can be
considered to be in a state of thermodynamic equilibrium. The fluid
escaping through the break, however, is in a nonequilibrium state.
The evidence supporting the use of equilibrium thermodynamics
throughout the primary system, excluding the break, is as follows.
Non-equilibrium behavior has been found only in small scale experiments.
scale model of a reactor pressure vessel and downcomer. They found that
experimental-analytical agreement could be obtained only by incorporating
a thermodynamic nonequilibrium model of vapor bubble growth in their
analysis. Other cases of nonequilibrium behavior in small scale
experi-ments are given in Ref. 5. This reference points out that the above
ex-periments differ from a typical PWR blowdown in the following respects:
fluid volume is small and break area to system volume ratio is large.
Further, two large scale experiments (LOFT and CSE) typical of a PWR
blowdown in these respects showed no nonequilibrium effects inside the
vessel. Reference 5 points out that local decompression rates in the
small scale experiments were two orders of magnitude greater than in
the large scale experiments. Hence, the nonequilibrium effects observed
in the small scale experiments cannot necessarily be expected to occur in
the blowdown of a typical PWR.
The break thermodynamics are nonequilibrium in nature. A
dis-cussion is given below.
3.1.4 Critical Flow
An important part of modeling primary system blowdown is the
pre-diction of the discharge flow rate from the broken coolant pipe. This
flow is critical during the subcooled and saturated phases of blowdown
and hence is independent of containment pressure.
Experiments reported in Ref. 10 indicate that during the
sub-cooled phase of decompression, the break flow thermodynamics are
non-equilibrium. At least one vendor (5) uses a nonequilibrium critical
This same model, along with the Moody and homogeneous equilibrum
critical flow models was used to predict pressures for blowdown of a
typical PWR. With all input parameters but the critical flow model
made equal, the nonequilibrium flow model gave a more rapid
decom-pression and higher pressure loads than either of the other two models.
Unfortunately the model is unavailable for proprietary reasons.
3.1.5 Multi-dimensional Effects
The methods for blowdown analysis described in the literature
contain largely one dimensional flow models (4,5,9). However, in
components where the detail of spatial representation has a profound
effect on the calculation of loads, the flow is modeled in higher dimensions and with fine nodalization.
The depressuraization of the downcomer following a cold leg
nozzle break is highly asymmetric and hence a case for
multi-dimen-sional flow modeling. In the standard representation (6), pressure
changes in the fluid due to structural motion are neglected. The
region is then treated as a thin two-dimensional layer of fluid of
constant thickness.
One vendor has investigated the effect of downcomer spatial
representation (dimensionality and nodalization) on the predicted
space-time decompression of the region (5). In this study, two full
representations of the primary system were examined. The models
dif-fered only in the degree of spatial representation in the downcomer
region. Unfortunately, the exact models and results have been deleted
3.2 Los Alamos Laboratory Research
The major thrust of the Los Alamos research in methods for the
calculation of LOCA forces has been in investigating the effect of
uncoupled fluid-structural analysis. That is, the blowdown induced
forces acting on the reactor vessel internals have been calculated
using an uncoupled fluid-structure procedure. In this approach, the
fluid pressures and shears are first computed from a hydrodynamic
model that considers the walls of the structure to be rigid. The
resulting time history of forces is then applied to the structural
model to determine its response. The assumption here is evident:
feedback of structural deformations to the fluid is neglected. The
uncoupled method is judged to be conservative for the following reason
(11): it is widely held that the pressures computed on a rigid wall
will be greater than if the wall is permitted to deform under the load.
To investigate the relative importance of the coupled interaction,
Rivard and Torrey (12,13,14) performed three-dimensional calculations
for the dynamics of the fluid and core support barrel of the HDR
reactor (Fig. 3.2.1) vessel during blowdown. Besides investigating
fluid-structure coupling, they also examined (a) the adequacy of a
two-dimensional fluid modeling in place of the three-dimensional
representation, and (b) the effect of a mass ring placed at the bottom
of the core barrel to simulate the core mass and stiffness.
In their work, the fluid is represented by the two fluid, six
equation model. These equations are solved by the code KFIX (15).
The cold leg break is simulated by imposing the pressure history shown
in Fig. 3.2 as a boundary condition. The core barrel is modeled as
at the bottom. The code FLX solves the corresponding structural
dynamics equations. A coupled calculation is obtained by passing the
fluid pressure as an external force to the structural code while
pass-ing the structure velocity as a differentiated boundary position to
the fluid code. In their uncoupled calculations the same algorithm
is used except that the structure velocity passed to the fluid code is
explicitly set to zero. In this way the fluid dynamics are calculated
for a rigid core barrel.
The first set of calculations performed were for the coupled and
uncoupled blowdown of the pressure vessel shown in Fig. 3.1. The
results indicate the relative importance of fluid structure-coupling.
Figures
3.3a-d
show the radial deflection of the core support barrel in the 6=0 plane through the break. The inward deflection of the corebarrel at 10 and 20 ms accomodates the fluid displaced downward by the
bulging of the core barrel in the vicinity of the broken nozzle.
Figure 3.4 shows the response of the core barrel bottom directly
below the break. Note the frequency and amplitude are smaller for the
coupled case. Figures 3.5a-d compare the axial bending stresses at
the top of the core barrel. This was shown to be the most significant
stress acting at this location. Often it is also the location of the
maximum stress. Figure 3.6 shows the effect of coupling on the time
history of stress at the core barrel top next to the break.
A second set of calculations were performed to investigate the
adequacy of a coupled two-dimensional fluid modeling in place of the
coupled three-dimensional representation. A simple depressurization
plenum and core regions. The two-dimensional representation of the
downcomer region was retained, however. Figures 3.7a-d show the
radial deflection of the core barrel in the plane 0=0 for the two- and
three-dimensional calculation. Rivard and Torrey judge the
two-dimensional calculation to be adequate for determining deflection
pro-files. Figures 3.8a-d give the axial bending stresses for the
two-and three-dimensional coupled calculations. Differences of 25% to 40%
occur. The two-dimensional case required 9 minutes of CDC 7600 time
compared to 56 minutes for the three-dimensional case.
A third set of calculations were performed to investigate the
effect of the core internal structures on the core barrel dynamics.
The stiffness and inertia of the internal structures were simulated by
a mass ring placed on the inside of the core barrel at its bottom
boundary. Three-dimensional calculations were performed for this
con-figuration. Figures 3.9a-d compare the radial deflection of the core
barrel through the plane 6=0 with and without the mass ring. The ring
is seen to reduce the deflection at the bottom boundary. Figure 3.10 compares the deflection history of the core barrel bottom in the plane
6=0. The mass ring reduces deflections by a factor of two. Figure 3.11
compares the axial bending stresses at the top of the core barrel. The
stress magnitude is seen not to change significantly.
A parallel but independent line of investigation is being carried
out by Diennes et al. (9,16,17,18). They have divided their study of
fluid-structure interaction into three separate phases (18). The first
phase involved the development of a coupled fluid-structure code to
The results of experiments conducted with this device were used as the
basis for code refinements. The second phase will simulate the asymmetric
geometry of a PWR in blowdown, but without the complexities of internal
structures. Experimental data for the HDR reactor will be compared
against analytical predictions. In the third phase, the effects of
internal structure will be included in the code.
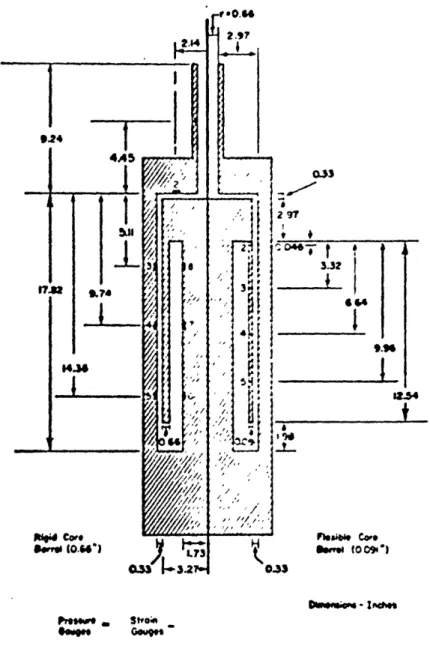
Their study of blowdown in the axisymmetric structure shown in
Fig. 3.12 is as follows: the fluid is modeled in twe dimensions using
the two phase drift flux approximaLion. The code SOLA-DF solves the
corresponding fluid equations in cylindrical r,z coordinates using a
finite difference scheme. The core barrel is modeled as a cylindrical
shell using the classical shell equations. These equations are solved
by the finite difference code FLX. Coupling is achieved in the same
way as described for the Rivard and Torrey work. A set of blowdown
experiments was conducted with the apparatus shown in Fig. 3.12.
Blowdown was initiated by cutting the end cap (located at top of figure
but not shown) with an explosive charge. The pretest calculations
dif-fered widely from the experimental results. However,
analytical-experimental agreement improved when the code was modified to include
(a) effects of wall velocity on adjacent fluid density that had been
previously neglected, (b) a more accurate method for calculating the
speed of sound in the fluid and (c) a heat conduction limited liquid
to vapor production model. The pressure release mechanism is believed
to be responsible for a shock wave that propagated down the apparatus
causing spurious pressure peaks to appear. The experiments will be
3.3 Karlsruhe Laboratory Research
Full scale blowdown experiments are being planned by the
Karlsruhe Laboratory for the former HDR reactor vessel (19). Schedul-d
for 1979, these experiments are intended to verify the fluid-structure
codes that have been under development at Los Alamos and Karlsruhe.
The HDR reactor vessel has been modified in several ways in preparation
for the experiments. The core barrel thickness has been reduced to
make blowdown induced deformations larger and hence fluid-structure
interaction more evident. The core barrel has been rigidly clamped
at its top since this assumption is made in the current set of codes.
A mass ring has been substituted for the core internals since the codes
do not as yet model details of the core structure. Figure 3.13
com-pares the HDR vessel with a typical PWR.
Four fluid-structure interaction codes are under development in
Germany (20). We will describe two of these, STRUYA and FLUX, both
intended to be applied to the HDR experiments.
In their coupled code STRUYA, Katz et al. (21) have adapted the
two dimensional Los Alamos code YAQUI to describe fluid flow in the
unwrapped downcomer. Flow is parallel to the fluid-structure interface
and fluid thickness is determined by local structural displacements.
The core barrel is modeled with the code CYLDY2, a semi-analytical
ap-proach that represents displacements as a sum of modal shape functions.
Computer time for this structural code is considerably less than for
general purpose finite element codes. Coupling of the fluid and
struc-tural codes to give STRUYA is currently underway.
The second coupled code, FLUX, is in a more advanced state (22).
versions for both a compressible and incompressible fluid. The
struc-ture is modeled using the CYLDY2 code. Reference 22 describes in
detail the analytical formulation. The three vessel geometries given
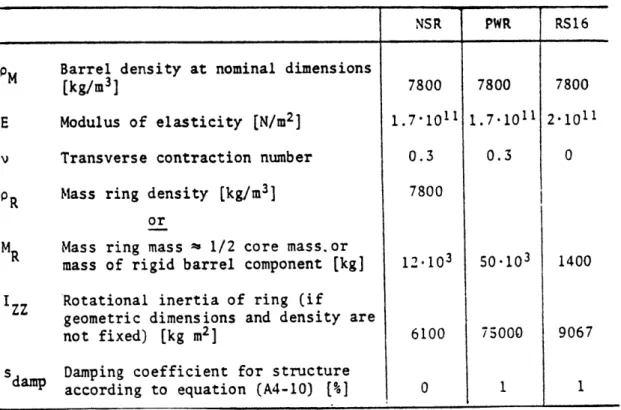
in Table 3.1 were examined with the coupled and uncoupled versions of
FLUX. In all three cases the decoupled calculation gave a conservative
value for the maximum stress in the core barrel. The coupled results
for the Battelle-Frankfurt vessel agree well with the data obtained
from a blowdown experiment run with this vessel. The HDR uncoupled
results are to be compared with experiment in the near future.
3.4 Structural Mechanics and Fluid Dynamics Methods
Appendix B contains a summary of available fluid mechanics,
structural dynamics and fluid-structure interaction codes. The name,
reference and source of each code is given, along with a short
dis-cussion of the code's intended use and numerical method. In addition,
Table 3.1 INPUT PARAMETERS FOR NSR, PWR AND RS16 SITUATIONS Table a. Geometric Data [m]
NSR PWR RS16
RM Radius of core barrel center plate 1.3185 2.145 0.3065 LM Length of annulus = dynamically
effective length of core barrel 7.57 8.24 7.39
RS Vent radius 0.100 0.4025 0.0715
LF Distance of nozzle axis from flange
support 0.72 1.12 1.34
HR Annulus width 0.150 0.315 0.077
HM Core barrel shell thickness 0.023 0.080 0.008 LS Length of blowdown nozzle (short/long) 1.10 3.7 0.35
/5.43 /6.0 /
-RRI Mass ring, inner radius 0.81 1.20 0.2
RR1 Mass ring, outer radius 1.105 2.105 0.3065
BR1 Height of mass ring 0.75 0.682 0.3065
BR2 Height of intermediate ring 0.14 0 0.13 RRA Outer radius of intermediate ring 1.307 0 0.13
LU Effective height of upper plenum: so
that -m RV2LU = volume of upper plenum 1.0 1.6 1.97
LL Effective height of lower plenum: so
that T RV2LL = volume of lower plenum 1.8 1.5 1.7
Rv Pressure vessel inner radius =
SRM + HM/2 + HR 1.48 2.50 0.3875
fhole Component of hole area on flange
relative to annulus cross-section =
Table b. Core Barrel Physical Constants
NSR PWR RS16
PM Barrel density at nominal dimensions
[kg/m3] 7800 7800 7800
E Modulus of elasticity [N/m2] 1.7"1011 1.7-1011 2.1011
v Transverse contraction number 0.3 0.3 0
pR Mass ring density [kg/m 3
] 7800
or
MR Mass ring mass f 1/2 core mass.or
mass of rigid barrel component [kg] 12.103 50.103 1400 I Rotational inertia of ring (if
geometric dimensions and density are
not fixed) [kg m2] 6100 75000 9067
s damp Damping coefficient for structure
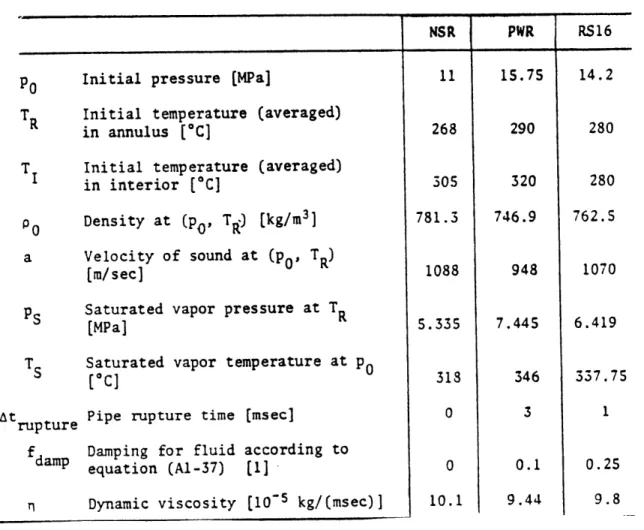
Table c. Characteristic Fluid and Input Data (NSR for Test 3, RS16 for Test PWR5)
Initial pressure [MPa]
T Initial temperature (averaged) in annulus [OC]
T Initial temperature (averaged) in interior [°C]
p0 Density at (po, TR) [kg/m
3 ]
a Velocity of sound at (p', TR) [m/sec]
PS Saturated vapor pressure at TR
[MPa]
T
Atrupture
Saturated vapor temperature at p0
oC]
Pipe rupture time (msec]
f Damping for fluid according to damp equation (Al-37) [1]
Dynamic viscosity (10- 5 kg/(msec)]
NSR PWR RS16 11 268 305 781.3 1088 5.335 318 0 0 15.75 290 320 746.9 948 7.445 346 3 0.1 14.2 280 280 762.5 1070 6.419 337.75 1 0.25 9.44 9.8 10.1
t
-t
2 0 7488 9216 I I-133 II I 484 Fig. 3,1Geometry of HDR pressurized water reactor vessel. Dimensions are in meters. (Ref. 13)
11.0
-
9.0
aa
7.0-5.00
10
20
30
40
Time (ms)
Fig. 3. 2
Prescribed pressure history at the cold leg
break that is used as a boundary condition for
the calculations. (Ref
13)
5.0 C 4.0 3.0 Time x IOms Uncoup!ed -0.2 -0.1 0 0.1 0.2 0.3 0.4 0.5 Radial Deflection (cm) 8.0 r o Coupled 3.0-2.0 Uncoupled 1.0 ).2 -P.1 0 0.1 02 03 0.4 05 0.6 0.7 0.8 0.9 Radoal Deflection (cm) (a) (b) E 4 4 0 4 R 1,6 Uncoupled I /I Time- 30 ms Coupled - 1 1 0 0.1 0.2 Radial Deflection (cm) 5 4 0 4 35 x 3 0.3 0.4 0.5 Time 40 ms -0.2 -0.1 0 0.1 0.2 0.3 0.4 0.5 Radial Deflection (crm)
(c)
(d)
Fig. 3.3Radial deflections of the core barrel in the plane 0 = 0* through the break at 10, 20, 30, and 40 ms after the pipe break. The results were calculated in three dimensions with and without fluid-structure coupling. (Ref. 13)
-0.2
.r- = 7rl LV IsI 111115-(
Coupled
Time (ms)
Fig. 3.4
Radial deflections of the core barrel bottom directly below the break calculated in three dimensions with and without fluid-structure coupling. (Ref. 13) 10 0.5 o 0 0 -05
Time= 10ms Uncoupled \\ ---1.0 2.0 Angle (rod) . 200 0. 2.0 b , 150 S ()O a, *,,.00 00 4 3.0 4.0 (a) Time- 20 ms Uncoupled Coupled 50 1-1.0 2.0 3.0 4.0 Angle (rod)
(b)
Time= 30 ms bt (,I
1
!
I ,
1.0 2.0 3.0 4.0 c 0 --- Uncouped Uncoupled 100 -, --. /-Uncoupled 50 -50 I % _ I t I 1.0 2.0 3.0 -100 L(c)
Coupled(d)
Fig.
3.5
Axial bending stresses at the top, built-in boundary of the core barrel calculated in three dimensions with and without fluid-structure coupling at 10, 20, 30, and 40 ms after the pipe
break. (Ref. 13) 250 200 150 b, b 150 100 50 0 50 100 Time= ,40 ms 4.0 Angle (rod)
300 -o .Coupled 4 ' I I # 10 20 30 40 Time (ms) It -o1 - / Fig. 3.6
Axial bending stresses at the top of the core
barrel in the plane 0 = O0 through the break calculated in three dimensions with and without fluid-structure coupling. (Ref. 13)
P
~
4.0 4 -0.2 -0.1 0 0.1 Radial Deflection (cm) Time. 0 me 50 0 40 0.2 0.3 0.4 0.5 TIo . 3 m, Radital eflection (cm)(a)
8.0 7.0 6.0 S50 O 4.0 (b) Time - 30 me ,- 3D(16.28) E P 4.0 q 30 Time. 40 ms 0.3 0.4 0.5 Radiaol Delection (cm)(d)
Fig. 3.7Radial deflections of the core barrel in the plane € = 0* through the break at 10, 20, 30, and 40 ms after the pipe break. The results were calculated with two- and three-dimensional fluid descriptions and structural coupling. (Ref. 13)
Rodlal Deflection (cm)
200 150 -Time lIOms --- 20,30(16,28) 100 Time = 20 ms 30(16,28) 20(16,28) 50 H 1.0 2.0 3.0 4.0 Angle (rod) (a) 1.0 2.0 Angle (rod) 3.0 4.0
(b)
Time =30ms 30(16,28) 2D(16,28) I I I I 0 1.0 2.0 3.0 4.0 Angle (rod)(c)
Fig. 3.8Axial bending stresses at the top, built-in boundary of the core barrel calculated with two-and three-dimensional fluid descriptions two-and structural coupling at 10, 20, 30, two-and 40 ms af-ter the pipe break. (Ref. 13)
200 0 o a. 150 b &i 100 C m S50 N - 200 0 150 - 100 o S50 -100 -150
(d)
i o 40 .5 o Time -10 m Moss Ring 50 40 3.0
-Witt Mass Ring
-0.2 -0.1 0 01 02 0.3 04 05 Radial Deflection (cm) -0.2 -0.1 0 01 Radial Deflection (cm) (a) Time* 20 ms
Withou Mass Ring
With Mass Ring
0.2 03 0.4 0.5
(b)
Time 30 me
- Without Moss Ring
,..-With Mass Ring
-0.2 -0.1 0 01 02 03 04 0.5
Radial Deflection (cm)
Time 40 me 70 \
6.0
-- With Mass Ring
5.0
4.0 /
/ Without Moss Ring
L L I i _l I \ I
-0.2 -01 0 01 0.2 03 0.4 05 Radial Deflection (cm)
(c)
(d)Fig. 3.9
Radial deflections of the core barrel in the plane 0 = 00 through the break at 10, 20, 30, and 40 ms after the pipe break. The results were calculated in three dimensions with and without
the bottom ring. (;,C . 13)
8 40
44
Without Mass Ring
With Moss Ring
0
t
30 40Time (ms)
-0.5
-Fig. 3.10
Radial deflection of the core barrel bottom directly below the break calculated in three dimensions with and without the bottom ring.
TimseiO ms
With Moss Ring Without Moss Ring
1O 2.0 Angle (rod) 200 0 a 150 N b S 100 Ioo M C u0 n, 50 N 3.0 4.0 (a) Time a 30 ms
With Moss Ring
2.0 Anre (rod)
(c)
3.0 4.0 I. Time 20 msWithout Moss Ring
With Moss Ring
1-0 1.0 2.0 3.0 4.0 Angle (rod)
(b)
Times 40ms Angle (rod) 1 1.0 2.0 3.0 4.0 With MossWithout Moss Ring
-150 L
(d)
Fig. 3.11
Axial bending stresses at the top, built-in boundary of the core barrel calculated in three
dimensions with and without the bottom ring at 10, 20, 30, and 40 ms after the pipe break.
(Ref. 13) 200 50 b 15 o r 50 200 150 0100 U, 0 o 4._N0 Ring -50 -100
rid Core 0rr (O.M") 2.97 33 2 97 Mrbi Co* *** (009*') H 03) Prts0 e, Stro? **o** Gove*"
Geometry of the planned hydroelastic experiment shCvlnR the location of pressure and strain gauges. The geotetry L in saoe respects that of a 1/25 scale PWR, modified to allow axisy~ etric scoping calcu
a-tims. The thick shell geooetry is shown on the left and the thin shell on the right. Strain gauges will be located at several
satuth-.1 locations to investigate the eystry.
Fig. 3.12 Axisvmnetric Blowdown Apparatus (Ref. 18)
-
3360-17-020-~1
PWR of the
1200 MW-type
Fig.3.13Geometry
HDR experimental
facility
of PWR, HDR und FLUX
geometrical
model
of the HDR used
in FLUX
m
odel
(Ref. 20)=
1w05270
Upper plenum
f
aFlange
LU
Hole
Core
barrel
LF
Blowdown vent
-
2-
R
Interior
H
LS
-LM
Annulus Intermediate ringRRI
SBR2
BR1
B2
RR1
RMass
ring
RRALL
Lower plenumFigure 3.14 Geometry Parameters in FLUX Model. (The Ring is divided into two parts only with reference to computation of rotational inertia in the structure model. In the fluid dynamic component RR = RR = .)
4. EXAMINATION OF ASSUMPTIONS
The calculation of blowdown induced forces may involve a number
of assumptions and approximations which help to make the problem more
tractable. The appropriateness of such assumptions and their effect
on the calculated results must be assessed. To that end, this chapter
will highlight a number of these assumptions, including both qualitative
and quantitative assessments.
4.1 Sonic Velocities
The calculation of sonic velocities is important in determining
the propagation of pressure waves through the reactor flow paths during
a LOCA. In order to have a well-understood source for sonic velocities,
subcooled liquid tables were used to derive needed partial derivatives
by numerical differentiation. The sonic velocities were then
calcu-lated using the following equation:
C = R (4.1.1)
T
where C = sonic velocity, evaluated for isentropic conditions;
R = partial derivative of density with respect to pressure, holding temperature constant;
R = partial derivative of density with respect to temperature, holding pressure constant; and
SpS T = corresponding partial derivatives of entropy.
Results indicated that, for the cold leg conditions of Table 2.2
(15.6 MPa, 2900C), C was approximately 1010 m/s. For the hot leg
con-ditions (15.5 MPa, 3180C), C was approximately 850 m/s. These velocities


![Table 3.1 INPUT PARAMETERS FOR NSR, PWR AND RS16 SITUATIONS Table a. Geometric Data [m]](https://thumb-eu.123doks.com/thumbv2/123doknet/13966334.453328/40.918.163.785.265.1054/table-input-parameters-for-situations-table-geometric-data.webp)