Improving web servers focused DoS attacks detection
Olivier Paul GET/INT 9 rue Charles Fourier
Evry, France [email protected]
Abstract— On the Internet, web servers are often the main interface between companies or individuals and the rest of the world. As a result they represent valuable targets for attackers. Although several types of attacks are possible against web server we focus in this paper on flooding based denial of service attacks. We explore the detection of saturation attacks against web servers as well as the precise identification of attack participants. Compared to other approaches this model provides improved detection capability for focused attacks.
Keywords: DoS.
I. INTRODUCTION
Over le last ten years, the Internet has become an ever-increasing marketplace for most companies. Even if large companies occupy today well known locations in the Internet, the Internet space is also filled with a large number of smaller companies providing services or information to their customers through the Internet. As business operations are gradually ported to the Internet, mobsters have also turned part of their activities into this world. Usually these organizations take advantage of infected computers owned by unaware users in order to attack their victim. Although vulnerability based attacks can bring large benefits to attackers, systematic saturation attacks are largely employed since they are likely to succeed and do not require any prerequisite from the victim. Large companies are usually able to protect themselves from these threats preventively by over-dimensioning their systems, using replication services or when attacks occur by using network operator services (blackhole filtering, sinkhole...). These services are unfortunately often unavailable for small or medium companies for cost reasons.
Today, many "in network" detection schemes are based on packet based or flow based measures for performance reasons [2], [3], [4], [5], [6]. This often leads to coarse grain attack detection signatures based on network level parameters such as the destination address and port. Such coarse grain signatures are not always sufficient to block attack traffic appropriately. For example during the MyDoom worm attack in 2004, web servers of Microsoft and SCO were saturated through continuous HTTP requests to specific web pages from worm instances [23]. Such requests could not be blocked since distinguishing between correct and worm generated requests would have required HTTP request URI analysis which was impossible for performance reasons.
In this paper we restrict ourselves to the analysis of HTTP traffic. In [7] we introduce a tool allowing HTTP traffic
information to be inferred from network level measures at multi gigabit speeds for small and medium sized servers. In this paper we investigate how such a tool might be used to protect such servers against some of existing saturation threats [21]. Compared to existing work [16], [17], we expect to improve the detection speed in the case of attacks using focused requests by monitoring less aggregated parameters when taking application level information into account. We also expect to improve the detection precision in the case of attacks using focused requests by generating precise attack signatures including application level descriptors allowing more legitimate users to be excluded from mitigation measures. We position ourselves in a multiplexed mitigation environment such as the one found in [4]. The paper is organized as follows: Section II describes the architecture our proposal is based on. Section III presents our overuse detection model. The next section presents an implementation of our proposal as well as tuning issues. It also provides tests results performed on a local web server. Finally we conclude in section V.
II. WEB TRAFFIC INFERENCE
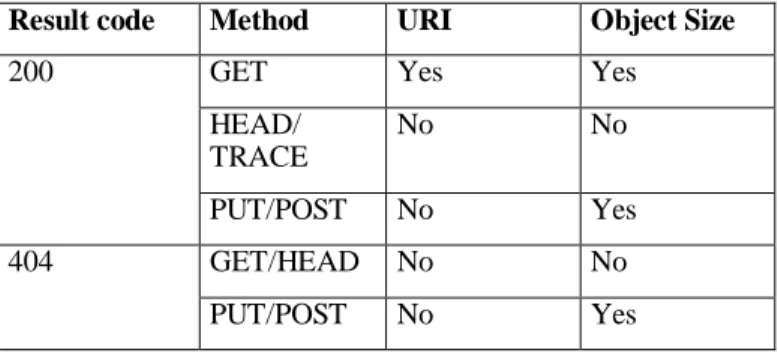
The core of our architecture is based on RequIn [7]. RequIn is a web traffic inference tool that uses network level measures (flow sizes, number of packets, source and destination addresses and ports...) to infer application level information. The amount of information inferred from network level measures depends on the type of request performed (GET, HEAD, POST...) and the corresponding result code (200, 404, 304...). These two parameters are themselves inferred from network level measures. TABLE I. provides the relation between inferred result code, method, URI and object size.
TABLE I. INFERRED HTTP HEADERS DEPENDING ON HTTP RESULT CODE AND METHOD.
Result code Method URI Object Size
GET Yes Yes
HEAD/ TRACE No No 200 PUT/POST No Yes GET/HEAD No No 404 PUT/POST No Yes
TRACE No No GET/HEAD/ TRACE No No 304 PUT/POST No Yes Other Any No No
III. OVERUSE DETECTION
A. Detection Model
Statistical Process Control techniques (SPC) have been used for decades for controlling the quality of manufacturing or industrial processes. Recently research on the application of SPC techniques for denial of service detection has been a very active field. For example Cumulative Sum (CUSUM) based techniques have been successfully used with quasi-stationary processes such as TCP SYN/FIN segments numbers ratio [5] or the number of IP addresses in use in a network [4] as well as non stationary processes (number of TCP SYN packets [12]). Other SPC related techniques such as Holt-Winters forecasting [16] have also proven useful.
In this paper we investigate another commonly used SPC class of techniques based on the Exponentially Weighted Moving Average (EWMA). EWMA based techniques have been successfully used for computer intrusion detection by Ye and al. [8]. In this paper we however investigate how EWMA could be used in a denial of service attacks detection context.
EWMA charts are usually used to monitor changes in the mean of a process. If the data to be monitored results is a sequence of independently distributed observations Xt the value
of the EWMA statistic can be computed as follows: 1 , ,t = t+(1− )⋅ Xt−
X X W
W λ λ
Where λ is a constant belonging to the ]0;1] interval. In that case upper (UCL) and lower (LCL) control limits can be computed. However in practice, observations are not always independent and uncorrelated. Several techniques exist in order to cope with correlated data including changing the control limits computation scheme or removing the correlation for the measured signal by modeling the correlative structure with an appropriate time series model [11]. Such a task can however be a time consuming. When the signal follows particular models, approximate techniques have been developed in order avoid this task. For example Montgomery and al. [9] have suggested using the EWMA statistic WX,t as a one step ahead predictor for
Xt allowing the et residuals to be computed as follows.
1 ,− − = t Xt t X W e
In the case of signals following an IMA(1) (First order Integrated Moving Average) model, the residual function is expected to be independently and identically distributed with mean zero [9]. A moving centerline EWMA control chart can then be constructed combining the state of statistical control and process dynamics. In such a chart, control limits can be constructed as follows: e t X t W c UCL = , + '⋅σ LCLt =WX,t−c'⋅σe
Where σe is the variance of the et process and c' a positive
constant tuning value. σe can be estimated using a smoothed
variance. Such smoothed variance can be obtained by applying an EWMA to the et residual values.
2 1 , 2 2 ,t = ⋅ t +(1− )⋅ et− e α e α σ σ
Where α is a constant belonging to the ]0;1] interval. [9] notes that even a process that is not pure IMA(1) should be manageable using this technique if the process mean does not drift too quickly.
In order to keep detection time as short as possible, we use short monitoring intervals. However because of the bursty nature of web traffic, using direct values of the monitored process would lead to a large number of false detection events. In order to avoid this, we use a smoothed version of the monitored process where xt is the true monitored process and
β a smoothing constant belonging to the ]0;1] interval.
t t
t x X
X =β. +(1−β)⋅
B. Monitored parameters
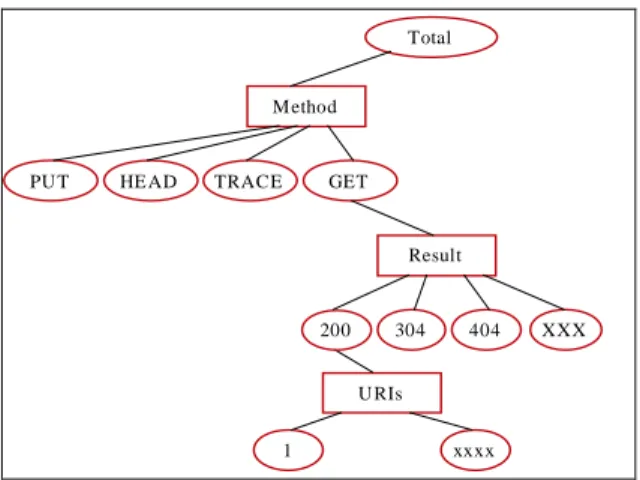
Our goal is to discover attacks whether they target a specific type of request or use more general patterns by frequently changing the method, the object or the operation result. In order to do so we monitor fine grain parameters such as the number of requests performed on every object present on the server as well as more aggregated parameters allowing more diffuse attacks to be detected. Figure 1. describes the different levels of aggregation used in our detection scheme. As shown in Figure 1. , URI variables are aggregated according to the method and result for selected values.
As requests are often described using 2 or 3 parameters, several variables in Figure 1. can change simultaneously. These variables are moreover often correlated. This correlation can result in either false out of control detection events or lack of detection [13]. Using multivariate control techniques might be an option to solve this problem. However the number of monitored variables as well as the need to identify precisely variables responsible for out of control events led us to choose an ad hoc procedure. Detection operations on correlated parameters are organized from the most specific parameters to the least specifics. We do so by checking, at each level from bottom to top, whether an out of control event at a given level can be explained by out of control events at a lower level in the tree. To do so we maintain aggregated attack rates associated with square nodes in Figure 1. These rates represent the sum of the rate of ongoing attacks on children nodes and are subtracted from monitored values of upper nodes for detection operations. Using this strategy, we should only detect attacks on aggregated descriptors once every more precise "explanation" has been considered.
Among events observed in Figure 1. , some happen very rarely. For instance, on our test server some URIs were only requested once over the log file in our possession. Because formulas presented in section III.A would not provide us with any valuable bounds for such rare events, we monitor such events by assigning them with a fixed maximum frequency.
Total GET Method PU T HE AD TRACE U RIs 1 xxxx Result 200 304 404 XXX
Figure 1. Monitored variables.
C. Volume based filtering
When a set of requests generates an out of control detection event an attack event is created and associated with the corresponding node. This parameter called signature is used to aggregate future attack events with the same characteristics. We associate to each attack event the IP addresses of the source of the requests sharing the same signature. This aggregation is currently controlled by two parameters, the maximum number of aggregated attack events and the maximum aggregation time.
Because attackers might perform random requests on the server, the attack signature might be sufficiently wide to encompass almost any type of requests. In such a case, any user performing a request is likely to share the same signature and be included in the list of attack sources. In order to limit this problem it would be desirable to sort attack sources according their contribution to the attack in term of number of requests. In order to avoid storing any possible source, we use an address cache with a predefined size where sources are maintained using a least recently used strategy.
IV. IMPLEMENTATION AND TESTS
A. Implementation
For testing purposes we developed an HTTP aware monitor based on an extension to FreeBSD IPFilter packet filter. This monitor is able to export IPFIX compliant (netflow like) records to an IPFIX collector using the Vermont [20] monitoring package. IPFIX allows data to be transported in an inexpensive manner by allowing records aggregation as well as using template/data separation.
As represented in Figure 2. , the detection algorithm presented in section III was implemented as a part of a detection module [10]. The whole configuration of the detection module is performed through an external configuration file. Initial control limits are computed at startup using a simplified training log file provided to the detection module. Within the detection module, the detection engine receives inferred requests from the inference engine. This inference is performed using IPFIX records after extracting and in some case translating (i.e. estimation function in Figure 2. )
IPFIX record information element values. Estimation functions are meant to adapt the received information to the inference model. When an attack is detected, an IDMEF [19] compliant notification is generated through a notification module.
IPFIX records Parameters Extraction Parameter Estimation Detection Module IDMEF events to Policy Engine Inference DB Notification Module Estimation Inference Detection Models Parameter Estimation Inference Engine Detection DB Detection Engine Estimation DB Target DB Targets/ Threshold Definition
Figure 2. Detection Module Architecture.
B. Tests
The inferred information from the inference engine is passed to the detection engine for detection operations. This detection engine implements the moving centerline EWMA described earlier over 10 seconds intervals. We performed several series of tests using a local web server. This server contains roughly 20k objects and receives 7.5k requests everyday. During the tests a group of attackers sends attack requests to the server while a group of normal users sends normal requests. Normal requests are expected to mimic legitimate traffic and are generated using the server logs. For each test, attack and normal traffic with different characteristics were generated by changing :
• The focus of the attack (ie, requests with a fixed set of object/operation values or requests with randomly chosen object/operation values).
• The number of attack requests that were generated per second. (i.e. 1/2, 1, 2).
• The duration of the attack in number of requests (i.e. 60, 600).
In this test, addresses are not taken into account in the detection step. As a result legitimate and attack requests are performed from a single device. The monitoring element currently also running the detection module acts as a router between the traffic generator and the server. For every attack we measured the number of correctly detected attack events (number of requests detected as belonging to the attack during an attack session) as well as the percentage of attack requests correctly detected (true positive ratio, TP). We also measured the number of incorrectly detected attack events (number of requests detected as belonging to an attack outside an attack session) as well as the percentage of attack requests wrongly detected (false positive ratio, FP).
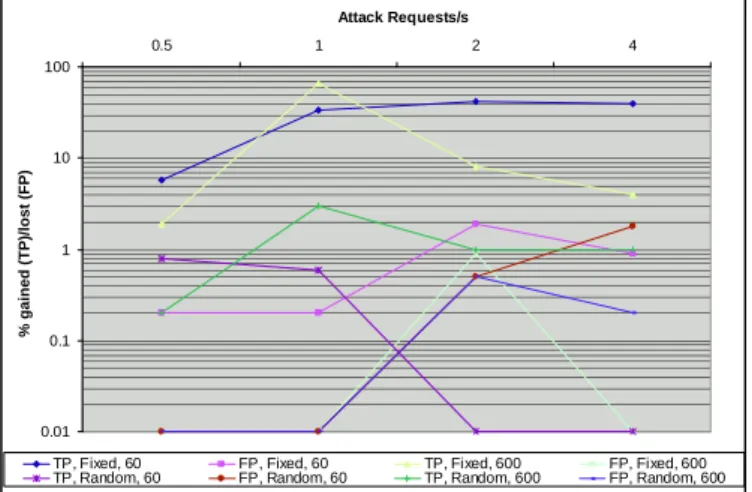
In order to compute the benefits and costs associated with using application level information we performed two kinds of tests. In a first step we use the change point detection strategy
described in section III.A but only taking the total number of requests into account. In a second step we test our proposal using application level information as previously described. We then compute for each scenario the difference between the FP and TP rates during both tests. This difference represents the benefit (for the TP rate) and cost (for the FP rate) associated with our technique. They are represented in Figure 3. for parameters (β=0.15, λ=0.1, α=0.0001, c'=3). 0.01 0.1 1 10 100 0.5 1 2 4 Attack Requests/s % g a in e d ( T P )/ lo s t (F P )
TP, Fixed, 60 FP, Fixed, 60 TP, Fixed, 600 FP, Fixed, 600 TP, Random, 60 FP, Random, 60 TP, Random, 600 FP, Random, 600
Figure 3. Benefit and costs when using application level information.
Overall, our technique provides faster detection in all cases at the cost of an increase in the number of falsely detected attack events (between 0.1% and 0.8% on average). When aggregated according to the aggregation scheme described in section III.C these false detection events occur on average once every 4.5 hours. The benefits are, as expected, much higher in the case of focused requests in particular for slow or short attacks.
Increasing the value of the β smoothing parameter increases the sensitivity of the detection that translates in a higher number of detected attack events but also increases the number of false positives. In practice β values in the [0.1;0.2] range brought good results. Other λ and α values where tested without bringing better results.
V. DISCUSSION AND CONCLUSION
In this paper we explore the benefits that might be obtained by combining application level information with a well-known change detection algorithm. Our conclusion is that such an approach is mainly beneficial when focused requests are used by attack tools. In such a case, not only do we learn about the attack faster but we can also provide precise information about the attack. This information could be useful when addresses are not sufficient to identify attackers (proxies, NAT...) or as a part of a preventive strategy. Although a strategy of attack using one or a few focused requests is widespread today as witnessed by existing bots available functions [21] or by some attacks analysis [18], it would be easy for potential attackers to modify existing tools to generate random requests from a predefined list. In such a case our proposal provides detection results similar to those obtained when not taking application level information into account.
A potential problem with our approach in the case of a non-focused attack is the fact that legitimate users can, in a case of a largely distributed attack, generate more traffic than most attackers. In order to solve this problem with suggest to combine the approach presented here with an approach as the one we developed in [22] where detection operations are no longer based on traffic requests volumes variations.
VI. REFERENCES
[1] Real-Time Mitigation Of Denial Of Service Attacks Now Available With AT&T Internet Protect. ATT news release, June 2004. Available at: http://www.att.com/news/2004/06/01-13096.
[2] T.M. Gil, M. Poleto, MULTOPS: a data-structure for bandwidth attack detection, in: Proceedings of 10th Usenix Security Symposium, August 13-17, 2001.
[3] Polly Huang and al. A Non-intrusive, Wavelet-based Approach to Detecting Network Performance Problems. ACM SIGCOMM Internet Measurement Workshop 2001. November 2001.
[4] T. Peng, and al. Protection from Distributed Denial of Service Attack Using History-based IP Filtering. IEEE ICC 2003. May 2003.
[5] Haining Wang and al. Detecting SYN flooding attacks. IEEE INFOCOM '2002. February 2002.
[6] Chen-Mou Cheng, H.T. Kung, Koan-Sin Tan. Use of Spectral Analysis in Defense Against DoS Attacks. GLOBECOM 2002. November 2002. [7] Olivier Paul, Jean Etienne Kiba. Tradeoffs for Web Communications
Fast Analysis. In proceedings of the 2005 IFIP Networking conference. May 2005.
[8] Nong Ye and al. Computer Intrusion Detection Through EWMA for Autocorrelated and Uncorrelated Data. IEEE Transactions on Reliability, Vol. 52, No. 1, March 2003.
[9] D. C. Montgomery and C. M. Mastrangelo, Some statistical process control methods for autocorrelated data, J. Qual. Technol, Vol 23, No. 3, 1991.
[10] G. Münz, O. Paul, F. Dressler, "Initial Violation Detection Prototype," DIADEM Technical Report D9, July 2005.
[11] Jakob Edo Wieringa. Statistical Process Control for Serially Correlated Data, PhD Thesis, Groningen University, 1999.
[12] Vasilios A. Siris and Fotini Papagalou. Application of Anomaly Detection Algorithms for Detecting SYN Flooding Attacks. In proceedings of GLOBECOM 2004. December 2004.
[13] D. C. Montgomery, Introduction to Statistical Quality Control. Wiley and Sons Editors. 1996.
[14] Cisco systems, Cisco IOS NetFlow Overview, May 2005.
[15] Félix Hernández-Campos & al., Tracking the Evolution of Web Traffic: 1995-2003, In proceedings of MASCOTS 03, October 2003.
[16] Jake Brutlag, Aberrant Behavior Detection in Time Series for Network Monitoring, 14th USENIX Systems Administration Conference, 2000. [17] Frank Kargl and al. Protecting Web Servers from Distributed Denial of
Service Attacks. In proc. 9th Intl. WWW Conference, pages 514--524, 2001.
[18] Jaeyeon Jung and al. Flash Crowds and Denial of Service Attacks: Characterization and Implications for CDNs and Web Sites. In proc. 10th Intl. WWW Conference, May 7-11, 2002, Honolulu, Hawaii, USA. [19] H. Debar and al., The Intrusion Detection Message Exchange Format,
draft-ietf-idwg-idmef-xml-14, work in progress, January 2005. [20] VERsatile MONitoring Toolkit, available at http://vermont.berlios.de/.
2005.
[21] LURHQ Threat Intelligence Group. Phatbot Trojan Analysis. Available at www.lurhq.com/phatbot.html. March 2004.
[22] Olivier Paul, Scalable fine grain monitoring against web servers overuses. Submitted for publication.
[23] LURHQ Threat Intelligence Group. MyDoom.C Analysis. Available at www.lurhq.com/mydoom-c.html. February 2004.