An Approach to Improving The Power Management
System in Electronic Devices
by MASSACHUSETS N
OF TECHNOLO:'
Jui
Min Lim FCUErJUN
1
6
2010
LIBRARIES
Bachelors of Science, Chemical Engineering
Syracuse University, 1996
ARCHNES
Masters of Engineering, Materials Engineering University of Arizona, 2005
SUBMITTED TO THE SYSTEM DESIGN AND MANAGEMENT PROGRAM IN PARTIAL FULFILLMENT OF THE REQUIREMENT FOR THE DEGREE OF
MASTER OF SCIENCE IN ENGINEERING AND MANAGEMENT at the
MASSACHUSETTS INSTITUTE OF TECHNOLOGY
June 2010
©
2010 jui Min LimAll rights reserved.
The author hereby grants to MIT permission to reproduce and to distribute publicly paper and electronic copies of this thesis document in whole or in part.
Signature of Author: -_________________________
S so suhrign and Management Program
April 28, 2010
Certified by:
James M. Utterback
DavidWcGrath jr (1959) Professor of Management and Innovation
Thesis Supervisor
Accepted by:
DiCe' SPatrick Hale
An Approach to Improving the Power Management System
in Electronic Devices
by
Jui Min Lim
Submitted to the System Design and Management Program
April 28 2010
In Partial Fulfillment of the Requirements for the Degree of Master of Science in Engineering and Management
Abstract
The current power management technology baseline does not address the increasing gap between system charge performance and functionality needs in a smartphone. This gap can eventually inhibit further increases in functionality and develop a balancing loop effect that reduces smartphone growth rates. Longer smartphone operation duration between recharging is currently being addressed with the introduction of low power circuit chips, low power displays and power management software. This thesis explores options that improve overall power management by looking at the power source and recharging methods. This thesis also explores technology transitions and management strategies that address the different multi-mode interactions between technology transitions.
Thesis Advisor: James M. Utterback
Acknowledgements
I would like to personally thank the following great educators who have made my
investment in the System Design Management program worthwhile; Prof. Davis for his energy and his enthusiasm in expanding my vision and perspective in
Technology Strategy; Prof. Utterback for increasing my awareness of how to identify the different multi-mode interactions between technologies; Prof. Erika Wagner for her dedication and energy in guiding my XPrize team into crafting and developing an initial concept in a competition that delivers promoting mechanisms to enable energy development activities in rural regions of the world.
To all my friends that I have made in the SDM program, I wish you the best of luck in your future endeavors. I know that, with the breadth of experience we have gained from the SDM program, you will succeed at your goals.
Finally, I would like to thank my family for their patience and support. They have encouraged me to seek my dreams, even if it means sacrificing my time with them. For that I am eternally grateful. Tracey, I cannot thank you enough for your support, encouragement and wearing multiple hats in the house. Aaron, daddy will now have more time to spend with you. To my parents, words cannot express the sacrifices you made to give me a great life.
Table of Contents
A bstract ... 3
A cknow ledgem ents ... 4
List of Figures ... 8
List of Tables...10
1. Introduction...11
1.1 M obile Pho nes Thro ugh the Years ... . 11
2. M otivation...13
2.1 Battery System Trend ... 13
3. System D escription ... 16
4. Battery System A rchitecture...19
5. M obile Phone Pow er Consum ptio n ... . 22
6. Energy Storage Technology Com parisons ... 25
7. System Engineering Approach to Optimize Battery Systems... 33
8. Battery Charging System s and O ptio ns... . 38
8.1 W ireless Power Technology Overview ... 39
8.1.1 N ear Field Energy T ran sfer... . 39
8.1.2 Far Field En ergy T ransfer... . 4 1 8.2 W ireless Power Technology Param eters... 42
8.3 R echarging M ethods ... 44
8.4 Recharging Logistics ... 4 5 8.5 Integration of Split Battery System with Recharging... 47
9. Future Pow er M anagem ent System s... . 4 9 9.1 Split Battery System ... 49
9.2 Recharging Integratio n ... 52
9.3 Hardware and Software Im provements... 54
9.4 Battle From All Fronts ... 54
9.5 Performance Gap Bridging ... 55
10. Modular Architecture and Scalability... 57
11. Potential M arket Growth Opportunities... 60
12. Market Adoption Dynam ics... 67
12.1 Exogenous Influence ... 68
12.1.1 System M odularization...68
12.1.2 System Standardization ... 69
12.2 Reinforcing Loop Influence... 71
12.3 Balancing Loop Influences ... 72
12.4 Everett M. Roger's Market Adoption Perspective ... 73
12.4.1 Relative advantage factor... 74
12.4.2 Com plexity factor...75
12.5 Custom er Behavior Change Influences Market Adoption... 76
13. Technology Co-evolution...78
13.1 Technology Transition Model ... 81
13.1.1 Symbiosis Play ... 81
13.1.2 Predator-Prey Play...82
13.1.3 Pure Competition Play... 83
13.2 Technology M anagement and Leadership ... 84
14. Conclusion ... 86
14.1 Product Innovation in the Battery ... 87
14.2 Im plem entation of Resonant Magnetic Induction System ... 89
14.3 Integration of New System s Drive Com plexity...89
14.4 M onitoring Performance Trajectories is the Solution to Longevity ... 91
14.5 Different Management Strategies to Address Different Multi-Mode Interactions
14.6 Ultracapacitor and Resonant Magnetic Induction Provides Second Wind for Smartphone Growth ... 93
List of Figures
Figure 1 Battery Charge Capacity for Mobile Phone Devices ... 14
Figure 2 Gap Between Battery Energy Density and Overall System Performance...15
Figure 3 The Mobile Phone System is Part of a Larger System ... 16
Figure 4 Blackberry Phone Block Diagram ... 19
Figure 5 Power Consumption Simulation for a Phone Call...22
Figure 6 Power Simulation When Flash is Used ... 23
Figure 7 Power Simulations While Playing a Game...24
Figure 8 Relative Comparison of Volume and Weight Energy Density Between Sto rag e D ev ices ... 2 5 Figure 9 Energy Storage Efficiency... 26
Figure 10 Energy Storage Comparison Between Discharge Time Versus Power R a tin g ... 2 7 Figure 11 Capital Cost Comparison Between Energy Storage Devices...28
Figure 12 Specific Energy and Specific Power Density Comparison Between Different Energy Storage Devices... 30
Figure 13 Carbon Nanotube Ultracapacitor Mapped Into Figure 12...31
Figure 14 Energy Storage Density Improvements...32
Figure 15 Electromagnetic Resonance Wireless Power Transfer Efficiency...41
Figure 16 Wireless Power Transfer Methods by Distance ... 43
Figure 17 Power Density Comparison... 44
Figure 18 Split Management Architecture Proposal... 50
Figure 19 Split Power Management System... 51
Figure 20 Charge Density Gaps Between Consumer Needs and the Different Methods to Improve the Current Performance ... 55
Figure 21 Nintendo DSi Power Measurement When Copying Photos From System M em ory to SD Card ... 6 1 Figure 22 Nintendo DSi Power Measurement When Downloading a Game... 62 Figure 23 Nintendo DSi Power Measurement When Playing Games With Music T u rn e d O n ... 6 3
Figure 24 Nintendo DSi Power Measurement When Recording Audio With Internal M icro p h o n e ... 6 4
Figure 25 Consumer Electronics Power Management Value Creation and Value C a p tu re ... 6 5
Figure 26 Market Dynamics Causal Loop Diagram... 67
Figure 27 Capturing Value From Innovations...77 Figure 28 Performance Trajectory and Multi-Mode Interaction...79 Figure 29 Ultracapacitor and Lithium Ion Technology Multi-mode Interaction Scenario Based on Ultracapacitor Advancement...80
List of Tables
Table 1 Mobile Phone Specifications ... 21
Table 2 Capacitor Performance Comparison...30
Table 3 Pugh Matrix Selection of Energy Storage Solutions... 35
Table 4 Pugh Matrix Expansions with Multiple Combinations... 37
1. Introduction
Sales of electronic gadgets such as mobile phones, cameras, audio players and laptops continue to grow year over year. According to the Global Market Information Database (Global Market Database), 1.4 billion portable consumer electronics were sold in 2008, while in 2005 close to 1.0 billion portable consumer electronics were sold. It is expected that each of the gadgets sold came with a lithium ion battery and a corded power adaptor. The International Energy Agency (International Energy Agency) reported that an additional 280 gigawatts (GW) of new generating capacity will be needed between now and 2030 if policies that require energy efficiency in all consumer electronics are not implemented.
1.1 Mobile Phones Through the Years
Mobile phones, primarily smartphones, will be the focus of this paper. Mobile phones, which initially started with just voice, have evolved into a portable device with capabilities that mimic a personal computer. These new devices are known as
smartphones and have fully integrated communication with voice, images and text. One of the key components in smartphones that has not seen vast development or breakthrough is the battery and recharging system. These fully integrated
communication capabilities have significantly increased demand for improved battery system performance. Despite the recent publicity of wireless power transfer technology using magnetic induction techniques resulting in the availability of conduction mats, I have my doubts as to the significance that this technology will have in the consumer electronic space.
The intent of this work is to assess, from a system perspective, options to improve battery performance and recharging methods for mobile phones. I will also explore management issues in managing the integration of this new technology into the current system.
2. Motivation
How many times do you recharge your smartphone each day? Many times a day, I find myself recharging my iPhone using the Apple provided USB connection to my computer or the power adaptor. I do so because my current iPhone does not have a sufficient amount of charge to keep up with my habit of web surfing, watching videos, listening to music, and making phone calls throughout the day.
2.1 Battery System Trend
Despite advancement in the number of capabilities of a mobile phone, one area that is lacking is the battery system. In an environmental scan of phones with respect to energy charge, smartphones with full screens such as iPhone and Google Nexus One can be seen hovering at the higher end of energy charge requirements. Furthermore, through the years the strategy of increasing the overall battery system charge has been applied to enable newer and more powerful communication devices to be
functional. Unfortunately, a significant increase in operating time has not been observed with the higher charge battery systems.
Figure 1 tabulates the chronological trend of battery charge capacity for mobile
phone devices. As you can observe, the multi-functional devices with large screens are hovering at the higher end of the battery charge needs. This table further stresses the point that the only advancement in battery systems is in increasing its charge. Furthermore, despite power management devices and software that have been incorporated, overall phone operation time has not improved.
<1000mAH
2004 2005 200 2007 21M 2009 2010
Figure 1 Battery Charge Capacity for Mobile Phone Devices
It is time to review what changes should be applied to the overall battery system to accommodate a significant leap in overall operating time, overall functionality and recharging method. There have been significant investments in newer energy technologies, but many recent announcements, such as from ARPA-E (Advanced
Research Projects Agency-Energy), have been focused on large engineering systems such as transportation, carbon capturing and etc. I hope this paper will trigger some thought and debate about options for handset battery systems and provide insight into a new architecture that can address energy consumption and energy wastage from a bottom up perspective instead of top down.
... ... ... ... . - .M_ - .
-4G
e System performance enables .DI
high data rate applications * Battery energy density
increasing only 2-3% per year m vdio
cmweso
2D o-re Videp
MP3 eay Performance/stamina gap
U. - m StiCaer
Games
PD
Time
Figure 2 Gap Between Battery Energy Density and Overall System Performance
(Source: Shearer)
Figure 2 from Shearer (Shearer) illustrates the increasing gap between battery
energy density and overall system performance. Despite an increase in functionality and device capability the battery charge density performance is only improving at a dismal 2-3% rate.
3. System Description
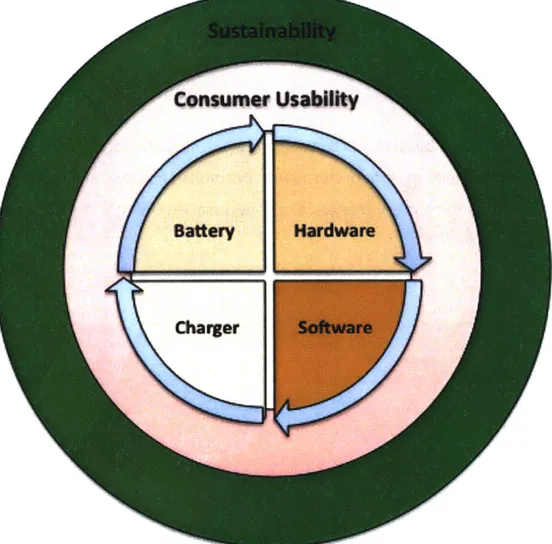
The mobile phone system is made of several sub-systems represented by concentric circles in Figure 3. The innermost circle is the smartphone system that comprises four main components that provide power efficiency and power to the system. The arrowed circle represents the constant need to fulfill the needs of consumer
usability.
Figure 3 The Mobile Phone System is Part of a Larger System
The four components are hardware, software, battery and charger.
- Hardware includes the application processor chip, memory chip, liquid crystal display, and power management chip.
e Software includes the operating system, software optimization between the
application processor and other related chips, and timing and software efficiencies to reduce operation during an execution.
* The battery provides the power to operate the device and can come in various forms such as a standalone device, like a lithium ion battery, or a combination of various other battery options.
- The charger is the standard adaptor that is shipped together with the smartphone and includes other options such as wireless charging methods.
Consumer usability needs is the need to provide a fully functional device or system that will provide constant access to the full range of smartphone applications. As with any smartphone, mobility is a key component. The user cannot have
constraints, such as having to constantly look for a power outlet or a computer in order to recharge. One can estimate that the consumer needs at least a day's worth of power because an average consumer leaves their home during the day and returns to it at night, or a traveler leaves their hotel in the morning and ends up at another location to call it a day. The capability to provide power for full functionality for more than a day is more of a desire than a current need due to reasons explained earlier.
Sustainability is an important aspect of a system and covers a multitude of different components of a system. A smartphone system requires a sustainable solution for power management where the solution can be fabricated in high volume and over an extended duration. Furthermore, as more functionality is crammed into the
smartphone, the solution has to be expandable to cover future needs through technology innovation, aside from the traditional process improvement for
incremental improvements. Design modularity is a key design feature that enables a solution to be scalable at an effective rate. Modularity aims for flexibility and
applicability across various product lines. Modularity here also requires some form of industry standardization in design and in interface.
4. Battery System Architecture
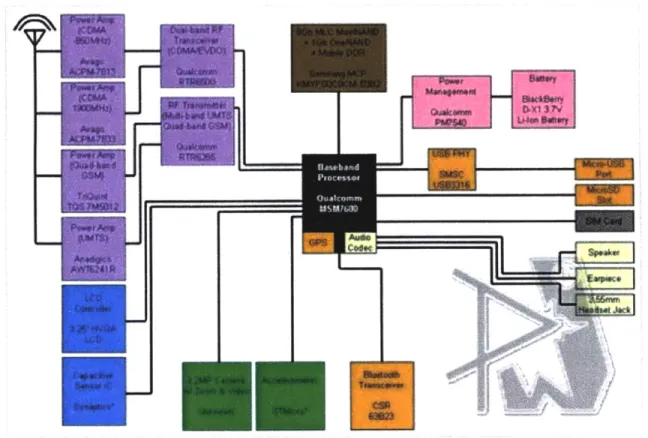
Figure 4 shows the Blackberry smartphone's block diagram from Phonewreck (Phonewreck). This figure shows the lithium ion battery connected to a power management chip, which is then connected to a processor. The processor is the brain behind the device. The lithium ion battery is a strong charge density device, and is controlled by a power management device to supply the necessary power to run the smartphone.
'I
I]
Figure 4 Blackberry Phone Block Diagram (Source: Phonewreck)
0-=:NO\
IK
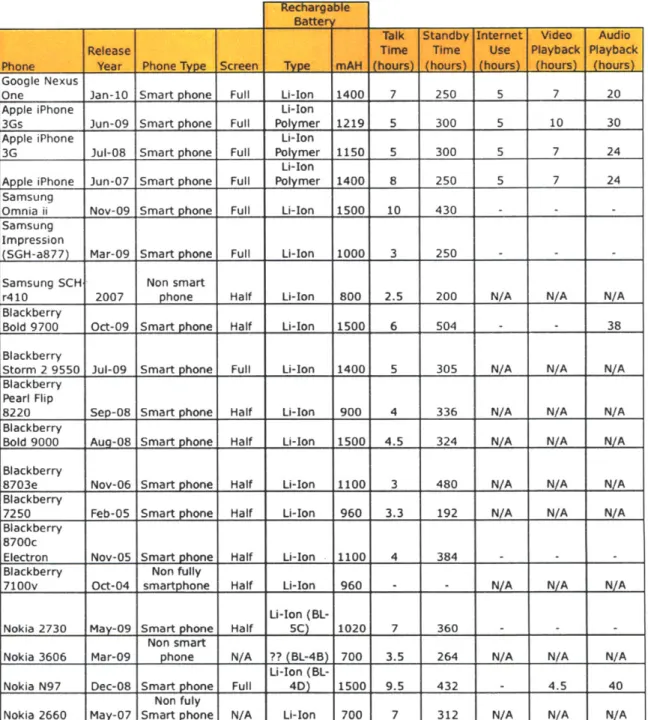
In the Apple iPhone's 3G technical specifications (Apple) the system uses a rechargeable lithium ion battery and has talk time of five hours and internet use time of five hours in 3G mode. All these results were collected from evaluations that were conducted in a controlled environment (Apple) where certain features were disabled and tests were conducted solely for the purpose of certain parameters. Additionally, in the footnote of the website, Apple disclosed that the performance may vary and is dependent on various other factors. In the Google Nexus One's technical specifications (Google) the system uses a 1400 mAH battery and has talk time of seven hours and internet use of five hours in 3G mode.
Table 1 and Figure 1 illustrate that higher energy charge lithium ion batteries are being used for newer devices and that there is a progressive increase in lithium ion energy charge with respect to the multi-functionality of the devices; increasing functionality such as larger screens require higher energy charge lithium ion battery.
Table 1 Mobile Phone Specifications
Uoogle Nexus
One Jan-10 ISmartophone Full Li-Ion 1400 250
Apple iPhone Li-Ion
3Gs Jun-09 Smart phone Full Polymer 1219 5 300 5 10 30
Apple iPhone Li-Ion
3G Jul-08 Smart phone Full Polymer 1150 5 300 5 7 24
Li-Ion
Apple iPhone Jun-07 Smart phone Full Polymer 1400 8 250 5 7 24
Samsung
Omnia ii Nov-09 Smart phone Full Li-Ion 1500 10 430 - -
-Samsung Impression
(SGH-a877) Mar-09 Smart phone Full Li-Ion 1000 3 250 - -
-Samsung SCH Non smart
r410 2007 phone Half Li-Ion 800 2.5 200 N/A N/A N/A
Blackberry
Bold 9700 Oct-09 Smart phone Half Li-Ion 1500 6 504 - - 38
Blackberry
Storm 2 9550 Jul-09 Smart phone Full Li-Ion 1400 5 305 N/A N/A N/A Blackberry
Pearl Flip
8220 Sep-08 Smart phone Half Li-Ion 900 4 336 N/A N/A N/A
Blackberry
Bold 9000 Aug-08 Smart phone Half Li-Ion 1500 4.5 324 N/A N/A N/A
Blackberry
8703e Nov-06 Smart phone Half Li-Ion 1100 3 480 N/A N/A N/A
Blackberry
7250 Feb-05 Smart phone Half Li-Ion 960 3.3 192 N/A N/A N/A
Blackberry 8700c
Electron Nov-05 Smart phone Half Li-Ion 1100 4 384 - -
-Blackberry Non fully
7100v Oct-04 smartphone Half Li-Ion 960 - - N N/A N/A
U-Ion
(BL-Nokia 2730 May-09 Smart phone Half 5C) 1020 7 360 - -
-Non smart
Nokia 3606 Mar-09 phone N/A ?? (BL-4B) 700 3.5 264 N/A N/A N/A
Li-Ion
(BL-Nokia N97 Dec-08 Smart phone Full 4D) 1500 9.5 432 - 4.5 40
Non fuly
5. Mobile Phone Power Consumption
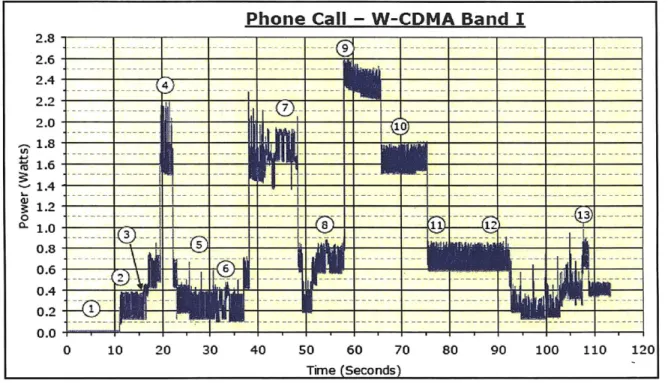
Simulation of mobile phone power consumption during operation has shown power consumption to fluctuate depending on state of operation. According to simulations
by Portalligent (Portalligent) on a Samsung SPH-W7900 smartphone, power
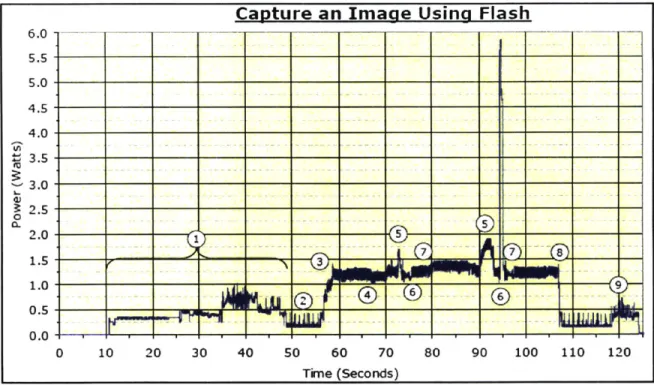
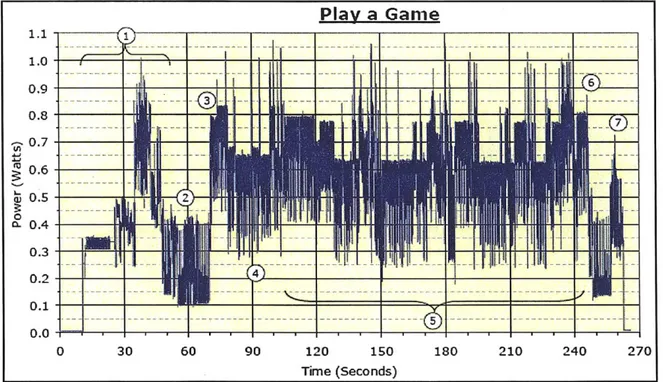
fluctuated between 0.2 watts and 2.6 watts during a phone call, power peaked close to 6.0 watts during a camera flash operation, and multiple power peaks were
observed throughout gaming mode. Simulations are shown in Figure 5 to Figure 7.
-~ ---4
- 0 _
Phone Call - W-CDMA Band I 2.8 2.6 2.4 2.2 2.0 1.8 1.6 1.4 1.2 1.0 0.8 0.6 0.4 0.2 0.0 0 10 20 30
-I'~Q-AI+-~d-[F~
-+
h~i
~1~ 80 90 ;0 60 7 Time (Seconds)Figure 5 Power Consumption Simulation for a Phone Call (Source: Portalligent)
In Figure 5, during a phone call simulation power fluctuations were observed and fluctuated from 0.2 watts to 2.6 watts depending on the operation and function during the phone call.
zz~
m
--I I Bud u.Ed1 Iee
... .. ... --- ... ... -100 110 120
1
6.0 5.5 5.0 4.5 4.0 3.5 3.0 2.5 2.0 1.5 1.0 0.5 0.0 20 30 40 60 70 Time (Seconds) 80 90 100 110 120
Figure 6 Power Simulation When Flash is Used (Source: Portalligent)
In Figure 6, during an image capture process with the flash turned on power peaked at 6.0 watts, whereas during the regular camera operation power hovered around
1.0 watts to 1.5 watts.
CaDture an Image Usina Flash
-5
-1
_- _
-9
Play a Game 1.0 0.9 6 0.8 0.7 0.6 ci0.5 S0.4 0.3 0.2 0.1 0.0 0 30 60 90 120 150 180 210 240 270 Time (Seconds)
Figure 7 Power Simulations While Playing a Game (Source: Portalligent)
In Figure 7, when the phone is in gaming mode significant fluctuations were observed throughout the phone operation. The need for power density is significantly higher compared to other operations.
Throughout a phone operation the entire phone system is supported by a single battery system, which is usually a lithium ion battery. Lithium ion is mostly known for its energy capacity per unit volume and weight (energy density and specific energy) rather than its power density. Energy density is characterized as the amount of energy stored. The higher the energy density the more energy is stored for the same amount of mass. Power density, on the other hand, is the rate of energy discharge. The higher the rate of discharge the faster energy can be transmitted. Hence, high power density is more suitable to address power fluctuations whereas higher energy density is more suitable to address stable power consumption.
6. Energy Storage Technology Comparisons
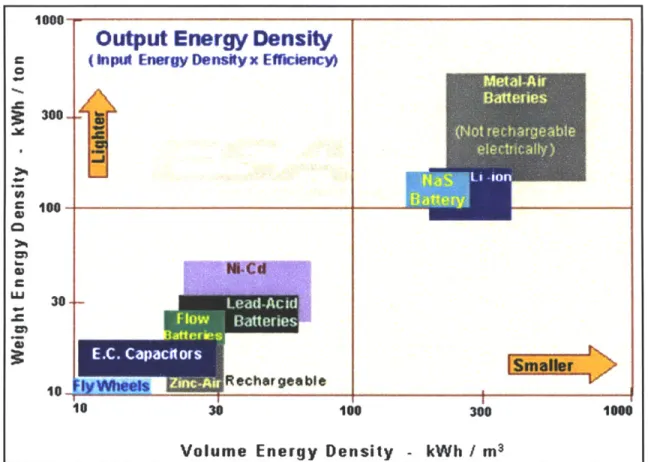
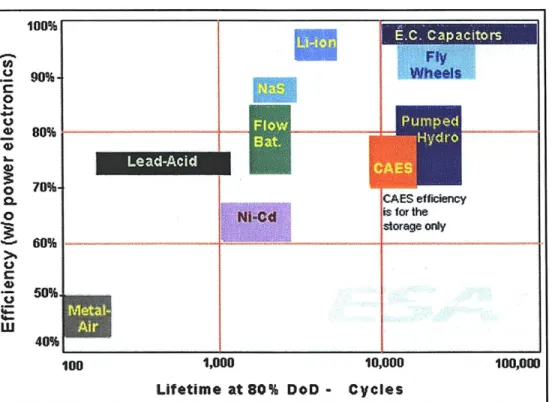
Figure 8 through Figure 11 are from the Electricity Storage Association (Electricity Storage Association) and show the different energy storage systems with respect to different performances. Lithium ion batteries have significant advantages in its small form factor, light weight and long life efficiency, but its disadvantages are in its low power density, high discharge time and higher cost relative to other storage
devices.
1000
Output Energy Density
(npu Energy Densty x Effciency)Metal-A if Batteries 300 -.x(Not tecargea I e elerically)I S
-301
techargeable
I
10-
Ul
108 100 300 I00Volume Energy Density - kWh / m3
Figure 8 Relative Comparison of Volume and Weight Storage Devices (Source: ESA)
Figure 8 compares energy storage capability versus weight and energy density. Lithium ion has a significant form factor advantage to meet energy density requirements. 100% .90% s Frgeoly 0 o 40% Lifeime0t 8%_Do_-_Ccle CAE 0 7%
Figure 9 Energy Storage Efficiency (Source: ESA)
Figure 9 compares the energy efficiency between different storage capabilities. Lithium ion and ultracapacitors have some of the highest efficiencies. This is critical in assessing the overall speed to discharge.
28
System Ratings
installed systems as of November 2008
100
E
w
CAES Compressed air
EDLC Db~aye capadtrs
001FW Flyw
0.01UA Leod-d
Uaon uthiumaan
Na-S sodiumulfur
NFCd Nkkel-cadmkum
0.001 NiMM Nkkel meta hydrkde
PH Pumped hyr
o. zn-e zinc-brOne
0.0001
0.001 0.01 0.1 1 10 100 1000 10,000
Rated Power (MW)
Figure 10 Energy Storage Comparison Between Discharge Time Versus Power Rating (Source: ESA)
As shown in Figure 10, ultracapacitors have an extremely fast discharge rate compared to other solutions for a comparable power discharge. Power rating solutions greater than an ultracapacitor is not necessary for consumer electronic applications. Furthermore, these solutions would not meet the form factor required for the consumer electronic industry.
Figure 11 Capital Cost Comparison Between Energy Storage Devices (Source: ESA)
In Figure 11 the ESA shows that battery costs have been adjusted to exclude the cost of power conversion electronics, and the cost per unit of energy has been divided by the storage efficiency to obtain the cost per output (useful) energy. Unfortunately, total cost of ownership is not included in the charts despite it being a critical parameter, and much more meaningful for economic analysis. For example, while the capital cost of lead acid batteries is relatively low, they may not necessary be the least expensive option for energy management (load leveling) due to their relatively short life. A holistic system engineering approach is required to select a sustainable system that fulfills the need to meet the increasing functionality of smartphones, which require a battery system that handles both power fluctuations and stable energy output.
Based on Figure 11 from ESA, the storage technologies that have a high power density are flywheels, capacitors and nickel-cadmium batteries. These three storage
30 1. High Power SE.C. Capacitors * W~sLong Duration C 0 U* .. Daior 65 5 Rechargeable
O
Better for UPS & Power Quality ApplicationsU 100 300 1,000 3,000 10,000
options will be used later to assess suitable applications to address power fluctuations in smartphones.
Aside from commercially available storage solutions, there are technology
breakthroughs with carbon nanotube ultracapacitors, micro fuel cells, and advanced batteries that have to be considered, but are still in the development stage.
Concurrently, there are also continuous developments to improve existing storage solutions, such as Massachusetts Institute of Technology's Ceder Research Group (The Independent) that are looking into genetically engineered viruses to build fast charge lithium ion batteries, MIT's Prof. Horn's (Chandler) work on increasing electrode efficiencies in fuel cells by changing the surface morphology of the electrode and using methanol instead of hydrogen, and California based ZPower's work (Frost & Sullivan) on nanoparticle-enhanced electrodes which display twice the energy density of current lithium ion batteries.
According to Epcos (Epcos), several orders of magnitude of difference in energy density can be observed between commercial batteries and capacitors. Capacitor technology is improving over time and recently a new breakthrough from the Massachusetts Institute of Technology using carbon nanotubes in an ultracapacitor has exhibited energy density close to par with commercial batteries. Figure 12 from Epcos illustrates this performance comparison, and Figure 13 is the modified version of Figure 12 with the inclusion of the carbon nanotube ultracapacitor.
los
1001
10 0.1 a1
1 1 0.016s 0.110
100 1000 10000 100000 WAFigure 12 Specific Energy and Specific Power Density Comparison Between Different Energy Storage Devices (Source: EPCOS)
According to the MIT Laboratory for Electromagnetic and Electronic Systems, there is excitement growing around the NEU technology with its marked improvement in both energy density and in power density. The energy density is still lower than lithium ion, but the improvement is still significant. This comparison is shown in Table 3.
Table 3 Capacitor Performance Comparison (Source: MIT)
MIT NEU
Double Layer Li-Ion Battery Expected
Capacitor (typical) (typical)
Performance
Energy density (Wh/kg) 5.44 140 30-80
to lo 100 low XM0 V44
IOO~k 0 ol
Figure 13 Carbon Nanotube Ultracapacitor Mapped Into Figure 12
Focus on battery system improvements has only increased recently. For example, according to Hoh and Magee (Hoh and Magee) dramatic improvements to capacitor technology with respect to energy density have shown capacitors to be slowly emerging as a competitive threat to the traditional chemical systems. Furthermore, the rate of technology improvement does not provide any indication that capacitors are approaching its technological limit.
33
f
I
@ e . Watt-hours per Kg 102 -101 -100 10-1 -10-2 -10 -U U U U Chemical * Lead Acid -NiCd V NiMH A LI-ion x Li-Polymer Electrical a Capacitor Mechanical * Flywhed
o
Trend 1880 1900 1920 1940 1960 1980 2000 2020 YearFigure 14 Energy Storage Density Improvements (Source: Hoh and Magee)
1900 1960 2000 Year 1.sxlO 102 5.OXlO, 0 i nM
7. System Engineering Approach to Optimize Battery Systems
The Pugh method of Controlled Convergence (Hale) was used to define the possible options for the battery and charging system. This intent of using this method is to discover the advantages and disadvantages of each option with respect to a datum, which was assigned to the lithium ion battery, and to assess if there is a combination of options for the next round of selection. The second round of selection will involve ranking the characteristics in terms of its importance in order to provide a
sustainable energy storage solution with the potential to meet current power and energy consumption demands.
The characteristics of a battery system for smartphones are the following:
- Energy density
* Power density
- Life efficiency: reliability
e Form factor: fit into a phone
* Charge and discharge rate
- Safety
* Recharge duration
e Availability: technology readiness for deployment
* Consumer behavior change: assesses if the options are transparent to the consumer and if it is visible to them
The possible options for energy storage are the following:
- Lithium Ion (Panasonic)
e Flywheels
* Electrochemical double layer capacitor * Nickel-Cadmium
e Nickel-Metal Hydride e Metal-Air batteries
* Microfuel cells
* Carbon Nanotube Ultracapacitor
* Ceder's new Lithium Ion or any equivalent Li-Ion improvement
Several candidates for energy storage were immediately eliminated due to reasons such as infeasibility to fit in the form factor and size required to be in a mobile phone and presence of hazardous materials that would not pass increasingly stringent safety and environmental regulations.
Table 3 shows the clear distinction in the progress of capacitors where
improvements are seen in power density, but still an order of magnitude lower in energy density. Two paths were considered in terms of increasing the likely options for the Pugh's method of convergence (Hale) One was through a combination of
strength in energy density and power density, and the other was through using a standalone energy density device. The former would be a strong combination and would serve the consumption of the smartphone, and the latter would require a
significant leap in energy density and would align with the current practice of
system designers where higher energy density batteries are deployed to manage the higher consumption of smartphones, as illustrated in Figure 1 and
Table 1.
Table 4 is the for the Pugh method where the different available options were rated relative to the datum of the lithium ion battery. Several cells were highlighted within the table to illustrate the advantages within the critical characteristics, these
highlights are critical for the iteration of the Pugh method.
Table 4 Pugh Matrix Selection of Energy Storage Solutions
Uthiurn ELC NI-MH NEU Micro Fuel Nano Enhanced
Characteristics Ion Cells U-Ion
Energy density - - - + +
Power density + 0 + 0 0
Life efficiency + - + + +
Form factor + 0 + + +
Charge / discharge rate D + + -+
Number of deep charge / a +
discharge cycles t + + + U Safety m + 0 + 0 Availability 0 - --Environmental Impact + 0 - + 0 Consumer Behavior 0 0 0 0 Change Replacement parts - 0 - - 0 Distribution Market 0 0 0 - 0 Sum (+)7 1 5 5 5 Sum (-)2 3 5 6 1 Sum(0) 3 8 2 1 6
Pugh's concept of controlled convergence involves convergence and divergence where, after each selection and scoring, the options available were narrowed and the strengths are combined to discover possible additional alternatives. The divergence path expands to include additional alternatives and the iteration of convergence and divergence continues. The Pugh iteration was stopped after the .....
first iteration to account for possible near-term strategies and possible long-term strategies for adoption.
For mobile phones, the key characteristics are energy density, power density, form factor, number of deep charge/discharge cycles, expected customer behavior
changes, availability, and distribution market. In the next round of selection, weights were assigned to key characteristics and individualized scores were normalized.
The ratings were grouped into 3 segments: greater than or equal to 0.2, between 0.1 and 0.2, and less than or equal to 0.1. The ratings were heavily weighted towards energy density, power density and consumer behavior change. This group was primarily focused on meeting and exceeding battery characteristics and the effects of the change to the consumer. The second group consisted of form factor, number of deep discharge and charge, and distribution market. The focus here was on deployment and the secondary factors for battery characteristics. Finally,
technology availability was assigned to the last group, since deployment is broken into near-term deployment and long-term deployment.
Table 5 tabulates the result of the divergent, and the near term strategy of
combining commercially available lithium ion batteries and capacitors should be further explored. For the long-term, as technology breakthroughs in lithium ion become commercially available, combinations with capacitors or pure standalone lithium ion batteries could be the interim long-term solution. According to Frost and Sullivan(Frost & Sullivan), the current lithium ion technology is only expected to see incremental improvements of 1% to 2% a year in power density, and energy density improvement is tapering off, hence a significant technology shift is required for lithium ion to undergo a leap in energy density. Nano enhanced electrodes in lithium ions are currently showing that promise to shift the technological trajectory.
In Table 5, one observation to note is that, despite scoring high, the combination of a lithium ion battery with a carbon nanotube ultracapacitor was excluded from the near term strategy. The reason for the exclusion is the unavailability of commercial ready carbon nanotube ultracapacitors for the electronic industry. Based on
commercially available readiness, it would be best suited for carbon nanotube ultracapacitor to be introduced with an improved lithium ion battery system instead of an available lithium ion system.
Hence for the near term, lithium ion batteries with an electrochemical double layer ultracapacitor will be a significant improvement compared to the current plain lithium ion battery. This combination will provide the power density to handle the
multi-functional applications that are found in smartphones today. For a long-term strategy, the combination of an improved lithium ion battery with an ultracapacitor or carbon nanotube ultracapacitor, or even just an improved lithium ion standalone battery should be explored as possible options. The best technology may not win the
race due to factors such as market timing, technology capability versus future needs, industry player strategy in going for higher value market segments, and etc. This is definitely a future area of focus.
Micro Fuel Nano Nano Nano Li + EDLC Li + NEU Cells Micro Fuel Micro Fuel Enhanced U- Enhanced Li- Enhanced
U-Standalone Cells + EDLC Cells + NEU Ion Ion + EDLC Ion + NEU
Characteristics Standalone
Weight Rating Score Rating Score Rating Score Rating Score Rating Score Rating Score Rating Score Rating Score Energy density 0.25 3 0.75 3 0.75 5 1.25 5 1.25 5 1.25 4 1 4 1 4 1 Power density 0.2 4 0.8 5 1 3 0.6 4 0.8 5 1 3 0.6 4 0.8 4 0.8 Form factor 0.1 4 0.4 4 0.4 4 0.4 4 0.4 4 0.4 4 0.4 4 0.4 4 0.4 Number of deep charge / discharge 4 0.4 4 0.4 4 0.4 4 0.4 4 0.4 4 cycles 0.1 0.4 4 0.4 4 0.4 4 0.2 1 0.05 2 0.1 2 0.1 1 0.05 2 Availability 0.05 0.1 1 0.05 1 0.05 Consumer Behavior 4 0.8 4 0.8 1 0.2 1 0.2 1 0.2 4 Change 0.2 0.8 4 0.8 4 0.8 Distribution Market 0.1 4 0.4 2 0.2 2 0.2 2 0.2 2 0.2 2 0.2 2 0.2 2 0.2 3.75 3.6 3.15 3.35 3.5 3.5 3.65 3.65 Total Score Rank 1 5 6 7 8 4 2 3 Continue (Y/N)? Y N N N N Y Y Y
Near-Term or Long- NT N/A N/A N/A N/A LT _ LT
Term I II II ILT LT _ LT
8. Battery Charging Systems and Options
There is recent hype in the consumer electronics industry over displays of wireless power technologies showcased in the annual January Consumer Electronics Show in Las Vegas since 2007. This capability can be viewed as the last milestone into a truly mobile experience. Gadgets such as the Energizer accessory for recharging a Wii game controller, the Dell Latitude Z business laptop that can be recharged when placed on a stand, the Powermat mat charger, and Bosch power tools that can be recharged by placing them on a workshelf are some of the products that have been recently introduced into the market.
Wireless power transfer technology only became more significant due to the
increased focus on mobility and increased functionality of electronic gadgets. This is evident in the competition's beachhead target, which is primarily mobile devices such as smartphones, although there have been some recent breakthroughs in power tools, laptops and kitchen appliances. Furthermore, in Portalligent's
simulations, smartphone devices undergo various power and energy consumption cycles throughout its operation, and as a result the battery system installed needs to be recharged frequently since the system is not designed to meet those needs.
The combination of mobility and increased product functionality creates a perfect storm. Increased mobility requires a more flexible recharging method and an increasingly flexible recharging method reduces the ownership of power adaptors. The current norm is to use a power adaptor to recharge the battery system; power adaptors are already standard items in every electronic kit.
Following the technology adoption lifecycle proposed by Everett M. Rogers
(Rogers), currently wireless power technology can be considered to be at the early adopter stage. There are many questions surrounding this new technology: is wireless power only a convenience, what is the industry standardization strategy, what is the marketing strategy to cross the chasm, what are the health implications, is this the permanent replacement for batteries, and what is the incumbents'
strategy to address this attack?
From some initial data, Duracell's myGrid mat product is marketed as a convenience and an elimination of the cord. In contrast, Powermat suggested in their owner's manual that their power pad is more energy efficient since it "eliminates the power that is wasted when each adapter is left plugged into the wall." As such there is no industry standard perception of wireless power.
8.1
Wireless Power Technology Overview
The two methods of wireless power technology being considered are near field energy transfer and far field energy transfer.
8.1.1 Near Field Energy Transfer
The near field energy transfer method refers to the transmission of energy wirelessly at close-range and mid-range distances. Close-range distances are
comparable or smaller than the size of the device, while mid-range distances can be equal or even few times the size of the device. Magnetic induction and magnetic resonant induction are two methods of near-field energy transfer. In magnetic induction, two coils are involved and when current is passed through the first coil, a magnetic field is generated. When the second coil is within proximity of the
electromagnetic induction is the low efficiency of the transmitted energy when the distance between the two coils increases, so transmitted energy is wasted.
Magnetic resonant induction is capable of transferring energy at greater distances than magnetic induction. The physical difference between electromagnetic resonant induction and electromagnetic induction is the self-resonant coil used in the former. When two self-resonant coils are placed within transmission proximity and
resonate at the same frequency, they achieve a higher efficiency due to less wasted transmitted energy. Hence, magnetic resonant induction has greater transmission distances. The amount of energy transfer here is also a function of the distance between the two coils. According to Kurs (Science Magazine), in systems of coupled resonances, there is often a general strongly coupled regime of operation. If one can operate in that regime in a given system, the energy transfer is expected to be very efficient.
Figure 15 Electromagnetic Resonance Wireless Power Transfer Efficiency (Source: Kurs)
8.1.2 Far Field Energy Transfer
Far field energy transfer refers to wireless energy transfer at distances much larger than the size of the device, possibly up to kilometers in range. The technology enabling such transfer over long distances is mostly based on electromagnetic
radiation. The energy is sent in the form of microwaves or radio waves from the transmitter to a special type of detector called a rectenna, a rectifying antenna, which enables the conversion of microwave energy into direct current. This transfer
method will not be covered in this paper.
44
...8.2 Wireless Power Technology Parameters
According to WiPower (WiPower), the parameters for wireless power technology are:
- Efficiency: Effective power received by device
e Range: Distance between power source and device e Power: Charge capability
- Size
e Freedom of movement
- Cost
A technology envelope characterizes the technology limits where the technology can
operate. Normally, within this envelope trade-offs between parameters occur. As illustrated in Figure 15, a trade-off between power transfer efficiency and distance is observed where efficiency decreases as a function of distance. This observation is found in all wireless power transfer methods. WiPower also accounted for the current competing technologies by distance in Figure 16.
Figure 16 Wireless Power Transfer Methods by Distance (WiPower)
In Figure 16 and Figure 17 power cords have the highest power density, followed by induction and cordless induction. Losses from transfers through cords and from device efficiencies are not considered here.
Figure 17 Power Density Comparison (WiPower)
8.3 Recharging Methods
A survey of players in the wireless power industry was conducted. A corded power
strip was included into the comparison to establish the current technology baseline.
The existing practice requires consumers to attach their mobile phones to an
interface or adaptor which is connected to a cord that is plugged into a wall outlet or a power strip.
From the survey of wireless power players, both magnetic induction power transfer and magnetic resonance induction power transfer use a transmitter and a receiver, and the difference lies in distance of contact allowance between the transmitter and
47
Stindard for Softy Lavels with Rspect to Hwnnn bposinutI ueimo- Rqsmpncy Elecromnewtic Feds, 3tkt to 30061H
E 1000
4>
[614Vmr
ELECTRICz 3 7A1\,-1642,/f ICONTROLLED ENVIRONMENT)
60a0 10
zz
W W 614 V/mE
MAGNETIC
CO~~n TRENGTH DFELD 14/
10 m6A5m2 00 1.3/ POWER NSITY i f/300 WI-OW zu 0 W ~f Is INMUz00 /
the receiver. In both systems, the transmitter is attached through a power cord to a wall outlet or a power strip, and the receiver is a separate attachment that is
attached to the mobile phone. In magnetic induction, the receiver and the
transmitter have to be in direct contact, whereas for resonant magnetic induction there is a distance of separation allowed before transfer efficiency reduces
significantly; no physical contact is needed.
There are also two approaches in the industry to bring these products to market. The first approach is to sell the transmitter and the receiver directly to the end users. The other approach is to partner with an original equipment manufacturer (OEM) and to incorporate the products into their product lines. The first approach has full design flexibility where these are only considered as add-ons. The second approach reduces the overall design flexibility and usability flexibility. For example, a hotel desk incorporated with a transmitter will not be of use to someone who does not have a phone that has the receiver. In both cases, power adaptors will certainly continue to be supplied. Mobile phone companies will certainly not limit phone usability with a battery system that is not considered to be their core technology.
8.4 Recharging Logistics
New technology introduction usually introduces changes to consumer behavior. A comparison between expected consumer behavior changes was assessed for wireless power, and the current method of using a power strip cord or wall outlet was included as a baseline.
Table 6 shows the comparison between the different recharging methods and its overall impact to consumer behavior.
Table 6 Recharging Logistics Comparison
According to John Gourville (Gourville) the rate of market adoption or customer acceptance is based on behavioral changes and perceived product benefits. When mapping the different technologies to the current practice the magnetic induction method would be equivalent to using a power strip since the pad is constantly attached to the power outlet just like a power strip, there is no consumer behavior change since all a consumer is required to do is place the electronic gadget onto the pad similar to placing the electronic gadget in an adaptor that is attached to the power strip.
On the other hand, in resonant magnetic induction where contact is not required, the consumer behavior change is a positive change and will drive for positive
adoption. The benefits here are high since adaptors are eliminated and receivers can be integrated into the product similar to wifi, hence the additional step of having to
49
Change to Consumer
Method Cord 1insmitter Receiver Distane Coumer Action Behavior
Corded power strip Adaptors supplied by Direct Attach phone to
Current Practice Y attached to wall outlet manufacturers connection adaptor Neutral Attach phone to
Adaptors supplied by Direct adaptor; attach to wall Current Practice Y Wall outlet manufacturers connection outlet Neutral
Electromagnetic Corded pads attached Specific receiver Direct "Attach" phone with
Induction Y to power strip matched to corded pad connection receiver to pad Minimal Change Electromagnetic Corded pads attached Specific receiver Direct "Attach" phone with
Induction Y to wall outlet matched to corded pad connection receiver to pad Minimal Change Resonant
Electromagnetic Corded transmitter Specific receiver Indirect Close proximity to
Induction Y attached to power strip matched to transmitter connection transmitter Positive Resonant
Electromagnetic Corded transmitter Specific receiver Indirect Close proximity to
physically connect or attach the device onto another interface is eliminated. Proximity is the only requirement.
For magnetic induction consumers would have almost no customer behavior
change, but will have to pay a hefty amount for the pads. The current going rate for a pad is approximately a hundred dollars, and each receiver is approximately thirty dollars. That is a handsome amount to pay considering that you can get a power strip for less than ten dollars.
Resonant magnetic induction, on the other hand, provides positive behavior change where one is not limited by distance by having to be in contact with the receiver to charge or to have a power supply. The cost factor for resonant magnetic induction is unavailable since there are no commercially available products to recharge a phone in the market.
8.5 Integration of Split Battery System with Recharging
There are two fronts that will clash in the future. On one front, there is the battery system -which is improving, albeit at a rate that is unacceptable unless there is a disruption, such as an ultracapacitor, that can spur both technologies to improve. On the other front, there is the battle between the different wireless power transfer
technologies.
The rate of wireless power transfer adoption can be influenced by the rate of technological advancement in the battery system. The slower the technology
other factors that influence the adoption rate of wireless power transfer such as the effect of industry standardization, cost, consumer behavior changes, and etc.
The current offering of magnetic induction, although useful, has limited advantages compared to the current incumbent, which is the power cord. Power cord suppliers themselves should look into miniaturization to counter the concerns of
encroachment by the magnetic induction players.
The integration of any battery system, hybrid or standalone, stand to gain
significantly with resonant magnetic induction technology. Despite the consumer behavior change expected, it is a positive change and would be well received by early majorities. I view this change similarly to the advancement in wifi technology where consumers did not have to look for an outlet to attach their cable connection and had a greater sense of appreciation of mobility. In the later discussion, resonant magnetic induction will be coupled with the battery system and its management and transition strategies explored.
9. Future Power Management Systems
9.1 Split Battery System
The proposal here is to split the power and energy management between two devices; one device focusing on energy and the other device focusing on power. To enable such as split, at minimum a sensor and a fast switch is required. Further research and development is required to develop a new battery management system.
The role of the sensor would be to detect the surging need for power consumption, and to provide instructions to switch from battery to ultracapacitor, and vice versa. The sensor will be connected to a power management device, this link is required since the power management device will provide instructions to the switch to turn on and turn off. The power management device is connected to the processor, which is the brains behind the smartphone and provides instructions for the power
management device.
There will be various sensors in the module; each sensor will be used to detect the different factors that are required for algorithm optimization. Factors that should be considered are, the rate of change of power consumption, the sensor connected to the processor to detect changes such as a flash operation in a camera, and etc.
Software will have a part to play in the new module since the right amount of power burst needs to be provided. Depending on the operation that is being run, the
various sensors will collect data and feed into a software program that will calculate the appropriate amount of power burst.
Figure 18 Split Management Architecture Proposal
Figure 18 illustrates the proposed architecture for the split management system. This is a modified version of Figure 4. The split management system includes a
sensor, a switch, an ultracapacitor, and software algorithm. These new additions themselves can be a module or individual components, and parts can then be surface mounted onto the smartphone's printed circuit board. The new module can also be integrated with the current battery to create an integrated module. There is an additional option where the new components are individually surface mounted onto the printed circuit board, but that would be the option that has the most significant negative impact to the smartphone manufacturer due to the additional complexity in supply chain and in operations.
The box defined by the solid line can be managed by the ultracapacitor supplier and be sold as its own module. Furthermore, the module can be integrated with the battery system, which is enclosed in the dashed line. In either case, there is a potential for growth opportunities for either strategy since ultracapacitor companies can become more value added within the smartphone value chain. Battery manufacturers themselves can also be value added by providing a single solution point and providing breakthrough technology that is almost transparent in change to the smartphone manufacturers, hence reducing the overall complexity.
The concept of a split system is already deployed in the automotive industry. Maxwell Technologies (Smith), one of the industries' top ultracapacitor suppliers, has a split system with an ultracapacitor performing the duties of meeting peak power demand and as a secondary power source.
ENERGY STORAGE/
OC
POWER DELIVERY
COMPONENTS -- EEYCAT
CHARGINGAS
I
*~ NEEDED-i..em
PRIMARY ENERGYSOURCE
(Batteries, Engine, Fue.1 Cell)
II-~
CONTiNOUS LOW POWER ENERGY TO
lb
CONTINUOUS LOW POWER ENERGY TO
MEETAVERAGE POWER REQUIREMENTS
Figure 19 illustrates Maxwell's concept. The primary energy source continues to use the sources that have high energy density capability. The current application is only focused on a large-scale system, while our intent is to look at small-scale
applications.
9.2 Recharging Integration
The earlier discussion pointed out that resonant magnetic induction is the wireless power technology that is best suited, and that has value add, within the system.
Figure 18 provides an additional module to the new system architecture. This module has direct interaction with integrated circuits such as the application processor, power management, and battery. Constant charging of the battery is detrimental as all battery systems have an operation recharging life. Hence a software feature that sets a threshold or an on/off setting feature can be included into the overall system.
A preset threshold can be set to instruct the system to look for wireless recharging
when the power level is reduced to a certain preset level. Predetermining the level using free information such as battery level is useful to prevent the smartphone from performing a non-value added task by constant recharging the phone. A constant recharge module is less attractive for total lifecycle cost due to shorter life and faster replacement cycles.
An on/off feature is another option, where the constant recharging and instructions or communication between the application processor and the new module can be eliminated. The on/off feature is similar in concept to the act of looking for a power
outlet minus the physical action of looking for power outlets and hence improving mobility.
Industry level standardization is required to set the frequency band where wireless power can be deployed. The race for standardization is crucial at the onset of the technology, as companies need to ensure that they can transmit at an agreed
frequency, test human safety considerations, and test for potential interactions with the other allocated frequency bands not just within the United States but globally.
Once a global frequency band is allocated questions will quickly arise over what the development and deployment strategy will be. As evidenced in Kurs' work
transmission efficiency is a function of distance from transmitter. Development of the transmitter system should take place on two parallel paths. One path as
individual boxes that can also function as signal boosters. The other path is to integrate it into stationary boxes such as cable routers, televisions, ceiling lights and ceiling fans.
Individual boxes can be plugged into an ideally suited power outlet. The user will have the flexibility to relocate the power source to the location needed. For
travelers, an adaptor will be required to attach to the power outlet, but this is not an additional item since an adaptor should be carried anyway to recharge computers, shavers and etc.
Integration of the transmitter system into stationary appliances and furniture will spur market adoption aggressively. These devices are currently already connected to a power outlet, which will provide a constant flow of wireless power signals. Furthermore, the incorporation of this capability is a value creation and value added
feature to internet router companies, television companies and the lighting industry as this technology provides an added dimension to their product offering.
9.3 Hardware and Software Improvements
Integrated circuit chips continue to improve their low power offering due to the many concerns highlighted in this paper. The transition to better semiconductor processing technologies contributes to less charge lost through operation.
Screen displays themselves are evolving. There is a transition now from liquid crystal to active-matrix organic light emitting diodes (AMOLED) which require lower power and have better display resolutions.
Software itself is playing a major role in smartphone processing algorithms. Mobility requires minimal idle time between execution and instructions. Hence, optimization in software is crucial to ensure that hardware such as application processors are not running extensively creating zero useful work and running down the battery source.
9.4 Battle From All Fronts
This chapter highlights the overall effort from a system perspective to improve the system battery performance. As hardware and software improvements, which are the focus areas of smart phone manufacturers, continue to progress, battery system and recharging technology play a significant role in enabling consumers to benefit and enjoy the full range of applications on the smartphone while fulfilling their mobility needs.
9.5 Performance Gap Bridging
I expect that there will always be a gap between performance to meet customer
needs and performance that any system can provide. Figure 20 below depicts the expected gap.
Time
Figure 20 Charge Density Gaps Between Consumer Needs and the Different Methods to Improve the Current Performance
Current improvements with low power devices and better software optimization can improve the overall system performance, but it is not expected to match
consumer performance needs. This gap can be attributed to various factors such as system inefficiency losses-no system can be 100 percent efficient-and modularity in design creating numerous additional interfaces and additional protocols required to execute a command.
Smartphone' Performance
A hybrid system with both ultracapacitor and battery can significantly improve the
overall system performance, but it is not expected to meet the consumers' needs
100 percent. The reason for this is attributed to the low rate of improvements to the
current system and the fact that the ultracapacitor only addresses peak loads. This duality option is complementary of each other and not a substitution for each other. As a result, as more functionality is added to the smartphone, there is always a significant performance gap expected.
Ultimately the closest to bridging the gap is to provide a situation where a
smartphone is constantly powered up, similarly to being corded, but without losing the mobility factor. The concept of incorporating a resonance magnetic induction or the like, where mobility can still be honored to some degree, will provide a situation where the smartphone can constantly be powered on when in close proximity to a
transmitter. The idea is similar to running the smartphone on a wifi connection where a transmitter at proximity is transmitting the signal needed to transmit and receive data. Figure 20 still shows a gap between the charging provided and
consumer needs, since the constant charging of a battery system is detrimental as it shortens the life of the overall system. Hence, the concept of having an option to either set a threshold battery charge level or an on/off switch to detect available wireless recharging fulfills the goal of provide complete mobility and yet run the
system at full performance.
10. Modular Architecture and Scalability
Modularity is already an ingrained concept in the mobile phone architecture. Devices from various suppliers are designed separately and produced based on an agreed set of design rules. Modularity should continue to be followed when
incorporating split power management technology.
Based on the current business process the new device or new system can either come from a new player who will integrate various components and sell the module to the phone manufacturer, or from an existing battery manufacturer who can
create value and capture value by internalizing the split function and selling an integrated component.
From a system architecture perspective, incorporation of additional functionality increases system complexity. In this case, a new set of design rules have to be developed to define the process window of the new device or the new function, and this new set of design rules will have to be agreed upon by the various stakeholders across the interface. For example, the sensor's sensitivity, speed of feedback and instructions, detection frequency, and maximum amount of power have to be considered between the different parties such as the sensor supplier, module integrator, ultracapacitor supplier, logic supplier, phone manufacturer etc. A new player in the ecosystem will increase the need for external coordination, whereas an existing player in the ecosystem will provide additional offerings without the