Ate Distributed Energy Technologies
a
Viable Alternative for Institutional Settings?
Lessons fromMIT
Cogeneration PlantKaren
de 10s AngelesTapia-Ahumada
Civil Industrial Engineering, Pontificia Universidad Cat6lica de Chile (1998) Master of Science, Pontificia Universidad Catblica de Chile (1998)
Submitted to the Engineering Systems Division in Partial Fulfjllrnent of the Requirements for the Degree of
Master of Science in Technology and Policy
at the
Massachusetts Institute of Technology
September 2005
O 2005 Massachusetts Institute of Technology.
All rights reserved.
1
LIBRARIES
'
1
Signature of Author..
...
/. ......
... ---Technology and Pohcy Programy Engineering Systems Division
f 3
August 5hy 2005w Certified by
Ernest
J.
Moniz, PhDco-Director Laboratory for Energy and the Environment
A
A Thesis SupervisorAccepted by
...
-.Y : Z S ...
...
J
Dava J. Newman, PhD
Professor of ~eronala'cs and Astronautics and Engineering Systems
Ate Distributed Energy Technologies a Viable Alternative for Institutional Settings?
Lessons from MIT cogeneration Plant
Karen de 10s AngelesTapia-Ahumada
Submitted to the Enpeering Systems Division
on August
5",
2005 in Partial Fulhllment of the Requirements forthe Degree of Master of Science in Technology and Policy
During the last decades, distdbuted energy (DE) resources received considerable attention and
support because of the confluence of technology development
-
particularly gas turbines - andderegulation
-
which would allow access to the distribution systems. D E was seen as addressingnumerous issues, including transmission constraints, reliability, power quality, energy efficien cy,
and envkonmental quality through combined heat and power (CHP) applications. Numerous barriers, such as stranded asset requirements and lack of uniform interconnection standards, were recognized but viewed as manageable. Nevertheless, the penetration of DE/CHP has been
considerably less than anticipated by many. More recent developments in the D E technology,
regulatory environment, and fuel prices call for a re-examination of the cost-benefit balance for D E owners and of the societal implications that underpin public policy.
This study addresses the MIT Cogeneration Plant in that context, motivated by the fact MIT was an early mover in adopting CHP technology in institutional settings. After a decade addressing numerous obstacles, the plant was put into operation about a decade ago with the expectations of reducing energy costs, improving the quality of power, and reducing net atmospheric emissions. This study reviews the major drivers for deciding on-campus power generation, and analyzes the project retrospectively in the context of today's market and regulatory conditions. Alternative scenarios are also evaluated in terms of technology improvements, standby rates, and
fuel
prices with the further goal of understanding their impact on the viability of DE/CHP projects.Our baseline results lead us to conclude that MIT Cogeneration Plant is a better alternative than generating the steam and purchasing the electricity needs separately. The present value of the
economic savings are about $43m for the period 2006 to 2020, while the environmental benefits
in terms of CO2 emissions represent in average about 65,000 metric tons/yr. These numbers represent about 10Yo cost savings and 22% C02 reduction under the set of assumptions and projections in the base case.
Then, we performed four sensitivity analyses to understand the impact of technology efficiency, electricity rate structure, market
fuel
cost uncertainties and a carbon tax on the viability of DE/CHP projects:-
Better turbine electrical efficiency represents more economic and C02 emission benefitsfor the cogeneration alternative, with economic savings increasing up to about $73m and C 0 2 benefits up to 93 metric tons/yr.
-
If the utility's new rate structure were applicable to the MIT cogeneration facility, it wouldhave additional economic benefits of about $4.6m.
-
The project can be particularly sensitive to market conditions, especially natural gas prices.If fuel price conditions are not favorable, the cogeneration alternative becomes uneconomic with incremental costs of almost $56m.
-
Finally, the economic recognition of the C02 reductions can change the economics of acogeneration project.
A
DE/ CHP project may drsplace emissions from less efficienttechnology and fossil fuel sources
-
depending on the utility's energy portfolio. Forexample, a $100/tonne carbon-tax brings addrtional economic savings of about $16m for
the Cambridge utility fuel mix (about two thirds fossil). However, this particular
cogeneration project would have addrtional costs of $2m if the Cambridge utility used entirely "carbon-freey' sources.
In summary, this study illustrates that CHP systems provide real economic and environmental benefits, through better efficiency, reutilization of exhaust gases, and displacement of polluting technologies. However, changes in current operational, market and regulatory conditions may greatly affect the benefits and viability of D E projects, requiring institutions to perform an in- depth analysis to weigh the pros and cons of specific projects.
Thesis Supervisor: Ernest J. Moniz, PhD
Title: Cecil and Ida Green Professor of Physics and Engineering Systems
A ti An' por
hramor e incondicional apoyo.
A nuestm bebito M a t i a s p ser
kr
lzq
dc
nuestras n'das.
To Arifoyour iove and unconditional szppoct
I would like to extend my most sincere thanks to Professor Ernest Moniz, co-Director Laboratory for Energy and the Environment, for his continuous support towards the completion of this project. In these years of tight work he created the conditions for a enjoyable learning environment, where he introduced me to the value of energy resources and their societal and environmental consequences. More importantly, with his frequent input, he offered me his valuable remarks and constructive critiques for continuously improving the outcomes of this work.
My infinite appreciation to Professor Dave Marks, co-Director Laboratory for Energy and the
Environment, who always supported me since starting the TPP. Without his advice and
encouragement I would not have been able to work in this project at the LFEE.
As well, I would like to express my gratitude to the people of the Central Utilities Plant at MIT
who kindly shared theit knowledge with me. E s p e d y , I am thankful to Mr. Roger Moore,
Superintendent of Utilities, who spent countless hours sharing with me his understanding about
the operations of the plant. He provided me with
all
the necessary resources, and he contactedme with the people who could further contribute with the project. His dedication and diligence
were crucial in helping me to complete this work.
I need to mention as well the support of Peter Cooper, Anne Whealan, and Seth Kinderman
who conferred me their valuable time and provided me with all the relevant plant's operational
and financial data. Thanks also to Luzette Alvarado-Ortiz who always promptly assisted me in all
my needs. Her good spirit made my work even more rewarding.
Finally, these two years at the TPP have been extraordinary. I have grown through the
knowledge, but most importantly though the people who has enriched this whole journey at
MIT. Friends, classmates, professors and assistants
all
have contributed to make this experience...
ACKNOWLEDGMENTS -7...
TABLE OF CONTENTS - 9 INDEX OF FIGURES...
11...
INDEX OF DIAGRAMS 12...
INDEX OF TABLES 13...
ACRONYMS
ANDABBREVIATIONS
15...
1.
INTRODUCTION
19...
1.1. PROBLEM DEFINITION 19...
1.2. MOTIVATION 25...
1.3. THESIS OUTLINE...
.
.
.
.
-252
.
CASE STUDY: MIT COGENERATION PLANT PROJECT...
27...
2.1.
BACKGROUND -27...
2.1.1. Challenges to the development of the project 2 9...
2.2. TECHNICAL CHARACTERISTICS OF THE PROJECT 1...
2.2.1. Technical features 3 1 2.2.2. Plant's operating mode...
3 5 2.3. ANALYSIS OF CASE STUDY UNDER CURRENT CONDITIONS...
40...
...
2.3.1. Common assumptions to both cases.
.
-412.3.2. Utility case: All electricity bought from NSTAR and steam generated by the CUP
...
442.3.3. Cogeneration case: Steam and most electricity generated by the CUP
...
49...
2.4. ANALYSIS OF RESULTS 56 3.
COM~INED HEAT AND POWER...
593.1. CHP APPLICATIONS AND BENEFITS
...
59...
3.2. CHP TECHNOL~GIES 61...
3.3. TECHNICAL BARRIERS -62 3.4. ANALYSIS OF CASE STUDY WITH EFFICIENCY IMPROVEMENTS...
63...
4.
REGULATORY AND MARKET ENVIRONMENTS 67 4.1. REGULATORY FRAMEWORK...
67...
4.2. MARKET CONDITIONS -68 4.3. REGULATORY AND MARKET BARRIERS...
.
.
..
.
.
.
...
694.4. ANALYSIS OF CASE STUDY WITH NEW REGULATORY AND MARKET CONDITIONS
...
744.4.1. Analysis considering standby service charges
...
744.4.2. Analysis considering fuel prices
...
7 7 4.4.3. Analysis considering carbon tax...
815
.
CONCLUSIONS...
83 5.1. SUMMARY OF RESULTS...
83 5.2. FURTHER RESEARCH...
.
.
.
...
-86...
5.3. FINAL REMARKS -87...
REFERENCES 9 1...
APPENDIX A: HISTORICAL ELECTRICITY DATA AND FUEL FUTURES 95
APPENDIX B: UTILITY CASE-ELECTRICITY BOUGHT FROM NSTAR/STEAM GENERATED BY CUP
...
101APPENDIX C: NEW ENGLAND NET GENERATION BY ENERGY SOURCE. 2004
...
105...
APPENDIX D : COGENERATION CASE . STEAM AND MOST ELECTRICITY GENERATED BY CUP 107
APPENDIX E: COMPARISON COGENERATION AND UTILITY CASES ... 113
APPENDIX F: DESCRIPTION O F PRIME MOVER TECHNOLOGIES ... 115
...
F
.
1 . INTERNAL COMBUSTION ENGINE 115...
F.2. COMBUSTION TURBINES 1 1 7
F
.
3.
FUEL CELLS...
1 2 0...
APPENDIX G:
REGULATORY
FRAMEWORK 123G
.
1.
PUBLIC UTILITIES REGULATORY POLICY ACT ... 123G.2. DE REGULATIONS
...
1 2 4G
.
3.
UTILITY RATES ... 1 2 7...
G.4. ENVIRONMENTAL REGULATIONS 1 3 0
...
.
FIGURE 1.1 : TOTAL GENERATION. 1990 2003
...
20 FIGURE 1.2. COMMERCIAL AND INDUSTRIAL CHI? GENERATION. 1990 . 2003...
21.
FIGURE 1.3. TOTAL INSTALLED CAPACITY. 1990 2003
...
22.
...
FIGURE 1.4. COMMERCIAL AND INDUSTRIAL CHP INSTALLED CAPACITY. 1990 2003 22
.
...
FIGURE 1.5. U.S. NATURAL GAS WELLHEAD PRICES. 1990 2005 23
FIGURE 1.6. NEW YORK HARBOR N0.2 FUEL OIL SPOT PRICES, 1990 . 2005
...
24.
...
FIGURE 2.1. MITYs ENERGY LOADS, 2000 2005 36
...
FIGURE 2.2. MIT ENERGY LOADS, 2004 37
...
FIGURE 2.3. CUP STEAM PRODUCTION, 2004 38
.
FIGURE 2.4. CUP FUEL CONSUMPTION, 2000 2004
...
38FIGURE 2.5. CUP FUEL CONSUMPTION, 2004
...
39DIAGRAM 2 . 1 : GENERAL VIEW O F COGENERATION PLANT AND SUPPLEMENTARY BOILERS ... 31
DIAGRAM 2.2. COMBUSTION GAS TURBINE
...
32...
DIAGRAM 2.3. HEAT RECOVERY STEAM GENERATOR 33...
DIAGRAM 2.4. MAIN ELECTRICAL SYSTEM 34...
DIAGRAM 3.1 : CHP BASIC OPERATION 59...
DIAGRAM A.
1 : ELECTRICITY FLOW, 2003 95DIAGRAM
F.
1 : OTTO CYCLE...
115DIAGRAM F.2. OPERATION GAS TURBINE
...
118DIAGRAM F.3. COMBINED-CYCLE COMBUSTION GAS TURBINE ... 119
DIAGRAM F.4. FUEL CELL BASIC OPERATION ... 121
TABLE 1.1. EFFICIENCY OF GENERATING TECHNOLOGIES
...
20...
TABLE
2.1 : AIR EMISSIONS PERMIT LIMITS 34 ....
TABLE 2.2. MIT's LOAD. 2001 2004 35 . TABLE 2.3. CGT OPERATION. 2000 2004...
36...
TABLE 2.4. BOILERS TECHNICAL FEATURES 37...
. TABLE 2.5. PLANT EFFICIENCIES, 2002 2004 39 TABLE 2.6. ELECTRICITY AND STEAM LOADS, 2005...
41TABLE 2.7. LOAD GROWTH, 2005 - 2020
...
...
...
41TABLE 2.8. ENERGY COST RATE, 2005 - 2020
...
42...
TABLE 2.9. DEFAULT SERVICE PRICE FOR INDUSTRIAL CUSTOMERS, 2005 43...
TABLE
2.10. ENERGY COST ESCALATORS, 2005 - 2020 43...
TABLE
2.1 1 : BOILERS EFFICIENCY 44...
TABLE
2.12. G-3 RATE AND ESCALATORS 45TABLE
2.13. NON-FUEL OPERATIONAL AND MAINTENANCE COSTS ... 45TABLE
2.1 4: FINANCING PARAMETERS...
46TABLE 2.1 5: SUMMARY OF RESULTS FOR COSTS, 2006 - 2020
...
46TABLE
2.16. UNCONTROLLED CO2 EMISSION FACTORS...
47TABLE 2.17. NSTAR ENERGY SOURCES
...
47TABLE 2.18. U.S. EFFICIENCY FOR TYPE OF POWER GENERATION ... 47
TABLE 2.19. SUMMARY OF RESULTS FOR C02 EMISSIONS ... 48
TABLE 2.20. CGT PARAMETERS
...
49TABLE 2.21 : CGT AND HRSG PARAMETERS ... 52
TABLE 2.22. ESTIMATED EFFICIENCIES
...
53TABLE 2.23. ~ I N T E N A N C E AND STANDBY RATES FOR MIT (CLOSED RATE)
...
54...
TABLE 2.24. PV ELECTRICITY COSTS 54 TABLE 2.25. PV FUEL PURCHASE COSTS...
.
.
...
54TABLE 2.26. NON-FUEL OPERATIONAL AND MAINTENANCE COSTS
...
55TABLE 2.27. SUMMARY OF RESULTS FOR COSTS ... 55
TABLE 2.28. SUMMARY OF RESULTS FOR C 0 2 EMISSIONS
...
55TABLE 2.29. PV OF OPERATIONAL SAVINGS, 2006 - 2020
...
56TABLE 2.30. FINANCING PARAMETERS FOR COGENERATION PROJECT ... 56
TABLE 2.31 : SUMMARY OF RESULTS FOR COSTS ... 57
TABLE 2.32. SUMMARY OF RESULTS FOR CUMULATIVE C02 EMISSIONS, 2006 - 2020
...
58TABLE 3.1 : COMMERCIAL CHP TECHNOLOGIES COMPARISON
...
62TABLE 3.2. TECHNICAL PARAMETERS FOR COMBUSTION GAS TURBINES
...
64TABLE 3.3. NPV SAVINGS AND C 0 2 EMISSION BENEFITS, 2006 - 2020
...
65TABLE 4.1 : CUP AVERAGE FUEL COSTS, 2002 - 2004
...
68TABLE 4.2. NPV SAVINGS WITHOUT SB CHARGES, 2006 - 2020
...
75TABLE 4.3: SUPPLEMENTAL, MAINTENANCE & STANDBY RATES FOR MIT PLANT AND NEW FACILITIES ... 76
TABLE 4.4. NPV SAVINGS WITHOUT SB CHARGES, 2006 - 2020
...
76... .
TABLE 4.6. NPV SAVINGS WITH NEW FUEL PRICES. 2006 2020 78
...
.TABLE 4.7. NPV SAVINGS A COGENERATION. 2006 2020 79
.
...
TABLE 4.8. NPV SAVINGS
A
HIGH NG PRICE. 2006 2020 79.
TABLE 4.9. NPV SAVINGS
A
HIGH NG & OIL PRICES. 2006 2020...
80TABLE 4.10: CUMULATIVE CO;! EMISSIONS UNDER DIFFERENT ENERGY PORTFOLIO. 2006 . 202081 .
...
TABLE 4.1 1 : NPV CO2 SAVINGS WITH A $ ~ O ~ / T O N N E CARBON TAX. 2006 2020 81 ....
TABLE
4.12. NPV C 0 2 COSTS IN A CARBON-FREE REGION, 2006 2020 82...
.
. TABLE 5.1 : NPV SAVINGS UTILITY CASE VS COGENERATION CASE, 2006 2020 83 TABLE 5.2: CUMULATIVE C O 2 EMISSIONS UTILITY CASE VS.
COGENERATION CASE, 2006 . 2020.84 TABLE 5.3: NPV SAVINGS AND C 0 2 EMISSIONS UNDER DIFFERENT EFFICIENCY SCENARIOS, 2006 . 2020...
84TABLE 5.4. NPV SAVINGS WITHOUT SB CHARGES. 2006 . 2020
...
85TABLE 5.5. NPV SAVINGS UNDER DIFFERENT FUEL PRICES SCENARIO. 2006 . 2020 ... 85
TABLE A
.
1 : NET GENERATION (GWHIYEAR). 1990 . 2003...
96TABLE A.2. SUMMER INSTALLED CAPACITY
YEAR).
1990 . 2003...
97TABLE A . ~ B : SUMMER INSTALLED CAPACITY ELECTRIC GENERATORS P I Y E A R ) . 1990 . 2003.98 TABLE C . 1 : NE GENERATION BY ENERGY SOURCES ... 105
ACRONYMS
AND
ABBREVIATIONS
AAQS AC BACT CCGT CELCo CGT CHP COco2
COMGas CO CPI CT CTC CUP CZM DC D E DEP D G DTE EFSB EIA EIR ENF EOEA EOP EPA FERC FO LHVAmbient fbr Quahty Standards Alternating Current
Best Available Control Technology
Combined Cycle Gas Generation Technology Cambridge Electric Light Company
Combus tion Gas Turbine Combined Heat and Power Carbon Monoxide
Carbon Dioxide Commonwealth Gas Carbon Monoxide Consumer Price Index Combus tion Turbine Customer Transition Cost Central Uthties Plant Coastal Zone Management Direct Current
Distributed Energy
Department of Environmental Protection Distributed Generation
Massachusetts Department of Telecommunications and Energy Energy Fachties Siting Board
Energy Information Administration Environmental Impact Report Environmental Notification Form
Executive Office of Environmental Affairs Emission of Offset Policy
U.S. Environmental Protection Agency Federal Energy Regulatory Commission Fuel Oil
HHV HRSG IC ICR ISO-NE LAER LPG MA MAAQS MEPA MCFC MEPA MTC 7 NAAQS NAICS NEPOOL NG NO2 NOx NPC NPV NSPS NSR 0 3 O&M OPEC OSGF PAFC Pm PSD PURPA PV QF
High Heat Value
Heat Recovery Steam Generator Internal Combus tion Engme Induect Cost Recovery
New England Independent System Operator Lowest Achevable Emissions Reduction Liquefied Petroleum Gas
Massachusetts
Massachusetts Ambient h Qual~ty Standards Massachusetts Environmental Policy Act unit Molten Carbonate Fuel Cells
Massachusetts Environmental Policy Act Massachusetts Technology Collaborative Efficiency
National Ambient h r Quahty Standards North American Industry Classification System New England Power Pool
Natural Gas Nitrogen Dioxide Nitrogen Oxides
National Petroleum Council Net Present Value
New Source Performance Standards New Source Review
Ozone
Operation and Maintenance
Organization of the Petroleum Exporting Countries On-Site Generating Faclltty
Phosphoric Acid Electrolyte Fuel Cells Particulate Matter
Prevention of Significant Deterioration Public U&ty Regulatory Policies Act Present Value
RTP SCR SI SILs SO2 SOFC TOU v o c s Real-Time Pricing
Selective Catalytic Reduction Spark Ignition Engine Sipficant Impact Levels Sulfur Dioxide
Solid Oxide Fuel Cells Time Of Use
1.1. PROBLEM
DEFINITIONDistributed energy (DE) is generally referred to as energy generation and storage systems placed at or near the energy consumer's site. However, since continuous debate exists about the capacity size and the type of technology to be included in the definition, we wdl take the term as defined in Chapter 164 of the General Laws of Massachusetts (G.L.c.164, $1):
"Distributed generation is the generation fachty or renewable energy fachty connected lrectly to drstribution fachties or to retail customer fachties whch alleviate or avoid transmission or lstribution constraints or the installation of new transmission fachties or lstribution fachties". Reciprocating internal combustion engnes, combustion turbines and microturbines are among the technologes widely accepted as quali@ing for drstributed generation. Other technologes are fuel cells, and renewable technologes such as photovoltaic systems and wind turbines. D E can be fueled from a broad variety of sources, from coal, oil and natural gas, to solar and other renewable resources.
The major drivers for the deployment of grid-connected DE resources have been the potential
to provide benefits on both sides of the uthty meter', such as:
-
Increase of the net energy efficiency.-
Lower energy costs.-
Improvement of system reliabhty.-
Environmental benefits.-
Improvement of power quality.-
Lower energy losses in transmission lines.-
Reduction of transmission congestion.-
Reduction of large capital investments in the lstribution and transmission systems.Accorlng to the Energy Information Adrmnistration's 2003 Annual Energy Review, in the
United States almost 70°/o of all energy used to generate electricity coming from fuels is lost as waste heat (from the conversion of heat into mechanical energy), and as line losses from the transmission and lstribution of electricity across the gnd (see Diagram A.1 from A p p e n l x A). Therefore, there is a great potential for efficiency improvements that could be acheved using D E resources when configured as Combined Heat and Power (CHP) applications.
CHP is a system that "efficiently generates electricity and takes advantage of the heat to produce steam, hot water, and /or c M e d water" (Aspen, 2000, pp. 2). The heat, that normally would be wasted in the conversion process, is captured and used for thermal applications.
United States, Department of Energy, Distributed Energy Program, Energy Efficiency and Renewable Energy, Mdjor Potential BeneJits ofDE ~ttp://www.eere.energy.gov/de/majorpotentid~benefits.html)
The simultaneous production of electricity and use of thermal energy improves considerably the
total net efficiency of the facility. As shown in Table 1.1, the efficiency of large generating
technologies is generally less than 50%. However, when addmg CHP to the current technology
to capture the wasted heat, the efficiency increases to over 65% (Casten, 1998,
pp.
66) (GRI andNREL, 2003).
Table 1.k Efliciency of generating technologies Technology
Coal- fired power plant
Internal combus tion engine
Steam turbine
Gas turbine in simple cycle
Gas turbine in combined cycle
Microturbine
Fuel cells
Regardless of the multiple benefits mentioned above, according to the EIA's 2003 Annual
Review the proportion of electricity generated by CHP applications in the commercial2 and
industrial3 sectors measured over the total net generation has been decreasing over the past
years. In 1990 it accounted for 4.5%, and in 2003 it represented 4.17% of the total generation
(see Figure 1.1 and Appendm A).
I l l
I 1
1990 1991 1992 1993 1994 1995 1996 1997 1998 l9BQ 2000 2001 2002 2003
Total Commercial & Industrial CHP Electric Generators, Electric Utilities, CHP & IPP
Sourer. m yMarrPtbn Admhblratbn - Onice of Coal. Irlrclear. Wtric and Alternate Fuak. U.S. m n tof k x g y
Beclric Fbwer Annual 2003". Decentmr 2004
Without heat recovery
36-38% 30-37% 5-1 5% 22-37% 55% 23-26% 30-46%
Figure 1.1: Total generation, 1990 - 2003
With heat recovery 78% 69-78% 80% 65-72% 85-90% 61-67% 65-72% 2
Commercial sector includes institutional sector, comprising private and government services such as college and universities, district energy, government, hospitals, offices, airports, and health/sport centers.
3
Industrial sector includes agriculture, forestry, fishmg, and hunting; mining, including oil and gas extraction; construction; manufacturing, natural gas distribution; and water supply and irrigation systems.
During 2003, the power generated by CHP facilities in commercial/institutional settings was 7,496 GWh representing only 0.62% of the total electricity used in that sector of 1,199,718GWh4 Since 1990, the additional generation in the commercial/institutional area has been m i d , with a decrease starting in 2000 (see green line in Figure 1.2 and Table A.l from Appendm A). In 2003, the level of capacity for CHP comrnercial/institutional settings was similar to that back in
1994, accounting for only 2,100MW (less than 0.25% of the total installed capacity in the nation). If we take into consideration CHP industrial applications, the proportion over the total capacity
was 3.14% during 2003, one of the lowest since 1990 (see Figure 1.3, Figure 1.4, and Table A.2 from Appendix A).
Commercial and Industrial CHP generation, 1990
-
2003T o t a l Comrnmial8 Industrial CHP -CHP. Carnercial PM -CHP, Industrial Pawer
Soura: B w g y hfofmtii Adnhi,tdbn - fffica d Coal. Nuclear, Becbic and Alternate Fuels, U.S. Departnwl d Energy
"6ectfic Ftw er Annual 2003", Decenhr 2004
Figure 1.2: Commercial
and
industrial CHP generation, 1990- 2003
4
The total electricity in commercial/institutional sector was calculated taken the total sales to ultimate commercial customers during 2003.
Instatlad Capacity, Com & Ind CHP v. Electric generators, 1890
-
20031990 1991 19Q2 1993 1994 1995 1996 1997 1998 1999 2000 2001 2002 2003
dal Commercial 8 Industrial CHP rn Electric Generators, Electnc Utilities. CHP 8 IPP
Figure 1.3: Total installed capacity, 1990
- 2003
ww pr Commercial and industrial CHP installed capacity, 1990
-
2003 35,000 ----.-r--.-.--r.-.--.-Tr777-. - r-.--r-.--T-.---r--T----7--- I I I I I I I I I I I I I I I I I . - r - - --
I I I I I I I I I 7 I I I I I I I I I I 20,000 -- - 1 - - - 1 - - L - - 1 - - - 1 - - - 1 I - - - A - - - L I - - - A - - - L _ _ _ I I I I I I I I I I I I I 1 1 1 1 1 1 1 1 1 1 1 l I I I l I I l 1 1 1 1 75,000 - - - I - - - T,
-.-,-
r - - -- - - , - -
T - - - 1 1 1 1 1 1 1 1 1 1 1 1 I I I I I I I I I I I I jo,000 - - - I - - 1 - 1 .- - I I- - - L - - - I - . -1 - - L - . - 1 - - - J . - - L _ - - I I I I I I I I I I I I I I I I I I I I I I I I I I I I I I I I I I I I 5,000 -- - 1 - - - - - - I - -,
- -,
- --,
- - - I - --,
- - - - I I I I I I I I I I I I I I 1 I I I I 1 I I I 1 I I I I I 1 I I 1 I I 1990 1991 1992 1993 1994 1995 1996 1997 1998 1999 2000 2001 2002 2003-Total Commercial 8 Industrial CHP C H P , Commercial Power -CHP, industrial Power
So-: Energy infomation Administration
-
Omce of Coal, Nuclear, Electric and Alternate Fuels, U.S. Department of Energy "Electric Power Annual 2003". December 2004Figure 1.4: Commercial and industrial CHP installed capacity, 1990
-
2003As we observed from the above information, CHP in the commercial/institutional sector has decreased its market share. The current deployment levels are extremely low, despite the apparent benefits that thls technology is able to provide. An explanation can be found in the hurdles to CHP applications created by various technology, regulatory framework and market condtions. In addition, owners and operators may stay away from the challenge of operating a moderately complex physical plant.
On the technology side, the adoption of CHP technologies will depend on the availabhty and suitability of the technology to the customer's electrical and thermal needs. While the current state in combustion turbines makes them an attractive choice for large commercial applications, reciprocating engines may become more appealing for smaller facilities with efficiency levels that will depend on the size of the application. On the other hand, cleaner technologies have
prohibitive installed costs making them only available for niche applications.
On the market side, CHP technologies use a wide range of fuels and the decision of adopting the application will be affected by the variations in the price of fuels and electricity. Particularly for
natural gas and oil fuels, current prices are high. The spot price for tlatural gas at Henry Hub is
$7.31 50/MMBtu5 when a year ago it was $5.8950/MMBtu. a nominal increment of 24%. For the New York Harbor No. 2 fuel oil the spot price is $1.4078/gal compared to that from last year of $0.9367/gal, an increase of 50%.
Looking at the historical wellhead natural gas6 and oil prices, an increasing trend since 2002 is clear, with current levels being one of the highest of the past years. Moreover, over a fifteen year
period, a period of interest for planning, building and operating a DE facility, natural gas prices
fl ~ 0 d 3 1 i f i t i : & - ,
<
' r k . 3 *,;*-!$tiL? have about tripled (see Figure 1.5 and Figure 1.6).- -
T . -
I
'I U.S. Natural gas wellhead prices, 1990-2005,
WMW] I I ? t : "- - .
1 I I I f l l l l I
1 - 1 r r r 1 I I I I
Sww: U.S. N a W Oar Prices. Wellhead Data S i w k , Energy lnbmaUon +q
h ~ Y b n l ~ . d a . d o e . g o u ' d n a ~ ~ g ~ p d ~ 8 u m d n u s m . h l m
,. . I
,
. , , i : ' 0-t 4. . . . . . Figure 1.5: U.S. natural gas wellhead prices, 1990
-
2005
: ; 8 !!,.,. , . . . ; ' , I I ! !Prices as of Xprill3th 2005. Source: Wall Street Journal (WSJ), Markets &fa and nsoums: Spot Prices
-
OilStatistics @(http: / /online.wsj.com/documents/mktindex.htm?oilstat.htm)
It is important to mention that there are some differences between Wellhead and Henry hub prices: i) Wellhead prices represent real-time transactions, ii) Henry hub prices represent contracted natural gas sales delivered i t the ~ i n r y Gas processing plant in Louisiana which include some processing and transportation
.
in' . U t , t l * ' I ' -: costs.Wall NY No2 fuel oil spot price, 1990-2005 I I I I I I I I I I I I I - -
,
- 1 - - 1 - - I I I I I l l I- - 4 -I I l l m 7 - 7 3 7m 76 7k 7m 7m 7 7 7 7 7 7kc.: U.S. Heating Oil Spot Prices
-
Historical Data. Energy Inbrmation Mministration, Department of EnergyhltpJEmnm.eia.doe.go~oil-gas~trole~m/info~glance/distillate.hI
J
Figure 1.6: New
York Harbor No.2
fuel oil spot prices, 1990-
2005As indicated by NYMEX's natural gas and fuel futures contracts7, the prices will reach a peak during the first quarter of 2006 with $8.32/MMBtu and $1.58/gal respectively, after which the future prices for both fuels are expected to decrease (see Figure A.l and A.2 from Appendix A for the future trends).
Therefore, if the primary hels used today by CHP applications are natural gas and oil, high prices will have a major impact on the operational costs of the facilities. P o t e n d CHP users will need seriously to evaluate adopting such technology versus purchasing electricity for meeting their energy demands, moreover when about 80% of the U.S. electricitps comes from coal, nuclear, and hydro which are energy sources relatively unaffected by fuel cost volatility (EIA,
2004).
On the regulatory side, the adoption of CHP applications will depend on the opportunities that
regulations create for future developers. Currently, some regulations are constraining a greater
deployment of DE resources. As we mentioned above,
the
growth of installed capacity at thecommercial/institutional levels has been small over the past decade. The growth of CHP installed capacity has been mostly from independent power producers during the first half of the last decade and the last few years (compare "CHP Commercial Power" and "CHP Industrial
Power" in Table A.2 with "CHP Electric Generators" in Table A.2b from Appendix A).
'
NYMEX's natural gas and No. 2 fuel oil futures - 4/14/05 session.Broadly speaking, present regulation was initially conceived in addressing the barriers that the traditional vertical production model presented for new independent power producers. Although the 1978 Public Utility Regulatory Policies Act (PURPA) motivated the introduction of cogenerators in the wholesale electricity market, it seems that it was not enough for encouraging a greater D E market. When developing a project, small and mid-sized D E developers need to consider a series of critical issues such as stranded costs and standby rates payable to the electrical utility, interconnection standards to the existing distributions sys terns, and environmental requirements.
Having in mind the issues initially introduced in this chapter, the main motivation for this study is to respond to the question,
'Given
thc
tvid&ncogni~edbenefits ofDE nsources,
wby bar tbe akplyment ofsub nsources in tbe comm~cialand institutional sectors not- over tbe partyears?"
Often advocates for D E resources rely on simple models that take into account only efficiency considerations to conclude that CHP is valuable to the public good. However, it is crucial to look at a more complex analysis where institutions need to weigh the pros and cons of the potential project versus continuing as a utility customer. The need for an in-depth case study appraisal is essential for determining the total value of the project.
Along these lines, we took MITs Cogeneration Plant as our case study. We were stimulated by the fact that MIT was a pioneer among institutions in building a facility of these characteristics,
and also by the challenges it had to face to finally operate the plant. We will take a deep look into
the operational mode of the facility, and we will understand how technical, market and
regulatory barriers shape the project. Moreover, we will conduct an analysis on how the
attenuation of those barriers will impact a new project with similar characteristics in the
Cambridge area, and we will analyze the viability of such projects given the new conditions.
1.3.
THESIS
OUTLINEIn Chapter 2 we will review the MIT cogeneration project. The analysis will focus on the
historical economical and technical reasons that the Institute took into consideration when deciding to start the project, and the barriers that MIT had to overcome especially with the utility
distribution company regarding the settlement on stranded costs. Sections 2.3 and 2.4 will
contain the central analyses and core results of this study. The quantitative analysis will be based
on the evaluation of the plant's future operational costs, together with an evaluation of a hypothetical reference scenario where all MITs electricity needs are satisfied by the utility
company servicing the Cambridge area. Operational savings and carbon emission benefits will be
analyzed for determining if under current conditions the plant is still an attractive alternative for MIT and, by extension, other institutions.
In Chapter 3 we will study in more detail the Combined Heat and Power technologies.
Specifically we will focus on the applications and potential benefits, the technical barriers of the
existing technology, and the main features of new emerging technologies and their contributions
to CHP applications. Additionally, in section 3.4 we will carry out a quantitative analysis of the
impact of new technologies, looking at the monetary savings and environmental benefits due to improvements in the efficiency levels.
In Chapter 4 we will review the market and regulatory barriers for a larger deployment of CHP
in the commercial and institutional sectors. We will look at the main PURPA provisions for
"qualifymg facilities", the state's regulatory framework for DE generation, as well as the
electricity rate and charges applicable to DE projects. In section 4.4, a quantitative analysis will
be based on how the rate structure affects the viability of new projects, and how the volatility of fuel prices impacts the operational costs of the projects. In the latter analysis, especially
important will be the sensitivity of the model to the natural gas prices.
Finally, in Chapter 5 we will discuss the lessons learned from MITs experience for a better
understanding of the viability of CHP in commercial and institutional sectors. We will conclude with some issues that are interesting for further analysis, and a series of observations regardng the problems this technology is facing, which are constraining a more rapid development and wider DE market deployment.
2. CASE
STUDY:
MIT
COGENERATION PLANT PROJECT
In t h s chapter we
d
review the main features of MIT's cogeneration project, starting with an overview of the history of the project and the challenges the Institute had to tackle to put the plant in operation. We wdl also study the technical characteristics of the main subsystems that comprise the whole Central UiAties Plant (CUP), as well as their most recent operational features and MIT's electrical and thermal load characteristics.Finally, we
d
make an in-depth analysis of the facility where wed
perform a cost-benefit analysis of the project in today's and future market conditions. The study will be based on two cases where the campus' electricity and steam needsd
be met in different ways. We wdl compare the results in terms of the economics of the projects, as well as the environmental benefits that each of them represents in terms of C02 emissions.In 1985, MIT started a feasibility study for installing an on-campus gas-fired cogeneration facility that would provide more cost effective electricity and heating to the buildings with a better quality of serviceg, addressing at the same time state and local environmental considerations. The continuous fluctuations and price increases in electricity and imported oil fuel prices, as well as the low natural gas prices were some of the major drivers for tahng the decision of installing a cogeneration plant.
At that time, most winter heating steam was supplied by the CUP, which also supplied the steam for the steam-driven chdlers for cooling purposes during the summer. There were five boilers with a total capacity of 400klb/h of steam that could use natural gas on an interruptible basis, and No.6 fuel oil when gas was not avadable, representing 15-30% of the annual fuel requirements. Natural gas was supplied by Commonwealth Gas (COMGas), and fuel oil was stored in underground tanks with a total capacity of about three week supply.
Cambridge Electric L g h t Company (CELCo) supplied most of the electricity to the campus through three main service points East, West and Main Campus, each with two underground 13.8KV feeders from CELCo, electrically isolated from each other. However, at that time CELCo was considering to upgrade its Cambridge distribution system to 115kV, with subsequent changes in the interconnection of MIT with CELCo (Fluor, 1986, pp. 2-1 to 2-4). MIT's considerations for choosing a gas turbine cogeneration plant werelo: i) the constant electricity growth that the Institute experienced over the precedng years and the substantial growth estimations for the future, ii) because of air quahty permits, a natural gas fired combustion turbine would have an easier permitting process than a desel generator based system. In addtion, accordng to the steam and energy load data of the base year (1984), the Occasional outages made the power supply unstable and unreliable for MIT's needs. The rate of interruptions was in average 1 +event per year.
lo Memorandum sent to Paul F. Barrett from MIT's Cogeneration Study Committee related to MIT
Institute's annual average heat to power ratio was 6.251b/kWh1l7 that from a technical point of view, indicated the simple and combined cycle gas turbine-based cogeneration system as the most suitable alternative (Fluor, 1986, pp. 3-5 and Table 3-2).
Given the characteristics of the steam and electrical loads, MIT had to decide the electrical and thermal size of the new plant assessing the tradeoffs between large systems with excess capacity versus small systems requiring the additional use of the existing boilers and the local utility's service for providing the remaining electricity needs. For the steam sizing, the decision was based on the quantity coming from the unfired steam productionl2, the supplemental-fired13 and the existing boilers14 of the CUP that would best meet MITs steam requirements.
After reviewing more than 20 cogeneration alternatives, the study narrowed down the alternatives to five cases because of the attractiveness that each case represented to MIT. Thls analysis took into consideration technical issues such as: excess of steam and power depending on the size of the turbine, flexibility of the technologies to match steam and electric demands by either varying the steam or electricity production15, supplemental firing capability, space constraints, efficiency rates, among others. Other analyzed issues were the equipment required for each of the cases for the water supply, electrical distribution and control systems (Fluor, 1986, Sections 5-6).
In Apnl and May of 1992, the project acquired the required environmental permits from the Massachusetts Department of Environmental Protection. The construction of plant started in spring 1993 and the plant began its operations in September 13fh, 1995 including the replacement of two of the five existing boilers and upgrading the other ones. Also, the plant was designed to be interconnected to CELCo and the regional gad, configured in a way that would MIT permit to sell excess energy to CELCo if it was cost effective.
The plant was expected to provide about 94% of the campus energy needs with a technology
that was designed to reduce emissions to low levels and, therefore, improve Cambridge's air
quality. Emissions of the criteria pollutants - PMx, SOs NOx, CO, VOC7s - of the new plant
compared to the emissions of the old one were estimated to be 259tons/yr versus 470tons/yr respectively.(MIT, 1992, pp. 9).
11 During 1984, the total steam consumption was 687.375 million lbs and the total electrical consumption was
11 0,370MWh.
12 Unfired steam production is steam coming from the waste heat of the gas turbine. It is used as a base load
and any excess must be condensed.
13 Supplemental-fired steam production uses fuel to increase the temperature of the gas turbine exhaust
increasing the steam production. It can be controlled to meet steam demand and the efficiency is higher than conventional boilers.
'*
Boilers are commonly used for meeting peak steam loads.15 Depending on the technology, the steam can be used for varying electricity either through injection to a gas turbine or use in a steam turbine. On the other hand, supplemental firing can be used for varying the amount of steam.
Regarding the
fuel
and electricity supply contracts, at that time MIT signed a twenty year termcontract for
hrm
gas supply with COMGas. The gas purchase contract included an escalatingcommodity charge and a hKed monthly demand charge for a maximum capacity of
5,50OMMBtu/day that will be ending in 201 6. For standby power
-
in case of maintenance andgeneration failure
-
and the supplemental power16 service - for peak demand-
the service wasagreed to be supplied by CELCo at a standard rate or contractual agreement.
The total project capitalization was $48,477265 (1996US$) including the initial investment,
contingency costs and interest during construction. The project was 100Yo financed through a 30 years taxable-bond at a 7.125% real rate of return, and a 25 years straight line depreciation rate.
2.1.1.
CHALLENGES
TO THE DEVELOPMENT OF THE PROJECTWhen the project was conceived, there were issues that challenged the feasibility of the project. Specifically, the subjects of concern were": i) adequate gas supply, ii) local utility rates for
electricity purchase, excess generation sale and stranded costs, and
iii)
regulations andenvironmental permits.
For the supply of gas MIT had to undertake extensive discussions with the local utility COMGas, and also with other suppliers to get a contract at a competitive price and suitable availability. The capacity of the local utility's distribution system was not enough for the supply of gas, since the available quantity of £irm gas was sufficient only for a small base load cogeneration plant of about 10-12MW of capacity. Therefore, the upgrade of the distribution system and a new gas supply were needed before proceeding with the installation of a larger cogeneration facility (Fluor, 1986, pp. 4-21).
Regarding the sale of electricityl8, the local utility was reluctant to provide a a t e for excess power generated by the cogeneration plant, driven in part by the regulatory changes being carried out in Massachusetts and also for the threat that the plant represented as a competitor for the supply of energy. Other main issues of concern were the plant interconnection with CELCo's distribution system, and the rates that CELCo would charge for supplemental and standby power. At the time the study was conducted, it was assumed that the G-3 rate19 would be applicable to the purchases of supplemental power. In the case of standby power, the study assumed that MIT would buy the power from the local utility at nondiscriminatory prices according to PURPA requirements. However, it was not dear what charges and terms CELCo would apply to the plant and further negotiations between the parties were required to define a reasonable standby charge (Fluor, 1986, pp. 4-9).
l6 Supplemental power refers to MIT's power purchases in excess of the cogeneration plant's rate capacity.
l7 Memorandum sent to Paul F. Barrett from MIT's Cogeneration Study Committee related to MIT
Cogeneration Feasibility Study (May 16th,1986), Cambridge, MA (USA), pp. 2.
la MIT could sell excess power on a firm basis if the plant capacity exceeded the Institute's maximum electrical
demand.
l9 Rate G-3 for large general Time-of-use, 13.8kV service is available for those customers with a demand no less than lOOkW during each billing month. The rate include a monthly demand charge, energy charges depending on the peak load period, power costs charge as defhed in the default service and other charges such as energy conservation senrice charge.
Additionally, in 1995 CELCo expressed "concerns for the impact of the project on its Cambridge base revenue stream", which could represent higher electrical prices paid by the other Cambridge rate payers P I T , 1992, pp. 2). The utility had claimed that the investments made by the company to supply MITs energy needs would be stranded once the Institute had installed the plant. The company required MIT to pay a "customer transition cost (CTC)" of $5.62/kVA/month to recover the costs that it had incurred to serve its customers, and that year the DTE required MIT to pay that charge to CELCo. The Institute started a long litigation process that included the DTE, the FERC and the Supreme Judicial Court. In March 1998, Massachusetts restructured its electricity market and the Electric Utility Restructuring Act required utilities to divest assets and hence to recover the stranded costs. In 2001, under a new regulatory environment dealing with stranded costs and exit charges, MIT reached an agreement with NSTAR20 approved by the DTE. In this settlement, NSTAR had to refund MIT for the payments it had made between 1995 and 1997.
Concerning permitting process, MIT's project required the approval of several environmental and regulatory permits related to emissions, water discharge, solid waste and land use (Fluor,
1986, section 8). At the state level, the Massachusetts Environmental Poli
y
Act (MEPA) is areview and evaluation process for new projects with environmental consequences depending of the Executive Office of Environmental Affairs. During the process, comments from agencies, commissions and the general public were received. Once the process was complete, MIT received a certificate of compliance with MEPA in 1992 and the Institute was able to start the construction of the cogeneration plant.
Air
permit was one of the critical ones for the development of the project. There were at leastfive major regulations the project had to comply with:
-
New Source Performance Standards (NSPS). Enforceable at state level, it establishes theemission limits applicable to stationary gas turbines for NOX and SO2.
-
New Source Review (NSR). New or modfied sources must obtain approval from theMassachusetts Department of Environmental Protection (DEP)21 subject to meeting air
quality standards, emissions limitations and any additional requirement.
-
Ambient Air Quality Standards (AAQS). The major concern for the project was theMassachusetts' one-hour NO2 standard applicable to sources of potential NO2 emissions exceedmg 250ton/yr
-
Prevention of Significant Deterioration (PSD)-
Emission of Offset Policy (EOP)The whole air emissions permitting process was estimated to last between 6 and 15 months,
conditional to adding water injection into the turbine to reduce NO, emissions and post- operational tests to verifg compliance with regulations.
20 CELCo and its partner Commonwealth Energy merged with Boston Electric to form NSTAR.
Finally, in addition to the issues abovementioned, the development of the project had to take into consideration the efficiency criterion contained in the Public Utility Regulatory Policies Act of 1978 (PURPA) to be certified as a "qualifjmg cogeneration or small power production facility" (details about regulations governing
DE
resources will be provided in Chapter 4).2.2.
TECHNICAL
CHARACTERISTICS OF T H E PROJECTPrevious to analyzing the economics of the project, we need to understand the main technical22 and the most recent operational features of MIT's cogeneration facility.
2.2.1.
TECHNICAL
FEATURESThe main components of the cogeneration facility are the combustion gas turbine (CGT), the heat recovery steam generator (HRSG), the chillers system, and the electrical connection sys tems
(see Diagram 2.1).
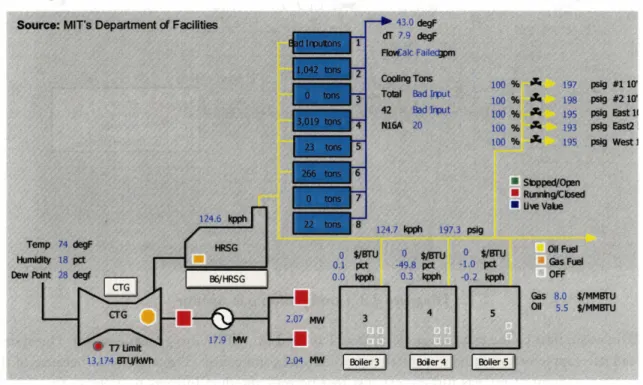
Diagram 2.1: General view of cogeneration plant and supplementary boilers
The prime mover of the plant is a simple-cycle, dual-fuel, low nitrogen oxides @Ox)
combustion turbine23
-
ABB GTlOA-
with a heat recovery system. The electrical capacity is 21MW nominal, the steam capacity is 170,00Olb/hr with a supplementary fired high pressure boiler rated at 615psi and 705OF, and the cooling capacity is 23,500tons expandable to28,000tons. The electrical heat rate is 11,400 Btu/kWh (LHV) and 12,800 Btu/kWh (HHV), the
22 Most of this information can be found on the web page of MIT's cogeneration plant
(http:/ /cogen.mit.edu/emissions.cfm)
23 Technology endorsed by the Massachusetts Department of Environmental Protection (DEP) that meets the
maximum exhaust temperature is approximately 1050' F, and the exhaust flow is approximately 628,000 lb/hr. The primary fuel of the turbine is natural gas and the secondary one is distillate (N0.2) fuel oil.
As with
all
gas turbine systems, the atmospheric air is compressed (I), the system is fueled and ignited (2), and the heated combustion gas is expanded through the gas producing and power turbines (3). Finally, the generated power is used to drive the compressor and electric generator. MITs turbine has an industrial design, so it is more suitable for base-load operation, with more operational hours and highly reliable, although less efficient than the turbines with the aeroderivate design. The gas turbine produces a high quality thermal output appropriate for CHP applications (ONSITE, 2000, pp. 71 -76).Diagram
23:
Combuzetim gmturbine
The waste heat of the exhaust gas of the CGT is used by a HRSG to generate steam. The system can use supplemental firing to provide for additional combustion. This is possible because of the oxygen content in the gas turbine exhaust that permits the duct burners to increase the exhaust gas temperature entering the HRSG, and increase the steam production relative to an unked unit (Energy Nexus, 2002). In MITs system, the supplemental firing adds 60,00Olb/hr of capacity to the existing 100,00Olb/hr capacity of the waste heat. Besides incrementing of the overall efficiency of the plant, supplemental firing increases the operating flexibility through the control of steam output.
The thermal output of the HRSG is used as steam directly for heating purposes or converted to chilled water by absorption chillers for the campus' cooling needs (see Diagram 2.3).
Diagram
2.3:
Heat recovery steam generatorFor controlling CO and NOx emissions, MITs plant uses two control methods. First, the
turbine uses water injection into the combustion zone for reducing the temperature of the flame
which also helps in reducing NOx levels. The water needs to be demineralized to avoid forming
deposits and corrosion in the turbine expansion unit. However, the water injection process
increases CO emissions since the temperature in the bumout zone decreases.
Second, the turbine has an environmental (EV) combustor that uses premixed, swirling
combustion flow to generate low NO, levels
(dry
low NOx combustor).A
mixture of natural gasand compressed air is mixed prior to entering the combustion chamber which avoids local zones
of high temperatures, or hot spots, in the combustor where NOx forms (Energy Nexus, 2002). Finally, a selective catalytic reduction (SCR) control method is used for carbon monoxide (CO) control in the gas turbine exhaust. CO results primarily from incomplete combustion either because of the water injection process or a partial load operation of the turbine. The CO catalyst
With the three mentioned emissions control methods, the current CGT's air emission permit limits approved by the Massachusetts Department of Environmental Protection (DEP) are?
Parameter
I
Fuel1
UnitsI
CGTNOx IGas
I P P ~
115CO Oil
Table 2.1: Air emissions pennit limits
The other important component of MIT's facilities is the electrical system. As shown in Diagram
2.4, the CGT generator is connected to the 13.8kV bus (13.8kV A and 13.8kV B busses).
Additionally, the Institute is connected to the local electric distribution utility through four
connecting lines (Ul, U2, U3, U4) where the power passes for two current-limiting reactors to
the 13.8kV bus. From this bus, the power is transformed to a lower 2.4kV voltage that is
transmitted to the campus through the 2400V A and 2400V B busses.
Diagr~m 2 4
Main electrical system
24
2.2.2.
PLANT'S
OPERATING MODEPrior to m a h g a future projection of the operation of the plant, it is important to analyze the past performance of the fachty, especially that from year 20045.
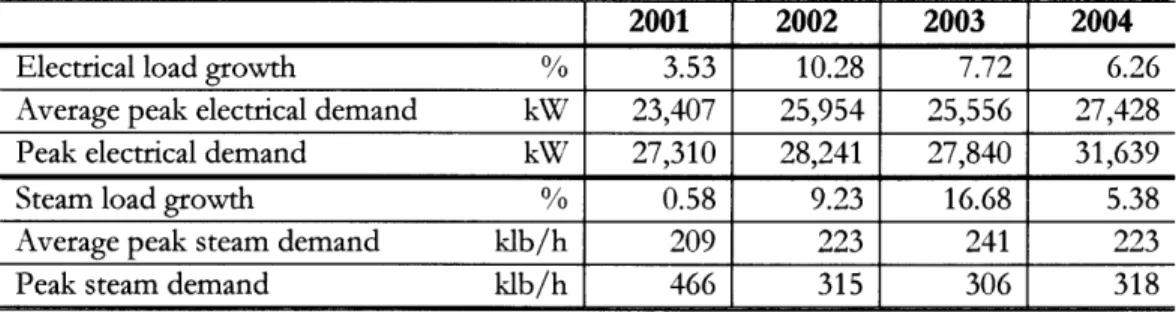
The Institute's electrical and thermal loads have been constantly increasing over the past years. When the project was conceived, the campus power requirement for 1995 was estimated at 135,000MWh and the average peak electrical demand was estimated at 21,327kVA per month (MIT, 1992, pp. 18). During 2004, the total electrical load was 192,270MWh with a 42% total increase, and the average peak load was 27,988ICVA with a 30% increase. As shown in Table 2.2, over the past four years the electrical load has increased in average almost 7% per year.
Regarlng the steam load, the maximum campus requirement for 1995 was estimated at 132klb/h. During 2004, total steam production was 1,426,796klb and the average peak demand was 223klb/h, with an important increment of 70% with respect to that in 1995. Table 2.2 shows that, for the past four years, the steam load has grown almost 8% per year in average.
Table 2.2: MIT's load, 2001
-
2004From Figure 2.1, we can clearly see the increasing trend of MIT's energy loads. Moreover, we can analyze the monthly electrical and steam load profdes for each year:
-
Electricity is used year-round for general purposes.-
Electrical demand is higher during summers because of the air conltioning needs, with a peak of 31,639kW in 2004.-
The hlghest steam demand occurs during winters due to the heating needs, with a peak of31 8klb/h in 2004.
25 .111
Figure 2.1:
MIT's
energy loads, 2000-
2005 Electrical and Steam loads 8CGT generation, 2000-2004
Energy [MWhImo] Staam @(lblmo]
20,000 ---- - - - - - 18,000 -- 16,000 -- 14,000 -- 140,000 120.000 I I
.
I .:
'-
80,000 I I.. .
0 I::-
60,000The nominal capacity of the CGT is 21MW, but depending on the season of the year it can
generate between 19.5MW and 22MW. The historical annual capacity factor26 of the plant shows
that the turbine has been used mostly as a base load power. The value over the past year has
been over 70%, and during 2004 the capacity factor was almost 91% with 7,936 operating hours (see Table 2.3). This latter value indicates not only more operatmg hours, but also an upgrade of the blades of the turbine that increased the capadty by at least IMW.
4,000
2,000
Historically, the project has provided over 75% of the electricity load. During year 2004, the
plant generated 155,544MWh which represented almost 81% of the Institute's electrical needs. For meeting the remaining 19% of the load, MITs had to buy 36,726MWh from the local electric utility NSTAR (see Table 2.3).
Jam00 J u W Jan-01 Jul41 Jaw02 Jul-02 Jan43 JuI-03 Jan-04 Jul-04
-
Total Campus Ekcbiecrl Load- - -
-
EkctrklCy genomtod GT-10 T o t a l sbam production (3,4,5,6)r I ' I I 0 -- ;
:
I1 I ma-- , @ I * -- m' I 1.- I , I I 0 , I I Table 2.3:CGT
operation, 2000-
2004 40,000 20.000Capacity factor CGT over 19.5MW % CGTgenerationoverelectricalload %
Energy purchase over electrical load %
From Figure 2.2, we can see the CGT operational characteristics during year 2004. Mostly in the
summer and in November, additional electricity is needed from NSTAR because of the high
levels of load and the maintenance of the turbine respectively.
26 Capacity factor is defined as the ratio of the generated electricity to the maximum capacity of the pant.
2001 79.54 89.20 10.80 2002 73.90 75.15 24.85 2003 84.35 79.63 20.37 2004 90.81 80.90 19.10
The steam load was mostly provided by the HRSG system, where the unfired waste heat
(maximum capacity of 100klb/hr) is used in a base load operation, and the supplemental firing system (maximum capacity of bOklb/hr) is used to provide flexibility to the system when more
steam is needed. As we will explain below, additional steam can be provided by steam boilers.
Electrical and Steam loads &
COT generation, 2004 E ~ r g y -01 Stam Blblmo] 20,OM) - .-.r --- .-r.. ...---.T.- -..--.T---...-..-.. r---.-..---
,.
..-.---..----r---T-.-...-7---.-.-,-- m,m I I I I I I I I I I I 14.000 -- -- 1 0 , ~ - - - - c - - c - - ! - - - c - M F s M ) 4 M a M A p . - M k h y 9 4 J u r r O I J u H W ~ S . p 0 4 O c H ) 4 M u 0 4 ~IIEkcbicly 0.nmlrd OT-10 T o t d cmrrgy pwohaw T o t a l sham productkn (3,4,5,6)
+
Figure
2.2:MIT
energy loads, 2004Prior to the cogeneration project, the steam in the campus was supplied by
5 boilers.
Currently,there are 3 from the ori@ boilers and 2 temporary ones. Table 2.4 shows the capacities, fuel
type and efficiencies27 for each of them.
Table 2.4: Boilers technical features
-
Boilers Additional No.3 klb/h Additional No.4 klb/h Additional No.5 klb/h Temporary No.7 klb/h Temporary No.8klb/h
The boilers work in coor&ation with the HRSG system to supply the required steam, especially
during peak hours, winter and at the time the CGT maintenance is made (see Figure 2.3). The
temporary boilers No.7 and 8 are operated when there is a contingency in the system, and they
must be fully-load operated. Boilers No.3, 4 and
5
will give flexibility to the system whenproviding the steam. During 2004, the boilers supplied 459,459klb/yr that represented 32% of the total steam consumption.
27
Efficiency levels for loads over 70%.
Capacity 80 80 100 60 60 Fuel No6 FO & NG No6 FO & NG No6 FO & NG No2 FO & NG NG Eficiencies 80% 80% 80% 82% 82%
Steam Production, 2004 Stmam (kpplmo]
Figure
2.3:JUP
.. steam - production, 2004We also need to review the fuel consumption of the plant28. Then, we will be able to calculate
the historical efficiency levels taking into consideration the electrical and thermal production.
Figure 2.4 shows the natural gas consumption by the CGT has increased during the past years,
indicative of the larger capacity factqr of the turbke with respect to previous years.
In addition, we can observe a dramatic change in the proportion of fuel being used in the boilers. I n 2002, boilers burned gas and No.6 in almost the same proportion, however during the last year almost 91% of the total Btu consumed by the boilers was due to No.6 fuel oil.
Total Fuel Consumption, 2002
-
2004Fu.l (mmeWr1 2500000 ,
.
r---..--.---.--.-....-..-.-.-...-.-..-..--.-.-..-...-.---.-...--.-.----.--...-.-.--.--..-.-.--..-,--..-.--,-~~i
I 2,000.000 : - - -- - - - - - - - - . - < - - - - - - -- - - - - - .. 2602 2803 2004 .(kr uwd GT-10 m6a8urrdHRSQBiO..uwdunrbol.n3,4,5 W No.6 FO wod rux bo#wr 3 , M I
-
- Figure 2.4: CUP fuel 'consaption, 2000-
2004 ' ' ': 1- . .-1
28
This important change in fuel consumption in the boilers can be explained because of the considerable difference in fuel prices paid by MIT. The average price for No.6 was
5.73$/MMBtu, while the average price for natural gas was 8.69$/MMBtu29. Therefore, it was
more economic to burn oil than natural gas dunng the last year. Regardmg environmental
consequences, the change did not have great C02 implications because the boilers have
consumed less fuel overall over the past few years. Total CO2 emissions coming from the boilers
- measured in metric tons - were about 55,000 in 2002 and 45,000 in 2004.
We can observe from Figure 2.5, the monthly characteristics in fuel consumption for year 2004. During winter, No.6 fuel oil was largely used by the boilers for supplying the additional campus'
steam needs. In November, more No.6 fuel oil was needed to replace the steam that was not
provided by the CGT that was under maintenance.
% of Total Fuel Consumption, 2004
Furl [K]
Jan44 FeM)4 Mar64 Apr-04 Maw 4yfKM JuUM Aug-04 Sep-04 OdM Nov44 DecQJ
011. u s d GT-10
.
Gsr u..d HRSGi . i I - , * W u . e d . u ~ m 3 A . 5 l s ~ i ; I N ~ J K ) ~ H d ~ b d k ~ ~ , , l i : ,, . 1 1 1 8 1
Figure 5:
PTJP
fuel consumption, 2004Finally, we can analyze the plant's performance. As Table
2.5
shows, we calculated two set ofhistorical values:
Table
2.5: Plant efficiencies, 2002-
2004Overall cogeneration efficiency %
CGT efficiency %
3
. . I I ,
" Prices extracted from MIT energy bills year 2004. Source: MITs Department Facilities.
2002 61.78% 26.27% 2003 63.18% 27.02% 2004 68.17% 26.60%


![[PDF] Serie d’exercices corriges pour s’initier aux bases de donnees](data:image/gif;base64,R0lGODlhAQABAIAAAP///wAAACH5BAEAAAAALAAAAAABAAEAAAICRAEAOw==)