Publisher’s version / Version de l'éditeur:
Energies, 9, 2, 2016-01-27
READ THESE TERMS AND CONDITIONS CAREFULLY BEFORE USING THIS WEBSITE.
https://nrc-publications.canada.ca/eng/copyright
Vous avez des questions? Nous pouvons vous aider. Pour communiquer directement avec un auteur, consultez la première page de la revue dans laquelle son article a été publié afin de trouver ses coordonnées. Si vous n’arrivez pas à les repérer, communiquez avec nous à [email protected].
Questions? Contact the NRC Publications Archive team at
[email protected]. If you wish to email the authors directly, please see the first page of the publication for their contact information.
NRC Publications Archive
Archives des publications du CNRC
This publication could be one of several versions: author’s original, accepted manuscript or the publisher’s version. / La version de cette publication peut être l’une des suivantes : la version prépublication de l’auteur, la version acceptée du manuscrit ou la version de l’éditeur.
For the publisher’s version, please access the DOI link below./ Pour consulter la version de l’éditeur, utilisez le lien DOI ci-dessous.
https://doi.org/10.3390/en9020079
Access and use of this website and the material on it are subject to the Terms and Conditions set forth at
Systematic study of separators in air-breathing flat-plate microbial fuel
cells - Part 2: Numerical modeling
Kazemi, Sona; Barazandegan, Melissa; Mohseni, Madjid; Fatih, Khalid
https://publications-cnrc.canada.ca/fra/droits
L’accès à ce site Web et l’utilisation de son contenu sont assujettis aux conditions présentées dans le site LISEZ CES CONDITIONS ATTENTIVEMENT AVANT D’UTILISER CE SITE WEB.
NRC Publications Record / Notice d'Archives des publications de CNRC:
https://nrc-publications.canada.ca/eng/view/object/?id=905be7ab-ed39-49d2-b016-c72a0846125c https://publications-cnrc.canada.ca/fra/voir/objet/?id=905be7ab-ed39-49d2-b016-c72a0846125cArticle
Systematic Study of Separators in Air-Breathing
Flat-Plate Microbial Fuel Cells—Part 2:
Numerical Modeling
Sona Kazemi1,2,*, Melissa Barazandegan1, Madjid Mohseni1and Khalid Fatih2
1 Department of Chemical and Biological Engineering, The University of British Columbia, Vancouver,
BC V6T 1Z3, Canada; [email protected] (M.B.); [email protected] (M.M.)
2 National Research Council Canada, Vancouver, BC V6T 1W5, Canada; [email protected]
* Correspondance: [email protected]; Tel.: +1-604-267-4005 Academic Editor: Chikashi Sato
Received: 11 November 2015; Accepted: 21 December 2015; Published: 27 January 2016
Abstract: The separator plays a key role on the performance of passive air-breathing flat-plate MFCs (FPMFC) as it isolates the anaerobic anode from the air-breathing cathode. The goal of the present work was to study the separator characteristics and its effect on the performance of passive air-breathing FPMFCs. This was performed partially through characterization of structure, properties, and performance correlations of eight separators presented in Part 1. Current work (Part 2) presents a numerical model developed based on the mixed potential theory to investigate the sensitivity of the electrode potentials and the power output to the separator characteristics. According to this numerical model, the decreased peak power results from an increase in the mass transfer coefficients of oxygen and ethanol, but mainly increasing mixed potentials at the anode by oxygen crossover. The model also indicates that the peak power is affected by the proton transport number of the separator, which affects the cathode pH. Anode pH, on the other hand, remains constant due to application of phosphate buffer solution as the electrolyte. Also according to this model, the peak power is not sensitive to the resistivity of the separator because of the overshadowing effect of the oxygen crossover.
Keywords:flat-plate microbial fuel cell (FPMFC); passive air-breathing; separator; electrode spacing; mixed potential theory; numerical model; crossover
1. Introduction
Microbial fuel cells (MFCs) can provide a unique opportunity for renewable energy production while removing organics from wastewater. In a microbial fuel cell, electricity is generated through oxidation of organic matter in wastewater by the biofilm at the anode and reduction of an oxidant (e.g., oxygen) at the cathode. Although MFCs have the potential to turn a waste stream (e.g., municipal wastewater) into a valuable source, efficient energy recovery from this source using MFCs requires substantial technological improvements. MFC research is still facing critical challenges such as the high cost (e.g., Pt-based cathodes, polymeric membranes) [1,2]. In fact, the capital cost of the MFCs constructed in lab-scale is estimated to be in the order of ca. $15 kg´1
chemical oxygen demand (COD) [3], which can hardly compete with the conventional biological wastewater treatment processes such as activated sludge (ca. $0.2 kg´1COD) and anaerobic digestion (ca. $0.02 kg´1COD) [4,5].
To decrease the overall capital and operating costs of the MFCs, the passive air-breathing design has become of interest. The application of passive convection and diffusion in the fuel cell design and operation is well known for decreasing the parasitic load for running auxiliary pumps, fans, or compressors, and eliminating the utilization of expensive oxidants in direct methanol fuel cell
Energies 2016, 9, 79 2 of 16
(DMFCs) [6–9]. Application of a passive air-breathing cathode could also result in a decreased overall cost, complexity, and volume of the MFC setup [10]. The air-breathing cathodes are also known to be susceptible to oxygen crossover [11–13]. The separator, which isolates the anaerobic anode from the air-breathing cathode, therefore, can play an important role on the performance of the passive air-breathing MFCs.
Similar to chemical fuel cells, the initial focus of the MFC research has been mainly on experimental exploration of the technology, with modeling receiving attention mainly in the past few years. Application of modeling in the MFC research can, however, help gain a better understanding of the operation, and facilitate the process design and optimization. Furthermore, it can be beneficial because investigating the performance experimentally can be time consuming and expensive. Models developed so far to simulate MFCs have been categorized to two main groups: comprehensive models, focusing on the overall performance, and specific models, focusing on the specific components [14]. Most of these models fall into the first category, with the main focus on either anode [15–20] (assuming that the MFC performance relies solely on the anode performance) or both anode and cathode [21–23] (assuming that the performance of both anode and cathode controls the MFC performance).
The modeling of the MFC, however, can also be valuable to elucidate the role that the separator plays in different MFC configurations (e.g., different electrode spacings) on the overall performance. Models targeting the role of the separator can, therefore, provide useful insight into the design of appropriate separators applicable to a specific MFC configuration. Such models can be further used to optimize the power output and the cost of the MFC based on the interactions between the electrode spacing and the separator characteristics (or type). To our knowledge, no such model has been developed to date.
In this paper, a numerical model was developed based on the mixed potential theory to simulate passive air-breathing flat-plate microbial fuel cells (FPMFCs), combining different electrode spacings and separators. The model was used to estimate the kinetic parameters of the bio-electrochemical system, tested in the Part 1 of this work [24], along with the anodic and cathodic mixed potentials. Furthermore, the sensitivity of the power output to the separator characteristics and the electrode spacing was investigated.
2. Results and Discussion
2.1. Parameters Estimation and Model Validation
Table1lists the estimated kinetics and mass transfer parameters of the ethanol-air FPMFC. The estimated exchange current densities in the biofilm were 0.36 A¨ m´2and 0.40 A¨ m´2for oxygen
reduction and ethanol oxidation, respectively, which were within the range of the values reported in the literature [25–29].
Table 1.Estimated kinetic and mass transfer parameters of the ethanol-air FPMFC.
Parameter Definition Value Unit
joBO
2 Exchange current density of oxygen reduction in the biofilm 0.36 A¨ m
´2
joBEtOH Exchange current density of ethanol oxidation in the biofilm 0.40 A¨ m´2
KBO2 Mass transfer coefficient of oxygen in the biofiom 2.7 ˆ 10´6 m¨ s´1
KBEtOH Mass transfer coefficient of ethanol in the biofilm 9.3 ˆ 10´6 m¨ s´1
αAAEtOH Anodic charge transfer coefficient of ethanol oxidation 7 ˆ 10´2
-αCAO
2 Anodic charge transfer coefficient of oxygen reduction 0.24
-αACEtOH Cathodic charge transfer coefficient of ethanol oxidation 3 ˆ 10´3
-αCCO
-The charge transfer coefficients were estimated by assuming the transfer of 2 electrons at the rate-determining step for both ethanol oxidation and oxygen reduction reactions. The estimated exchange current density and mass transfer coefficients in the biofilm suggested that ethanol oxidation within the biofilm was kinetically controlled while oxygen reduction was limited by diffusion of oxygen through the separator towards the anaerobic anode. Oxidation of ethanol and reduction of oxygen in the biofilm were assumed to happen at the biofilm-electrode interface; hence, the mass transfer coefficients of ethanol and oxygen in the biofilm estimated by the model are virtual. This is because both ethanol and oxygen were being consumed within the biofilm. Also, the experimentally measured CE values of lower than 15% indicated that only up to ca. 15% of the ethanol content of wastewater was degraded yielding electrical current, and over 85% of the ethanol was consumed by the communities not using the anode as the final electron acceptor. This ethanol degradation was likely accompanied by oxygen reduction (up to 3 moles of oxygen per mole of ethanol), as the methanogenic activities were inhibited by addition of 2-bromoethanesulfonate.
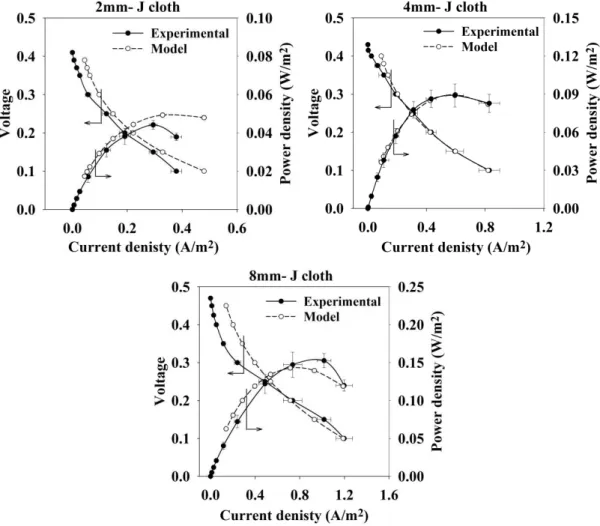
The model was further validated by solving the equations of the voltage and charge balance using the characteristics of J-cloth. Figure1compares the predicted by the model and experimental polarization and power density curves of three FPMFCs using J-cloth. A good agreement was observed between the predicted and the experimental polarization and power densities of all three FPMFCs. The average deviation of the predicted current density by the model from the measured current density values was ca. 0.05 A¨ m´2
. ‐ ‐ ‐ ‐ ∙ − ‐
Figure 1. Predicted vs. experimental polarization and power density curves of the FPMFCs using J-cloth as the separator.
Energies 2016, 9, 79 4 of 16
Figure2shows the estimated electrode potentials using different separators in the FPMFCs. The electrode potentials estimated by the model showed a critical role of the oxygen crossover on the anodic mixed potentials and the resulted anode depolarization. Oxygen crossover yielded a positive shift in the anode potential when the mass transfer coefficient of oxygen in the separators increased. In the 2 mm FPMFC, the anode depolarization increased more significantly as separators with larger coefficients were used. The effect of oxygen crossover on the anode potential became less significant as the electrode spacing increased (in the 4 mm and 8 mm FPMFCs), due to the lower concentration of oxygen at the anode.
− ‐ ‐ −
Figure 2.Estimated electrode potentials using different separators in the FPMFCs.
Nafion®117 gave the lowest anode potential values in all three FPMFCs (ca. ´0.3 V vs. standard hydrogen electrode (SHE) at open circuit), similar to the values reported in the MFCs using ferricyanide and ferric iron as the oxidant [30,31], and the passive air-breathing MFCs with electrode spacing of 2 cm and larger [32,33]. The extent of the anode depolarization matched that reported for the passive air-breathing MFCs with larger electrode spacing, as a result of the lower susceptibility of the polymeric Nafion®117 membrane to oxygen diffusion. At the largest electrode spacing applied (ca. 6.5 mm) in the 8 mm FPMFC, the applied diaphragms and the Aquivion®membrane indicated relatively similar anode depolarization, showing a similar extent of the mixed potentials at the anode.
The variation of the cathode potential using different separators was ca. 0.04 V in all three FPMFCs, as predicted previously in Part 1, attributed to the variation in the proton transport number of the selected separators. Cathode potential, however, is affected by protons (or OH´) transport and fuel
crossover at the same time. Therefore, while large pores contribute to a more balanced pH especially at the cathode, they facilitate fuel crossover as well. That could be one reason why mass transfer coefficient of ethanol did not seem to play a significant role on the cathode potential. Ethanol oxidation at the cathode, on the other hand, was most likely limited by its slow kinetics; hence, a possible variation in the extent of ethanol crossover using different separators did not seem to be affecting the cathode activity. In reality, the permeability of the applied diaphragms to the electrolyte can likely improve the proton transport number of the diaphragms in the FPMFC environment, yielding more stable pH values at the cathode. In the long-term, however, it exposes the Pt cathode to the synthetic wastewater as well as the suspended bacterial cells.
The estimated cathode potentials indicated lower values compared to the MFCs using ferricyanide and ferric iron as the oxidant [30,31], as a result of the sluggish kinetics of oxygen reduction on Pt [34–36], which can also be observed in Figure2in the low current density region. The high mass transfer coefficient of oxygen in the carbon cloth cathode can likely provide sufficient flux of oxygen to the catalyst active sites; however, mass transfer limitations and the resulted local oxygen starvation are still likely to decrease the air-breathing cathode performance.
2.2. Sensitivity Analysis
2.2.1. Performance Sensitivity to Separator Characteristics
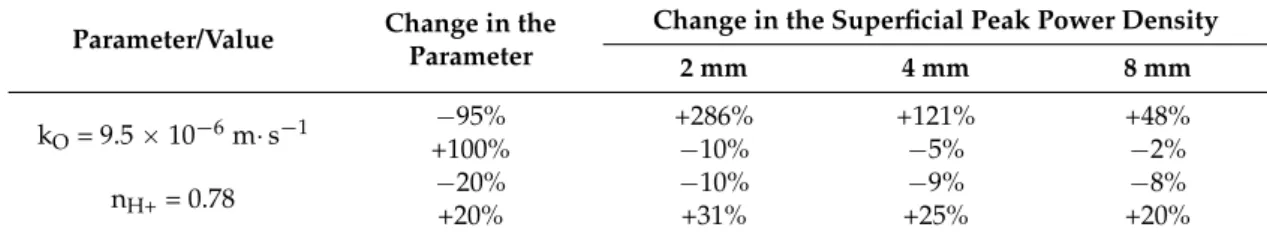
A preliminary analysis was performed to investigate the sensitivity of the power output with respect to the separator characteristics, by changing one of the separator characteristics at a time while leaving the remaining unchanged, and solving the voltage and charge balance equations. The sensitivity analysis was performed for Nafion®117, as an insensitive separator to the electrode spacing and for J-cloth, as one of the most sensitive separators to the electrode spacing. Tables2and3present the percentage change in the peak power density of the FPMFCs with one at a time change of the characteristics of Nafion®117 and J-cloth, respectively.
Table 2.Percentage change in the superficial peak power density of the FPMFCs with one at a time change of the characteristics of Nafion®117.
Parameter/Value Change in the Parameter
Change in the Superficial Peak Power Density
2 mm 4 mm 8 mm kO= 0.29 ˆ 10´6m¨ s´1 ´95% +49% +45% +40% +100% ´25% ´19% ´13% +1000% ´70% ´54% ´34% nH+= 0.59 ´60% ´7% ´7% ´6% +60% +24% +23% +23%
Table 3.Percentage change in the superficial peak power density of the FPMFCs with one at a time change of the characteristics of J-cloth.
Parameter/Value Change in the Parameter
Change in the Superficial Peak Power Density
2 mm 4 mm 8 mm kO= 9.5 ˆ 10´6m¨ s´1 ´95% +286% +121% +48% +100% ´10% ´5% ´2% nH+= 0.78 ´20% ´10% ´9% ´8% +20% +31% +25% +20%
Energies 2016, 9, 79 6 of 16
The sensitivity analysis results indicated that the power output of the passive air-breathing FPMFCs using Nafion®117 was more sensitive to the oxygen crossover compared to its other characteristics. Decreasing the oxygen crossover by 95% resulted in an increase by 49%, 45%, and 40% in peak power density of the 2 mm, 4 mm, and 8 mm FPMFCs, respectively. Hence, at a very low extent of oxygen crossover, the superficial peak power density was still relatively insensitive to a change in the electrode spacing. Furthermore, the increased peak power densities due to the decreased oxygen crossover suggested that even using Nafion®117, which was the least susceptible separator to
oxygen, the performance was still being affected by oxygen crossover.
Increasing the oxygen crossover by 100%, on the other hand, affected the peak power less significantly resulting in 25%, 19%, and 13% decrease in the peak power of the 2 mm, 4 mm, and 8 mm FPMFCs, respectively. The sensitivity of the peak power density to the electrode spacing, however, increased. A further increase in the oxygen crossover by 1000% decreased the peak power density by 70%, 54%, and 34% in the 2 mm, 4 mm, and 8 mm FPMFCs, respectively.
The proton transport number of the separators affected the peak power by altering the cathode potential [32,33]. A 60% increase in the proton transport number of Nafion®117 (from 0.59 to 0.94) was estimated to increase the peak power similarly in all three FPMFCs by 23%–24%. The same percentage of decrease in the proton transport number (from 0.59 to 0.24), on the other hand, slightly decreased the peak power (6%–7%).
The peak power density did not indicate any sensitivity to the variation in neither the mass transfer coefficient of ethanol nor the ionic resistivity within the measured ranges. Ethanol oxidation on the cathode was controlled by its slow kinetics, thus a potential increase in the ethanol crossover did not reflect on the cathodic mixed potentials. Although the experimental results indicated that the performance was hindered when separators with greater ethanol crossover were used, the model showed that this performance drop was due to the increased oxygen crossover that came along with the increased ethanol crossover. The ionic resistivity, on the other hand, was an indicator of the Ohmic resistance of the separator which was small compared to the Ohmic resistance of the cell.
The sensitivity analysis using J-cloth characteristics indicated that the power output of the passive air-breathing FPMFCs were more sensitive to the mass transfer coefficient of oxygen compared to Nafion®117. The sensitivity of the peak power density decreased as the electrode spacing increased, resulting in an increase of 286%, 121%, and 48% in the peak power density of the 2 mm, 4 mm, and 8 mm FPMFCs, respectively, when decreasing the oxygen crossover by 95%. The increase in the peak power density of the 2 mm FPMFC using J-cloth was ca. 6 times higher than that using Nafion®117, which was an indicator of the excessive flux of oxygen towards the anaerobic anode using J-cloth. The predicted electrode potentials also showed that all three FPMFCs were suffering from anodic mixed potentials.
The increase of the oxygen crossover by 100% decreased the peak power much less significantly resulting in less than 10% of decrease in the peak power density. The 10% decrease in the peak power density with a 100% increase in the oxygen crossover using J-cloth was an interesting observation, indicating that a separator-free MFC would likely yield a slightly lower peak power density compared to that using J-cloth. This questions functionality of 1 layer of J-cloth beside the physical isolation of anode from cathode in the passive air-breathing FPMFCs.
Similar to Nafion®117, a variation in the proton transport number of the J-cloth altered the peak power density through affecting the cathode potential [32,33]. For example, a 20% increase in the proton transport number was estimated to increase the peak power density by 31%, 25%, and 20% in the FPMFCs. The same percentage of decrease in the proton transport number slightly decreased the peak power (less than 10%).
The peak power density was not sensitive to the variation in neither the mass transfer coefficient of ethanol nor the ionic resistivity within the measured ranges, due to the kinetically controlled ethanol oxidation at the cathode as well as the overshadowing effect of the oxygen crossover. Ethanol crossover
may not affect the peak power significantly, but it could result in cathodic biofilm development in the long-term.
2.2.2. Performance Sensitivity to Electrode Spacing
The electrode spacing was increased in the model to investigate the sensitivity of the superficial peak power density, using different separators. Figure3shows the sensitivity of polarization and power density to electrode spacing in the FPMFC using Nafion®117 and J-cloth. Increasing the electrode spacing up to 2 cm using J-cloth increased the peak power density from 0.05 W¨ m´2to 0.2 W¨ m´2, as
a result of the decreased oxygen concentration at the anode. The decreased anodic mixed potentials likely alleviated the negative effect of the increased Ohmic loss attributed to the increased electrode spacing. The peak power density decreased at the electrode spacing larger than 2 cm, where the Ohmic loss of the system became critical. The peak power density using Nafion®117 slightly increased as the electrode spacing increased, and similar to J-cloth, dropped at the electrode spacing over 2 cm.
(a) (b) ‐ ∙ − ‐ ∙ − ‐
Figure 3. Sensitivity of polarization and power density curves to the electrode spacing using Nafion®117 (a) and J-cloth (b).
As the electrode spacing increased, the effect of the oxygen crossover became less significant resulting in a more significant role played by the proton transport number of the separator. At the electrode spacing of 2 cm, Celgard®and Zirfon®gave the highest peak power densities (0.24 W¨ m´2
), as a result of their higher selectivity towards transferring protons. SciMat®and J-cloth, on the other hand, produced the lowest peak power densities (0.20 W¨ m´2) showing that the oxygen crossover
could still be hindering the performance. Overall, it was concluded that the appropriate characteristics of the separator component for the passive air-breathing MFCs is dependent on the MFC configuration. Hence, while in the configuration with small electrode spacing, the oxygen crossover can be critical for the sustainable power generation, in the configurations with larger electrode spacing, the pH splitting as well as the high Ohmic loss issues play a detrimental role on the performance.
3. Materials and Methods
3.1. Model Development
The proposed model focuses on the voltage and the charge balance, mass and charge transfer limitations on the current generation, and the mixed potentials due to the reactants crossover. A schematic of charge transfer and reactants crossover paths are presented in Figure4.
Energies 2016, 9, 79 8 of 16 ‐ ∙ − ‐ ∙ − ‐
Figure 4.Schematic of charge transfer and reactants crossover paths in the passive air breathing FPMFC utilizing ethanol.
The mixed potentials at the anode are shown as the anode depolarization happening mainly due to the oxygen crossing over the cathode, the separator, the electrolyte (wastewater), and the biofilm. The mixed potentials at the cathode are shown as the cathode depolarization happening mainly due to the ethanol crossing over the separator. The following assumptions were made in the FPMFC modeling:
‚ The MFC system is similar to a chemical fuel cell, hence no terms are added to represent the growth and death rate of the microbial communities, the biomass generation, and the biofilm growth on the cathode, and the separator.
‚ The anode electrode is assumed to be covered by the bacteria. Hence, the ethanol oxidation and oxygen reduction reactions are catalyzed by the biofilm, and do not take place on the naked electrode.
‚ Transfer of electrons from the bacteria to the electrode is reversible and fast, therefore, considered as a Nernstian electrode process.
‚ Flow of ions through the biofilm is not limiting the electro-neutrality of the system, and the Ohmic loss is solely due to the distance between the surface of the anode and the separator.
‚ Complete ethanol oxidation and the oxygen reduction are the sole anodic and cathodic reactions occurring in the MFC. Hence, no by-products (e.g., acetate) are assumed to be generated, to simplify the model.
‚ Oxygen reduction by the bacteria is assumed to be an electrochemical reaction.
‚ The electrolyte is assumed to be stagnant, thus no effect of the electrolyte flow on the concentration profile is considered.
‚ The fuel (ethanol) is well-distributed within the 3D electrode, thus the concentration profile is neglected and no starvation is happening.
‚ The temperature variation within the anode chamber is negligible, hence the reactions are isothermal.
‚ The anode is well-buffered and there is no local pH drop within the biofilm. The temperature is also well-controlled at 303 K in both compartments.
‚ Due to the electro-activity of the 99% of the thickness of the 3D electrode [37], a uniform current and voltage distribution within the 3D electrode is assumed.
Complete ethanol (EtOH) oxidation at the anode yields a 12-electron transfer reaction: C2H5OH ` 3H2O Ñ 12e´
` 12H`
The equilibrium potential for this reaction at the anode and the cathode can be calculated as follows: EaEtOH“ E0EtOH´ RT nEtOHFln ˜ CaEtOH “H`‰ a nEtOH ¸ (2) EcEtOH“ E0EtOH´ RT nEtOHFln ˜ CcEtOH “H`‰ c nEtOH ¸ (3) where E0EtOH is the standard half-cell potential of the ethanol oxidation reaction (V vs. SHE), R is the universal gas constant (J¨ mol´1
¨ K´1
), T is the temperature (K), nEtOHis the number of electrons
transferred during the complete ethanol oxidation, F is the Faraday constant (C¨ mol´1), Ca
EtOHand
CcEtOH are the concentration of ethanol (M) at the anode and the cathode, respectively, and“H`‰
a
and“H`‰
c are the concentration of protons (M) at the anode and the cathode, respectively. The
oxygen reduction reaction is a 4-electron transfer reaction and in neutral and alkaline solutions is represented by:
O2` 4e´
` 2H2O Ñ 4OH´
(4) The equilibrium potential for this reaction at the anode and the cathode can be calculated as follows: EaO2 “ E0O 2´ RT nO2F lnp“OH ´‰ a nO2 CaO2 q (5) EcO2 “ E0O2´ RT nO2F lnp“OH ´‰ c nO2 PO2 q (6)
where E0O2is the standard half-cell potential of the oxygen reduction reaction (V vs. SHE), nO2 is the number of the electrons transferred during the oxygen reduction, CaO2and PO2 are the concentration (M) and partial pressure (atm) of oxygen at the anode and the cathode, respectively, and“OH´‰
aand
“OH´‰
care the concentration of hydroxyl ions (M) at the anode and the cathode, respectively. The
overall FPMFC voltage balance can be written as:
Ecell“ Ec´ Ea´ EOhm (7)
where Ecand Eaare the cathode and the anode operating potentials, respectively, and EOhmis the
Ohmic loss of the FPMFC. The anodic and the cathodic overpotentials due to each reaction and the Ohmic loss can be calculated using the following equations:
ηaEtOH“ Ea´ EaEtOH (8) ηaO 2 “ Ea´ E a O2 (9) ηcEtOH“ Ec´ EcEtOH (10) ηcO 2 “ Ec´ E c O2 (11) Eohm“ J ˆ RS` d κE ˙ (12) where ηaEtOHand ηcEtOHare the anodic and the cathode overpotentials (V) of the ethanol oxidation reaction, ηaO2 and ηcO
2 are the anodic and the cathodic overpotentials (V) of the oxygen reduction reaction, respectively, RSis the ionic resistivity of the separator (Ω¨ m2), d is the electrode spacing of
the FPMFC (m), κEis the ionic conductivity of the electrolyte (S¨ m´1), and J is the current density
(A¨ m´2
) which can be calculated as follows:
J “ JaEtOH´ JaO2 “ JcO
2´ J
c
Energies 2016, 9, 79 10 of 16 1 JaEtOH “ 1 JamtEtOH ` 1 JactEtOH (14) 1 JaO2 “ 1 JamtO2 ` 1 JactO2 (15) 1 JcEtOH “ 1 JcmtEtOH ` 1 JcctEtOH (16) 1 JcO2 “ 1 JcmtO2 ` 1 JcctO2 (17)
where amt and cmt refer to the anodic and cathodic mass transfer controlled (limiting) current densities, and act and cct refer to the anodic and cathodic charge transfer (kinetic) controlled current densities, respectively, and JaEtOH, JaO2, JEtOHc , and JcO2 are the current densities (A¨ m´2) of ethanol oxidation and
oxygen reduction at the anode and the cathode, respectively. Equation (13) indicates that anodic and the cathodic current densities must be equal. The mass transfer controlled current densities for ethanol oxidation and oxygen reduction at the anode and the cathode can be calculated using Equation (18) through Equation (21):
JamtEtOH“ nEtOHFKaEtOHCEtOH (18) JcmtEtOH“ nEtOHFKcEtOHCEtOH (19)
JamtO2 “ nO2FKaO2CO2 (20)
JcmtO2 “ nO2FKcO2CO2 (21)
where KaEtOH, KaO2, KcEtOH, and KcO2 are the effective mass transfer coefficients (m¨ s´1
) at the anode side and at the cathode side of ethanol and oxygen, respectively, and can be calculated using Equation (22) through Equation (25): 1 KaEtOH “ 1 KBEtOH (22) 1 KaO2 “ 1 KBO2 ` d DEO2 ` Y DO2 ` 1 KCO2 (23) 1 KcEtOH “ Y DEtOH (24) 1 KcO2 “ 1 KCO2 (25)
where KBEtOHand KBO2 the mass transfer coefficients (m¨ s´1
) of are ethanol and oxygen in the biofilm, respectively, DEO2 is the diffusion coefficient (m2¨ s´1
) of oxygen in the electrolyte, DO2 and DEtOH are the diffusion coefficients (m2¨ s´1
) of oxygen and ethanol in the separator, respectively, KCO2 is the mass transfer coefficient (m¨ s´1) of oxygen in the cathode, d is the electrode spacing (m), and
Y is the separator thickness (m). The charge transfer (kinetic) controlled current densities for the ethanol oxidation and oxygen reduction reactions at the anode and the cathode are calculated using the Erdey-Gruz-Volmer-Butler equation:
JactEtOH“ j0 BEtOH
« exp
«
αAAEtOHnEtOHF`Ea´ EaEtOH
˘
RT
ff ´ exp
«
p1 ´ αAAEtOHqnEtOHF`Ea´ EaEtOH
˘ RT ffff (26) Jcct EtOH“ j0EtOH « exp «
αACEtOHnEtOHF`Ec´ EcEtOH
˘
RT
ff ´ exp
«
p1 ´ αACEtOHqnEtOHF`Ec´ EcEtOH
˘
RT
ffff
JactO2 “ j0BO 2 » –exp » – p1 ´ αCAO2qnO2F ´ Ea´ EaO2 ¯ RT fi fl´ exp » – ´αCAO2nEtOHF ´ Ea´ EaO2 ¯ RT fi fl fi fl (28) JcctO2 “ j0O 2 » –exp » – p1 ´ αCC O2qnO2F ´ Ec´ EcO2 ¯ RT fi fl´ exp » – ´αCC O2nO2F ´ Ec´ EcO2 ¯ RT fi fl fi fl (29)
where j0BEtOHand j0BO
2are the exchange current densities (A¨ m
´2
) of ethanol oxidation and oxygen reduction in the biofilm, j0EtOHand j0O2 are the exchange current densities (A¨ m´2
) of ethanol oxidation and oxygen reduction at the cathode, αAA
EtOH and αCAO2 are the charge transfer coefficients of ethanol oxidation and oxygen reduction at the anode, and αAC
EtOHand αCCO2 are the charge transfer coefficients of ethanol oxidation and oxygen reduction at the cathode, respectively. The average ethanol concentration within and alongside the anode electrode is estimated by calculating the logarithmic mean of the inlet and the outlet concentration. The pH of the cathode is estimated taking into account the proton transport number of the separator and calculating the protons concentration at the cathode during the current generation [38].
3.2. Parameter Estimation
Table4lists the characteristics of the separators investigated previously in Part 1 of this work. The eight model parameters listed in Table5cannot be determined from the experimental data, hence are estimated through an iterative optimization algorithm using a sequential quadratic programming (SQP) method for solving the constrained non-linear optimization problem. These parameters are estimated by minimizing the summation of the square roots of the difference between the measured and the predicted current densities, minimizing an objective function defined as:
Fobj“ N ÿ i“1 M ÿ j“1 ÿK k“1pJ 1 i,j,k´ Ji,j,kq2 (30)
where N, M, and K represent the number of the separators, the data points, and the FPMFCs used for the optimization problem, respectively. The characteristic of Nafion®117, Aquivion®, Celgard®, Zirfon®, Nylon mesh, Glass fiber filter, and SciMat®are used to solve the optimization problem. Integration of model equations into the optimization problem is performed in MATLAB (The Mathworks Inc., Natick, MA, USA). The estimated parameters are then used to solve the model equations during the sensitivity analysis and electrode potentials estimation. The characteristics data of J-cloth is used for model validation.
Table 4.Characteristics of the separators investigated in part 1 of this work [24].
Separator kO(ˆ10´6m¨ s´1) kE(ˆ10´6m¨ s´1) RS(ˆ10´4Ω¨m2) nH+ Nafion®117 0.29 ˘ 0.02 0.49 ˘ 0.01 5.4 ˘ 0.1 0.59 ˘ 0.01 Aquivion® 0.77 ˘ 0.05 0.98 ˘ 0.01 0.8 ˘ 0.1 0.72 ˘ 0.01 Celgard® 1.2 ˘ 0.1 0.84 ˘ 0.01 4.4 ˘ 0.2 0.92 ˘ 0.01 Zirfon® 1.5 ˘ 0.1 0.58 ˘ 0.01 14 ˘ 0.4 0.92 ˘ 0.01 Nylon mesh 2.2 ˘ 0.1 2.2 ˘ 0.2 1.4 ˘ 0.1 0.89 ˘ 0.03
Glass fiber filter 0.87 ˘ 0.06 1.0 ˘ 0.1 7.8 ˘ 0.2 0.62 ˘ 0.02
SciMat® 2.6 ˘ 0.1 1.9 ˘ 0.1 3.1 ˘ 0.1 0.66 ˘ 0.03
J-cloth 9.5 ˘ 0.6 33 ˘ 3 6.2 ˘ 0.2 0.78 ˘ 0.02
Table5presents the operating conditions, constants, and parameters of the experimental setup for the model system of Equation (1) through Equation (29).
Energies 2016, 9, 79 12 of 16
Table 5.Parameters of operation and the constants of the ethanol-air MFC model.
Symbol Definition Value Unit
R Universal gas constant 8.314 J¨ mol´1¨K´1
T Temperature 303 K
F Faraday constant 96485.3 C¨ mol´1
nEtOH Number of electrons transferred in ethanol full oxidation 12
-nO2 Number of electrons transferred in oxygen full reduction 4
-pHout Outlet pH 7
-pHin Inlet pH 8.5
-j0O2 Exchange current density of oxygen reduction on Pt 0.015 A¨ m´2
j0EtOH Exchange current density of ethanol oxidation on Pt 0.003 A¨ m´2
KcO2 Mass transfer coefficient of oxygen in the air cathode 2.7 ˆ 10´5 m¨ s´1
DEO
2 Diffusion coefficient of oxygen in the electrolyte 2 ˆ 10
´9 m2¨s´1
Cin Ethanol concentration in the inlet stream 0.085 M
E0EtOH Standard half-cell potential of ethanol oxidation 0.084 V vs. SHE E0O
2 Standard half-cell potential of oxygen reduction 0.401 V vs. SHE
PO2 Partial pressure of oxygen in the air 0.21 atm
CO2 Oxygen concentration at the cathode 8.3 mol.m´3
κE Ionic conductivity of the synthetic wastewater 0.5 S¨ m´1
4. Conclusions
A numerical model was developed based on the mixed potential theory to link the separator characteristics investigate in part 1 of this work to the performance of passive air-breathing FPMFC. Development of such model showed that it was possible to simulate an MFC with a stable biofilm similar to a chemical fuel cell. The model was used to estimate the kinetic parameters of the bio-electrochemical system and predict the anodic and cathodic mixed potentials, and polarization and power density curves using different separators.
The exchange current densities in the biofilm were estimated to be 0.36 A¨ m´2
and 0.40 A¨ m´2
for oxygen reduction and ethanol oxidation, respectively, and were in good agreement with the literature. According to the estimated exchange current density and mass transfer coefficients in the biofilm, ethanol oxidation was kinetically controlled while oxygen reduction was controlled by transfer of oxygen through the separator. In addition to ethanol oxidation at the anode, oxygen reduction at the cathode was predicted to be limited mainly by the sluggish kinetics as well. Mass transfer, therefore, was not indicated to be an issue in the current generation by the principle anodic and cathodic reactions.
It was also indicated that oxygen crossover played a critical role on the anode performance, through creation of mixed potentials especially at small electrode spacing. The significance of the oxygen crossover on the peak power density decreased as the electrode spacing increased, making oxygen diffusion the main limiting factor in the anodic mixed potential. The performance was also affected by the proton transport number of the separator (selectivity towards protons), which affected cathode pH and potential. The cathode potential, in fact, increased as the proton transport number of the separator increased resulting in an increased peak power density.
Ethanol crossover and the separator ionic resistivity did not play detrimental roles on the performance, mainly due to the slow kinetics of the ethanol oxidation reaction at the cathode, the relatively high Ohmic loss of the synthetic wastewater used as the electrolyte, and the oxygen crossover overshadowing the effect of the resistivity. Although the power output was not sensitive to ethanol crossover in the short-term, it could be affected in the long-term, when a biofilm is developed on the cathode. For the present cell configuration, increasing the electrode spacing by the model beyond 2 cm
decreased the peak power density, due to the increased Ohmic loss, but below 2 cm it increased the peak power density as a result of the decreased anodic mixed potentials.
Acknowledgments:This work was funded by the Natural Sciences and Engineering Research Council of Canada (NSERC) and the Agriculture Agri-Food Canada (AAFC), and supported by the National Research Council Canada (NRC) and the University of British Columbia (UBC). The authors especially acknowledge Emeritus Colin Oloman for his guidance and fruitful discussions.
Author Contributions: The numerical model and MATLAB code were developed by Sona Kazemi and Melissa Barazandegan based on the experimental data collected by Sona Kazemi in part 1 of this work. The manuscript preparation and revision was done by Sona Kazemi under supervision of Madjid Mohseni and Khalid Fatih.
Conflicts of Interest:The authors declare no conflict of interest. The founding sponsors had no role in the design of the study; in the collection, analyses, or interpretation of data; in the writing of the manuscript, and in the decision to publish the results.
Abbreviations
Abbreviation Definition
MFC Microbial Fuel Cell
FPMFC Flat-Plate Microbial Fuel Cell DMFC Direct Methanol Fuel Cell
CE Coulombic Efficiency
COD Chemical Oxygen Demand
SQP Sequential Quadratic Programming SHE Standard Hydrogen Electrode
3D 3 Dimensional
Symbol Definition Unit
R Universal Gas Constant J¨ mol´1¨ K´1
T Temperature K
F Faraday Constant C¨ mol´1
d Electrode Spacing m
Y Separator thickness m
nH` Proton Transport Number of the Separator
-κE Conductivity of Wastewater S¨ m´1
RS Ionic Resistivity of the Separator Ωm2
κS Ionic Conductivity of the Separator S¨ m´1
Ecell Cell Voltage V
EOhm Ohmic Overpotential V
E Operating Electrode Potential V vs. SHE
Ec Cathode Potential V vs. SHE
Ea Anode Potential V vs. SHE
E0 Potential in the Solution Phase V vs. SHE
E˝e Standard Half-Cell Potential of the Reaction at 298 K V vs. SHE Ece Equilibrium Potential of the Reduction Reaction V vs. SHE E0EtOH Standard half-cell Potential of Ethanol Oxidation at 298 K V vs. SHE EaEtOH Equilibrium Potential of Ethanol Oxidation at the Anode V vs. SHE EcEtOH Equilibrium Potential of Ethanol Oxidation at the Cathode V vs. SHE E0O2 Standard half-cell Potential of Oxygen Reduction at 298 K V vs. SHE EaO2 Equilibrium Potential of Oxygen Reduction at the Anode V vs. SHE EcO2 Equilibrium Potential of Oxygen Reduction at the Cathode V vs. SHE n Number of Electrons Exchanged in the redox Reaction
-Energies 2016, 9, 79 14 of 16
nEtOH Number of Electrons Exchanged in Ethanol Oxidation
-nO2 Number of Electrons Exchanged in Oxygen Reduction
-CaO2 Oxygen Concentration at the anode M
PO2 Oxygen Partial Pressure at the Cathode atm
“H`‰
a Protons Concentration at the Anode M
“H`‰
c Protons Concentration at the Cathode M
“OH´‰
a Hydroxyls Concentration at the Anode M
“OH´‰
c Hydroxyls Concentration at the Cathode M
ηc Cathode Overpotential V
ηa Anode Overpotential V
ηaEtOH Overpotential of Ethanol Oxidation at the Anode V ηcEtOH Overpotential of Ethanol Oxidation at the Cathode V ηaO
2 Overpotential of Oxygen Reduction at the Anode V
ηcO
2 Overpotential of Oxygen Reduction at the Cathode V
j Local Faradic Current Density A¨ m´2
J1 Measured Current Density A¨ m´2
J Predicted Current Density A¨ m´2
JcEtOH Current Density of Ethanol Oxidation at the Cathode A¨ m´2
JaEtOH Current Density of Ethanol Oxidation at the Anode A¨ m´2
JcO2 Current Density of Oxygen Reduction at the Cathode A¨ m´2
JaO2 Current Density of Oxygen Reduction at the Anode A¨ m´2
JamtEtOH Limiting Current Density of Ethanol Oxidation at the Anode A¨ m´2
JactEtOH Kinetically Controlled Current Density of Ethanol Oxidation at the Anode A¨ m´2
JcmtEtOH Limiting Current Density of Ethanol Oxidation at the Cathode A¨ m´2
JcctEtOH Kinetically Controlled Current Density of Ethanol Oxidation at the Cathode
A¨ m´2
JamtO2 Limiting Current Density of Oxygen Reduction at the Anode A¨ m´2
JactO2 Kinetically Controlled Current Density of Oxygen Reduction at the Anode A¨ m´2
JcmtO2 Limiting Current Density of Oxygen Reduction at the Cathode A¨ m´2
JcctO2 Kinetically Controlled Current Density of Oxygen Reduction at the Cathode
A¨ m´2
j0 Exchange Current Density A¨ m´2
j0BEtOH Exchange Current Density of Ethanol Oxidation in the biofilm A¨ m´2
j0BO
2 Exchange Current Density of Oxygen Reduction in the biofilm A¨ m
´2
j0EtOH Exchange Current Density of Ethanol Oxidation on Pt A¨ m´2
j0O2 Exchange Current Density of Oxygen Reduction on Pt A¨ m´2
DO Diffusion Coefficient of Oxygen in the Separator m2¨ s´1
DE Diffusion Coefficient of Ethanol in the Separator m2¨ s´1
kO Mass Transfer Coefficient of Oxygen in the Separator m2¨ s´1
kE Mass Transfer Coefficient of Ethanol in the Separator m2¨ s´1
KaEtOH Effective Mass Transfer Coefficient of Ethanol at the Anode m¨ s´1
KaO2 Effective Mass Transfer Coefficient of Oxygen at the Cathode m¨ s´1
KcEtOH Effective Mass Transfer Coefficient of Ethanol at the Anode m¨ s´1
KcO2 Effective Mass Transfer Coefficient of Oxygen at the Cathode m¨ s´1
KBO2 Mass Transfer Coefficient of Oxygen in the Biofilm m¨ s´1
DEO2 Diffusion Coefficient of Oxygen in the Electrolyte m¨ s´1
KCO2 Mass Transfer Coefficient of Oxygen in the Cathode m¨ s´1
α Electron Transfer Coefficient
-αAAEtOH Anodic Charge Transfer Coefficient of Ethanol Oxidation at the Anode -αACEtOH Anodic Charge Transfer Coefficient of Ethanol Oxidation at the Cathode -αCAO
2 Cathodic Charge Transfer Coefficient of Ethanol Oxidation at the Anode -αCCO
2 Cathodic Charge Transfer Coefficient of Ethanol Oxidation at the Cathode
-Fobj Objective Function
-References
1. Kim, B.; Chang, I.; Gadd, G. Challenges in microbial fuel cell development and operation. Appl. Microbiol. Biotechnol. 2007, 76, 485–494. [PubMed]
2. Jung, R.K.; Cheng, S.; Oh, S.-E.; Logan, B.E. Power generation using different cation, anion, and ultrafiltration membranes in microbial fuel cells. Environ. Sci. Technol. 2007, 41, 1004–1009.
3. Rozendal, R.A.; Hamelers, H.V.M.; Rabaey, K.; Keller, J.; Buisman, C.J.N. Towards practical implementation of bioelectrochemical wastewater treatment. Trends Biotechnol. 2008, 26, 450–459. [CrossRef] [PubMed] 4. Pham, T.H.; Rabaey, K.; Aelterman, P.; Clauwaert, P.; de Schamphelaire, L.; Boon, N.; Verstraete, W. Microbial
fuel cells in relation to conventional anaerobic digestion technology. Eng. Life Sci. 2006, 6, 285–292. [CrossRef] 5. Aiyuk, S.; Forrez, I.; Lieven, D.K.; van Haandel, A.; Verstraete, W. Anaerobic and complementary treatment of domestic sewage in regions with hot climates—A review. Bioresour. Technol. 2006, 97, 2225–2241. [CrossRef] [PubMed]
6. Kho, B.K.; Bae, B.; Scibioh, M.A.; Lee, J.; Ha, H.Y. On the consequences of methanol crossover in passive air-breathing direct methanol fuel cells. J. Power Sources 2005, 142, 50–55. [CrossRef]
7. Saarinen, V.; Himanen, O.; Kallio, T.; Sundholm, G.; Kontturi, K. A 3D model for the free-breathing direct methanol fuel cell: Methanol crossover aspects and validations with current distribution measurements. J. Power Sources 2007, 172, 805–815. [CrossRef]
8. Chen, R.; Zhao, T.S.; Liu, J.G. Effect of cell orientation on the performance of passive direct methanol fuel cells. J. Power Sources 2006, 157, 351–357. [CrossRef]
9. Shimizu, T.; Momma, T.; Mohamedi, M.; Osaka, T.; Sarangapani, S. Design and fabrication of pumpless small direct methanol fuel cells for portable applications. J. Power Sources 2004, 137, 277–283. [CrossRef]
10. Zhao, T.S.; Chen, R.; Yang, W.W.; Xu, C. Small direct methanol fuel cells with passive supply of reactants. J. Power Sources 2009, 191, 185–202. [CrossRef]
11. Min, B.; Logan, B.E. Continuous electricity generation from domestic wastewater and organic substrates in a flat plate microbial fuel cell. Environ. Sci. Technol. 2004, 38, 5809–5814. [CrossRef] [PubMed]
12. Zhang, X.; Sun, H.; Liang, P.; Huang, X.; Chen, X.; Logan, B.E. Air-cathode structure optimization in separator-coupled microbial fuel cells. Biosens. Bioelectron. 2011, 30, 267–271. [CrossRef] [PubMed] 13. Fan, Y.; Hu, H.; Liu, H. Enhanced Coulombic efficiency and power density of air-cathode microbial fuel cells
with an improved cell configuration. J. Power Sources 2007, 171, 348–354. [CrossRef]
14. Ortiz-Martínez, V.M.; Salar-García, M.J.; de los Ríos, A.P.; Hernández-Fernández, F.J.; Egea, J.A.; Lozano, L.J. Developments in microbial fuel cell modeling. Chem. Eng. J. 2015, 271, 50–60. [CrossRef]
15. Marcus, A.K.; Torres, C.I.; Rittmann, B.E. Conduction-based modeling of the biofilm anode of a microbial fuel cell. Biotechnol. Bioeng. 2007, 98, 1171–1182. [CrossRef] [PubMed]
16. Picioreanu, C.; van Loosdrecht, M.C.M.; Katuri, K.P.; Scott, K.; Head, I.M. Mathematical model for microbial fuel cells with anodic biofilms and anaerobic digestion. Water Sci. Technol. J. Int. Assoc. Water Pollut. Res.
2008, 57, 965–971. [CrossRef] [PubMed]
17. Picioreanu, C.; Head, I.M.; Katuri, K.P.; van Loosdrecht, M.C.M.; Scott, K. A computational model for biofilm-based microbial fuel cells. Water Res. 2007, 41, 2921–2940. [CrossRef] [PubMed]
18. Zhang, X.; Halme, A. Modelling of a microbial fuel cell process. Biotechnol. Lett. 1995, 17, 809–814. [CrossRef] 19. Sedaqatvand, R.; Esfahany, M.N.; Behzad, T.; Mohseni, M.; Mardanpour, M.M. Parameter estimation and characterization of a single-chamber microbial fuel cell for dairy wastewater treatment. Bioresour. Technol.
Energies 2016, 9, 79 16 of 16
20. Merkey, B.V.; Chopp, D.L. The performance of a microbial fuel cell depends strongly on anode geometry: A multidimensional modeling study. Bull. Math. Biol. 2012, 74, 834–857. [CrossRef] [PubMed]
21. Sirinutsomboon, B. Modeling of a membraneless single-chamber microbial fuel cell with molasses as an energy source. Int. J. Energy Environ. Eng. 2014, 5, 1–9. [CrossRef]
22. Oliveir, V.B.; Simões, M.; Melo, L.F.; Pinto, A.M.F.R. A 1D mathematical model for a microbial fuel cell. Energy 2013, 61, 463–471. [CrossRef]
23. Zeng, Y.; Choob, Y.F.; Kim, B.; Wu, P. Modelling and simulation of two-chamber microbial fuel cell. J. Power Sources 2010, 195, 79–89. [CrossRef]
24. Kazemi, S.; Fatih, M.M.K. Systematic study of separators in air-breathing flat-plate microbial fuel cells—Part 1: Structure, properties, and performance correlations. Energies 2016. [CrossRef]
25. Pons, L.; Délia, M.-L.; Bergel, A. Effect of surface roughness, biofilm coverage and biofilm structure on the electrochemical efficiency of microbial cathodes. Bioresour. Technol. 2011, 102, 2678–2683. [CrossRef] [PubMed]
26. Dumas, C.; Basseguy, R.; Bergel, A. Microbial electrocatalysis with geobactersulfurreducens biofilm on stainless steel cathodes. Electrochim. Acta 2008, 53, 2494–2500. [CrossRef]
27. Erable, B.; Etcheverry, L.; Bergel, A. Increased power from a two-chamber microbial fuel cell with a low-pH air-cathode compartment. Electrochem. Commun. 2009, 11, 619–622. [CrossRef]
28. Liu, J.L.; Lowy, D.A.; Baumann, R.G.; Tender, L.M. Influence of anode pretreatment on its microbial colonization. J. Appl. Microbiol. 2007, 102, 177–183. [CrossRef] [PubMed]
29. Srikanth, S.; Mohan, S.V. Change in electrogenic activity of the microbial fuel cell (MFC) with the function of biocathode microenvironment as terminal electron accepting condition: Influence on overpotentials and bio-electro kinetics. Bioresour. Technol. 2012, 119, 241–251. [CrossRef] [PubMed]
30. Ter Heijne, A.; Hamelers, H.V.M.; de Wilde, V.; Rozendal, R.A.; Buisman, C.J.N. A bipolar membrane combined with ferric iron reduction as an efficient cathode system in microbial fuel cells. Environ. Sci. Technol. 2006, 40, 5200–5205. [CrossRef] [PubMed]
31. Oh, S.; Min, B.; Logan, B.E. Cathode performance as a factor in electricity generation in microbial fuel cells. Environ. Sci. Technol. 2004, 38, 4900–4904. [CrossRef] [PubMed]
32. Zhang, X.; Cheng, S.; Huang, X.; Logan, B.E. The use of nylon and glass fiber filter separators with different pore sizes in air-cathode single-chamber microbial fuel cells. Energy Environ. Sci. 2010, 3, 659–664. [CrossRef] 33. Zhang, X.; Cheng, S.; Liang, P.; Huang, X.; Logan, B.E. Scalable air cathode microbial fuel cells using glass fiber separators, plastic mesh supporters, and graphite fiber brush anodes. Bioresour. Technol. 2011, 102, 372–375. [CrossRef] [PubMed]
34. Wang, B. Recent development of non-platinum catalysts for oxygen reduction reaction. J. Power Sources 2005, 152, 1–15. [CrossRef]
35. Wang, J.X.; Markovic, N.M.; Adzic, R.R. Kinetic analysis of oxygen reduction on Pt(111) in acid solutions: intrinsic kinetic parameters and anion adsorption effects. J. Phys. Chem. B 2004, 108, 4127–4133. [CrossRef] 36. Nørskov, J.K.; Rossmeisl, J.; Logadottir, A.; Lindqvist, L.; Kitchin, J.R.; Bligaard, T.; Jónsson, H. Origin of the overpotential for oxygen reduction at a fuel-cell cathode. J. Phys. Chem. B 2004, 108, 17886–17892. [CrossRef] 37. Kazemi, S.; Fatih, K.; Mohseni, M. Improved performance of a passive air breathing flat-plate microbial fuel
cell. Can. J. Chem. Eng. 2015, 93, 479–485. [CrossRef]
38. Harnisch, F.; Schröder, U.; Scholz, F. The suitability of monopolar and bipolar ion exchange membranes as separators for biological fuel cells. Environ. Sci. Technol. 2008, 42, 1740–1746. [CrossRef] [PubMed]
© 2016 by the authors; licensee MDPI, Basel, Switzerland. This article is an open access article distributed under the terms and conditions of the Creative Commons by Attribution (CC-BY) license (http://creativecommons.org/licenses/by/4.0/).


![Table 4. Characteristics of the separators investigated in part 1 of this work [24].](https://thumb-eu.123doks.com/thumbv2/123doknet/14082598.463730/12.892.125.771.890.1058/table-characteristics-separators-investigated-work.webp)

