Publisher’s version / Version de l'éditeur: Technical Report, 2010-10-01
READ THESE TERMS AND CONDITIONS CAREFULLY BEFORE USING THIS WEBSITE.
https://nrc-publications.canada.ca/eng/copyright
Vous avez des questions? Nous pouvons vous aider. Pour communiquer directement avec un auteur, consultez la
première page de la revue dans laquelle son article a été publié afin de trouver ses coordonnées. Si vous n’arrivez pas à les repérer, communiquez avec nous à PublicationsArchive-ArchivesPublications@nrc-cnrc.gc.ca.
Questions? Contact the NRC Publications Archive team at
PublicationsArchive-ArchivesPublications@nrc-cnrc.gc.ca. If you wish to email the authors directly, please see the first page of the publication for their contact information.
NRC Publications Archive
Archives des publications du CNRC
For the publisher’s version, please access the DOI link below./ Pour consulter la version de l’éditeur, utilisez le lien DOI ci-dessous.
https://doi.org/10.4224/17712916
Access and use of this website and the material on it are subject to the Terms and Conditions set forth at
Response of Confederation Bridge to ice forces : Winter 2008-2010
Li, Lian-Feng; Frederking, Robert; Kubat, Ivana
https://publications-cnrc.canada.ca/fra/droits
L’accès à ce site Web et l’utilisation de son contenu sont assujettis aux conditions présentées dans le site LISEZ CES CONDITIONS ATTENTIVEMENT AVANT D’UTILISER CE SITE WEB.
NRC Publications Record / Notice d'Archives des publications de CNRC: https://nrc-publications.canada.ca/eng/view/object/?id=57641e5e-682b-4aa6-92fc-eaddeb51ca8d https://publications-cnrc.canada.ca/fra/voir/objet/?id=57641e5e-682b-4aa6-92fc-eaddeb51ca8d
RESPONSE OF CONFEDERATION BRIDGE TO ICE
FORCES: WINTER 2008-2010
Lian-Feng Li*, Robert Frederking and Ivana Kubat
* Work-term Student, Memorial University of Newfoundland
TECHNICAL REPORT
CHC-TR-075
RESPONSE OF CONFEDERATION BRIDGE TO ICE
FORCES: WINTER 2008-2010
Lian-Feng Li, Robert Frederking and Ivana Kubat
Canadian Hydraulics Centre
National Research Council of Canada
Ottawa, ON K1A 0R6
Canada
Technical Report
CHC-TR-075
CHC-TR-075 i
Abstract
Ice interactions with the Confederation Bridge for the winters 2008, 2009 and 2010 have been studied. Tilt data from piers P23 and P24 in response to ice and wind actions were recorded by a data acquisition system. Video records of ice interactions with pier P23 and overall ice conditions adjacent to piers P23 and P24 allowed ice conditions and interaction processes to be related to tilt measurements. Wind data were also analysed to correct for the tilt caused by wind actions on the bridge. An ice loading scenario of slow build up of ice force on a pier due to the action of current and wind on a large ice floe was identified. In one instance this resulted in a maximum force of about 4 MN being generated on simultaneously on each of piers P23 and P24.
CHC-TR-075 iii
Table of Contents
Abstract ...i
Table of Contents... iii
Table of Figures ... iii
List of Tables... iii
1. Introduction...1 1.1 Bridge Description ... 1 1.2 Tiltmeter ... 2 2. Analyzed Data ...3 2.1 Tilt Data ... 3 2.2 Wind Data... 4 2.3 Video Record... 5 2.4 Ice Chart ... 7 3. Data Analysis...9 3.1 Baseline Definition... 9
3.2 Ice Event Identification ... 9
3.3 Analysis Method and Example ... 12
3.4 Discussion of Results ... 14 4. Summary ...15 5. Acknowledgements ...16 6. References...23 Appendix A ...24
Table of Figures
Figure 1: Cross section of the Confederation Bridge ...1Figure 2: Profile of the Confederation Bridge ...2
Figure 3: The bridge piers (L) and P23’s inner cross section (R) ...3
Figure 4: Top view of the bridge ...3
Figure 5: Ice observation from traffic camera...6
Figure 6: Ice observation from pier camera...6
Figure 7: Historical data of weekly ice coverage in Gulf of St. Lawrence...7
Figure 8: Analyzed Ice chart on March 12th, 2009 ...8
Figure 9: Daily averaged tilt data at lower level of P23, 2008 ...9
Figure 10: Wind-ice plot for upper tiltmeter, April 7, 2009 ...10
Figure 11: Wind-ice plot for lower tiltmeter, April 7, 2009...11
Figure 12: Ice event in wind-ice plot in 2009, March 5 ...12
Figure 13: Maximum ice force on P23 in 2009, March 5 ...13
Figure 14: Maximum ice force on P24 in 2009, March 5 ...14
Figure 15: P23 ice event from 6 AM to 8 PM...14
Figure 16: Pier camera observation at 08:35:12...15
List of Tables
Table 1 Calculation of March 5, 2009 maximum ice forces...13CHC-TR-075 1
RESPONSE OF CONFEDERATION BRIDGE TO ICE
FORCES: WINTER 2008-2010
1. Introduction
In order to evaluate the ice impact force acting on offshore structures, two piers of the Confederation Bridge were selected as a test bed for the study of ice interactions. The Confederation Bridge is located in Northumberland Strait. The Strait is usually covered by a large amount of ice in winter, and the ice is continuously drifting back and forth impacting the bridge piers with the result that large ice forces are generated on the piers. Each pier was designed to sustain 30 MN maximum ice impact force, which provides a high safety factor for the bridge. In 1999, National Research Council Canada – Canadian Hydraulics Centre (NRC-CHC) installed tiltmeters in two bridge piers for measuring the force of ice interaction. The measured tilt can be interpreted as an applied force based on the structure response; therefore, an indirect system of determining ice iteration forces was established. The wind force acting on the bridge cannot be neglected, so wind data is required for analyzing any ice event where large wind forces are included. In addition to the analyzed digital data, video recordings were used for observing ice failure behaviour during an ice event. A traffic observation camera on the bridge recorded the behaviour of floating ice in a large field of view, and a time lapse video camera installed under the bridge monitored the area around the pier with tiltmeters installed. The information of ice coverage in the Strait was used to assist and identify ice events. The event data was analyzed by using MATLAB. The data analyzed for this report was from measurements in the winters of 2008, 2009 and 2010.
1.1 Bridge Description
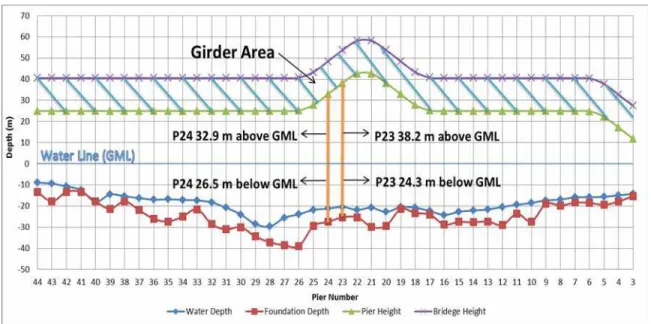
The Confederation Bridge has a length of 12.9 km, and connects the New Brunswick (NB) and the Prince Edward Island (P.E.I). The main section of the bridge is 11km long which contains 44 piers. These piers are numbered from the P.E.I side, as shown in a cross section view of the bridge (Figure 1). Located in the middle of the bridge, a navigation span between the 20th and 21st piers (P21/P22) provides a channel with 60 m height above the water line for ship traffic.
Figure 1: Cross section of the Confederation Bridge
In Figure 2, the water line (GML) is defined as the 0 axis. The green line is the height of pier shaft above the water line, and the purple line is the bridge deck height, which is the sum of the pier’s height and girder’s depth. The red line is the foundation depth blow the water line, and the blue line represents the water depth. Beside the navigation channel,
2 CHC-TR-075
the 23rd and 24th piers (P23/P24), which are indicated as two orange lines in Figure 2, were selected as the research object for the project of the response of the Confederation Bridge to ice forces. This project is aimed to study the behaviour of the ice interaction at the navigation span. Large ice floes drifting downstream could accumulate and block the navigation channel. The analyzed ice forces acting on the bridge piers can provide information of ice loading on structures during their operation. However, the instrument could not be installed in P21 and P22 because they were filled with concrete to help the bridge withstand a collision with a ship, so the adjacent piers were chosen as the research object. The heights of P23/P24 are marked in Figure 2; the P23’s foundation stiffness is about twice the stiffness of the foundation of P24.
Figure 2: Profile of the Confederation Bridge
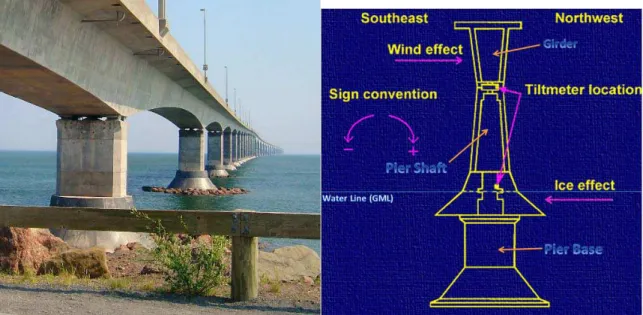
1.2 Tiltmeter
Each pier contains two tiltmeters inside its shaft. The locations and sign convention of two tiltmeters are indicated in Figure 3, and both of them are located at the side of water moving from upstream to downstream (Northwest to Southeast). The tiltmeter has an extremely sensitive resolution of 0.1 µrad and a wide range of 7500 µrad in both clockwise and counter clockwise directions. The tiltmeters are connected to a data logger installed inside each pier for storing the measurements. Using an analysis method mentioned by Brown (2006), the tiltmeter measurements are converted to applied force. The data from a tiltmeter is recorded as a voltage signal, which is converted into micro-radian (µrad) by using a calibration factor supplied by the manufacturer.
CHC-TR-075 3
Figure 3: The bridge piers (L) and P23’s inner cross section (R)
2. Analyzed Data
2.1 Tilt Data
NRC-CHC has been measuring and analysing data from the tiltmeters since 1999. The tiltmeter is able to measure biaxial inclination angles, and the coordinate system defines tilt about the longitudinal axis of the bridge as the x-axis and tilt about a horizontal axis of right angle to the bridge as they-axis. The coordinate system is also indicated in Figure 4. Since the predominant ice drift direction is from upstream (NW) towards the bridge, the majority of ice impact forces causes the pier to tilt about the y-axis. Consequently, the data from y-axis is used to calculate the ice load.
4 CHC-TR-075
The tiltmeter in 2008 recorded the pier tilt angle relative to the y-axis at one-second intervals, and also measured the temperature and the angle relative to the x-axis every three hours. In 2009 and 2010, the data logger was upgraded and able to record both y-axis data and x-y-axis data with a frequency of 5 Hz. Although the instrument is able to record the data at a high frequency, the pier needs one second to respond to an applied load. Due to this, the recorded data was averaged at 2-second intervals.
The y-axis data from the three years was extracted and rearranged in the same format. The data were tabulated with a specific time for each reading. The recorded time on the logger was Coordinated Universal Time (UTC), and it was converted into local standard time (LST) by subtracting four hours. The tiltmeter measures the response of all the forces acting on the structure. In addition to ice impact, the wind, traffic, and water current can generate forces on the bridge as well. Based on previous work, Frederking et all (2007) state that the wind creates relatively significant force on the bridge
The bridge girder is 14 m deep at the piers, which provides a large exposure area for wind force to act on. The wind force produces a moment on the bridge pier, and the pier bends in a similar manner to bending of a cantilever beam with an elastic root. The foundation of the pier will rotate in a small amount and the girder area on the top of the pier shaft will have the largest inclination angle. The inclination angle decreases from top to bottom, due to bending of the pier shaft. Thus, comparing to the tiltmeter installed at the lower level of the bridge pier (lower tiltmeter), the pier’s tiltmeter at upper level (upper tiltmeter) has a relative larger angle when wind is acting on the bridge.
The lower tiltmeter is closer to the elevation of ice action, and ice is responsible for a proportionally larger part of the tilt change under the combined actions of ice and wind. If ice impact was the only force acting on the bridge pier; the tilt angle change for both upper and lower tiltmeters would be the same. On the other hand, high wind acting to the bridge girder will affect the measured angle at both levels, an have a larger effect on at the upper level.. The tilt angle is added to if the wind has the same direction as the ice drift, and vice versa.
In order to account for the wind effect during analysis of an ice event, the portion of the tilt angle at lower tiltmeter due to wind can be corrected for by using moment equilibrium. The wind force acting on the girder produces a moment at the pier’s base, which can be translated to a tilt at the lower tiltmeter proportional to the foundation depth. Since the dimensions of the bridge are given, measurements from lower tiltmeter can be corrected to remove wind force affects. Thus, data from upper tiltmeter is used to determine the wind effect, and the lower tiltmeter result can be used to determine ice force by correcting for wind force.
2.2 Wind Data
The wind effect is the lateral force caused by wind acting on the bridge girder and deck. The wind force is related to the wind speed normal to the bridge. The wind speed and its direction are measured by anemometers at various locations. Since P23 and P24 had no instrument to measure the wind, the wind data were obtained from anemometers, which were installed at other locations on the bridge.
Anemometers are installed at the navigation span and at the middle of P31 and P32. In some years, two gauges have been installed at each location in order to verify wind
CHC-TR-075 5
data. The data obtained from both locations were provided by the University of Calgary. The wind speed is recorded as a positive value, and measured wind direction varies from 0 to 360 degrees. Wind blowing to north-east, which is the direction perpendicular to the longitudinal bridge axis, is set as 0.
Piers P23 andP24 are adjacent to the navigation channel so that the navigation span wind data should be more reliable than the data from P31/P32. The anemometers installed at P31/P32 recorded data every second and also every 10 minutes, but the navigation span wind data could only be recorded at long time intervals. As a result, the navigation span data is used to analyze the overall wind effect, and the P31/P32 wind data is used for detailed wind analysis. When the navigation span wind data is not reliable, the P31/P32 wind data with the large time interval can be used to replace the navigation span wind data.
In 2008, because of the instrument’s limitation, the anemometer at the navigation span recorded the wind direction only in cardinal directions. The measured direction is less precise than measurements in azimuth degree because the wind in cardinal direction is only recorded in four ordinal directions and twelve further divisions, such as N, NW and NNW. The wind direction was thus only recorded in 22.5 degree increments. Moreover, the P31/P32 wind data has many missing data. If an ice event occurred during a time period without detailed wind data, wind data with a large time interval had to be used to analyze the wind effect, which will provide an unreliable result. The navigation span wind data was not obtained in 2009, so the P31/P32 10 minutes time interval’s wind data was used to analyze the overall wind effect. Unfortunately, one wind measuring instrument at P31/P32 was damaged due to freezing rain in 2010; hence, data from the other P31/P32 instrument was used to analyze the wind effect. The 17 seconds time interval wind data in 2010 is provided instead of one second time interval wind data at P31/P32, so the detailed analysis of the wind effect will be less reliable.
The data of wind speeds and wind directions is rearranged to the same format as the tilt data. The wind data was recorded in local time, and the time frame is almost the same as the tilt data except the P31/P32’s anemometer has one extra hour of wind data after switching to daylight saving day. The time change is always at 2 AM on daylight saving day, and the one extra hour’s wind data may be recorded from 2 AM to 3 AM. Rather than adding one hour of tilt data, it is preferred to delete one hour of wind data from 2 AM to 3 AM on daylight saving day. Fortunately, most ice events happened before changing the time, so the time change will not affect the analysis results. The tilt data and wind data both have the same time frame in local standard time (LST) which will match with the recorded video time.
2.3 Video Record
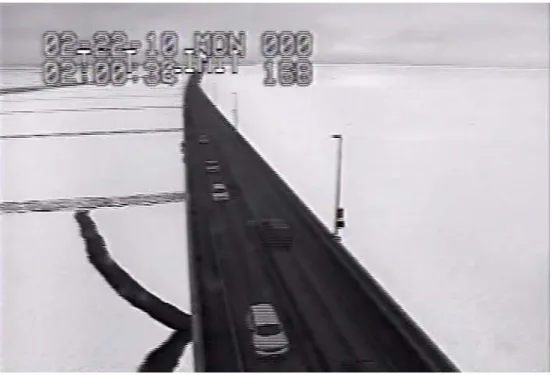
For the purpose of observing the ice conditions and the ice behaviour during ice impact on the bridge piers, two kinds of video data are provided from the camera monitoring system. The first one is recorded from a camera installed on the top of a light standard on the bridge deck. The main function of this camera to monitor the traffic on the bridge, however it also gives a large field of view of the ice conditions around the bridge, as shown in Figure 5. The traffic camera providing a daily record with one frame every three seconds, but the time in the video is not correct. The time in traffic camera’s video data was corrected by adding ten hours to match the LST by comparison with images from the pier video camera.
6 CHC-TR-075
Figure 5: Ice observation from traffic camera
The other kind of video data is recorded from a video camera installed between P22 and P23, and its view is directed downwards to P23. Figure 6 is an example of this video record. It provides a more detailed picture of ice failure on the pier. The pier video is only recorded from 6 AM to 8 PM in LST (daylight hours), and the taped information is at a rate of four frames per second. As a result, the pier video provides more detailed information of ice behaviour during an ice event.
CHC-TR-075 7
The video data from the pier camera was recorded on a hard drive and the traffic camera on VHS tapes. The hard drive video was converting onto DVDs, as were the VHS tapes. The video information from the DVDs was used to check ice failure mode, weather, ice concentration and ice drift direction, to assist the data analysis.
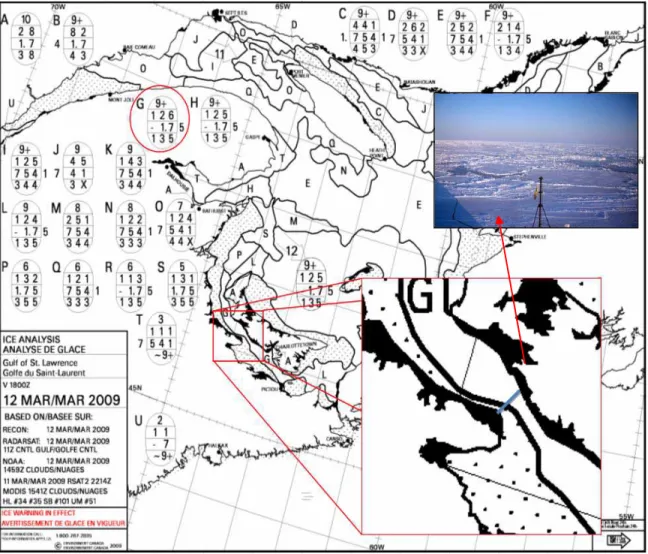
2.4 Ice Chart
Climate data from Environment Canada is used to provide the information of daily air temperature and weather. The climate data are recorded every hour in local standard time, and the selected location was Summerside in P.E.I., the closest location to the Confederation Bridge, for which such data are available.
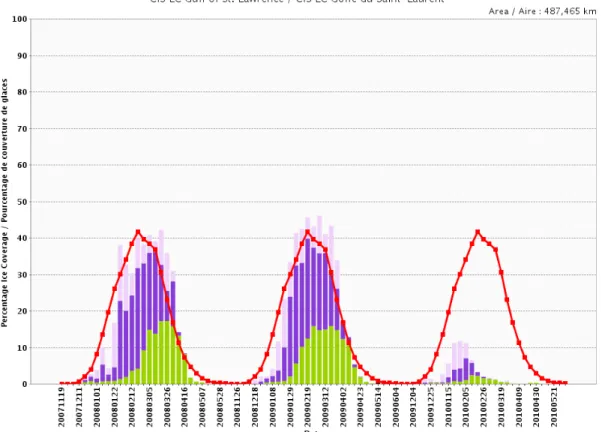
The Canadian Ice Service of Environment Canada provides the historical data of ice coverage in the Gulf of St. Lawrence which is plotted in Figure 7. The histograms in the plot represent the last three years’ weekly ice coverage, and the red line is the average of the last 40 year’s weekly ice coverage before 2008. The pink histogram bars represent the New Ice which has a thickness less than 10 cm. The purple bars are the Young Ice with the thickness of 10 cm to 30 cm, and green bars are the 30 cm to 70 cm thick First-Year Ice. It is obvious that the ice coverage in 2010 is the lowest either comparing to the data from 2008 and 2009 or average data since 1969. Therefore, the number of the ice events and the magnitude of the ice forces in 2010 would be expected to be less than those in 2008 and 2009.
8 CHC-TR-075
The Canadian Ice Service (CIS) also provides daily ice charts that record the ice concentration, the ice thickness and the floe size of the ice cover in the Gulf of St. Lawrence. Figure 8 shows an ice chart observed on the date of March 12th, 2009. The blue line in the zoomed image is the Confederation Bridge, and the dotted area in the Northumberland Strait represents an area with no ice coverage. The ice conditions near the bridge are described in the area noted as “G”, and the egg code of this area is marked in Figure 8. According to the Ice Product Guide (MANICE, 2005) from CIS, the number from the first row in egg code is the total concentration and the second row numbers are partial concentration. The numbers in third row record the stage of development (ice thickness) and the fourth row gives the ice floe size. For this project, the numbers from first three rows are used to identify an approximate ice thickness near the bridge. The total ice concentration in egg code G in Figure 8 is 9+ tenths, which can be viewed in the example picture on the top of the zoomed image. The highest possible ice concentration is 10 tenths so the G area has very close pack ice. The indicated partial ice concentration is 1/10 brash ice, 2/10 medium first-year ice (70-120 cm thick) and 6/10 thin first-year ice (30-70 cm thick), and grey-white ice (15-30 cm thick) present with a concentration of less than 1/10.
CHC-TR-075 9
3. Data Analysis
3.1 Baseline Definition
Establishing the baseline is a challenge since the tiltmeter is sensitive to various environmental inputs. Air temperature or solar radiation contribute to short and long-term variability of the baseline. As shown in Figure 9, the daily averaged data from the lower tiltmeter in 2008 shows a progressive increase as time proceeds. Because the tilt generally increases linearly, a regression line can be used to define the baseline. The equation of the regression line has an input of a Julian day (x) and an offset value (y) for each day. After the data are processed by subtracting the offset value, a rough corrected data set can be used for subsequent analysis of ice events. The corrected data almost always varies in a same range; ±300 μrad for the upper tiltmeter and ; ±150 μrad for the lower one. Having made the general baseline correction, an accurate baseline for particular ice events is defined by selecting the nearest time when there is no ice and little wind affect.
Figure 9: Daily averaged tilt data at lower level of P23, 2008
3.2 Ice Event Identification
In terms of the provided wind data, 2008 is limited, and the amount of ice coverage in 2010 is apparently less than the other two years. The wind data from 2009 provides a complete time series without any missed data. The ice coverage in 2009 is similar to the past several years, and some significant ice events in 2009 happen in daytime so that a number of ice events were captured by the pier camera. To illustrate, a particular ice event in 2009 is analyzed in detail in this report.
10 CHC-TR-075
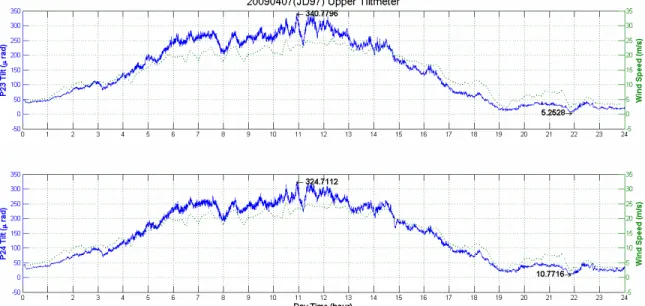
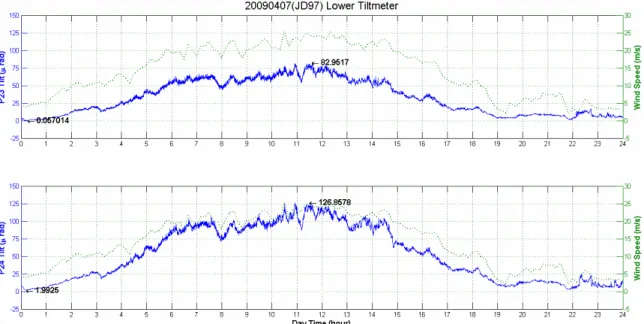
After the tilt data is offset with respect to the long-term baseline, the data were averaged every 15 s. Because the amount of raw data is extraordinarily large, a computer with adequate memory is needed. MATLAB is used to plot daily averaged data and create a graph with two y-axes. The y-axis on the left side represents the tilt data and the one on the right indicates the wind speed component normal to the bridge. The wind speed with a longer time interval is selected in order to create a smoothed graph. Plots of the tilt and wind data are made for each day, defined as daily wind-ice plots (see Appendix A). To determine the tilt due to wind alone, a day in spring when no ice was present, April 7, 2009, as verified from video records, was selected A daily wind-ice plot on that day is shown in Figures 10 and 11. The x-axis is time, and the blue line indicates the tilt data while the green line is the wind speed. The maximum and minimum tilt values are indicated in the plot, and the shape of plotted tilt data, especially in the data from upper tiltmeter, is similar to the wind data. The lower tiltmeter has less wind effect relative to the upper one, so the plot of lower tiltmeter is used to determine wind correction in the ice force analysis.
CHC-TR-075 11
Figure 11: Wind-ice plot for lower tiltmeter, April 7, 2009
An ice event often occurs with a large wind force present. The wind force can persist for a long time while an ice force acting on the pier may only last for a few minutes. The resistance of a bridge pier is much greater than the breaking force of an ice floe, so drifting ice may fail when it hits the pier. The impact happens in a short time, and a peak tilt with a short period will be created in the wind-ice plot. Due to the upper tiltmeter having a larger wind response, the peak caused by the ice in the upper wind-ice plot will be difficult to find. As a result, the daily wind-ice plot for lower tiltmeter is used to search for an ice event which has a short time peak different from the shape of a wind curve. The largest ice caused peak tilt was found on March 5th, 2009, and its wind-ice plot for the lower tiltmeter is shown in Figure 12. The plotted data is all negative because both ice and wind come from NW which is indicated in the sign convention in Figure 3. The maximum ice force occurred around 8:30 in the morning and the pier camera taped most of the event since 6 AM. The ice chart from that day indicates that the ice coverage near the bridge was 2/10 of 70-120 cm thickness and 5/10 of 30-70 cm thickness, which is able to create a significant ice impact force.
12 CHC-TR-075
Figure 12: Ice event in wind-ice plot in 2009, March 5
All ice events identified in 2008, 2009 and 2010 are tabulated in Table 2. The ice event
may occur at an individual pier, so the event duration and pier number are recorded with an approximate tilt angle. The ice drift direction, video record, approximate wind speed and its direction relative to the bridge are also listed in the Table. Due to the limited wind data in 2008, the Table in 2008 has one extra column to record the provided wind data. If the provided data has the required information, it will be marked as a “+” in the table; otherwise it will be recorded as “–“. In 2009 and 2010 wind data was obtained from the instruments at P31/P32. As mentioned before, winter in 2010 has the lowest ice coverage in the Strait so that the number of ice events should be less than the other two years’. The maximum tilt angle in each year is analyzed detail to calculate the magnitude of ice force.
3.3 Analysis Method and Example
The following procedure is used to analyse a particular ice event identified from a daily wind-ice plot. Two-second averaged tilt data is prepared, in line with the instrument’s response time. The wind data with one second time interval is averaged to two-second intervals to match the tilt data. The wind force acting on the bridge girder tends to overwhelm the ice force, so the first step of calculating ice force is to eliminate the wind effect. According to Kubat and Frederking (2001), the wind affected tilt angle (Tw) is
proportional to the square of wind velocity normal to the bridge axis (Vw). Equation (1),
shown below, with the coefficient c = 0.19 for P23 and 0.30 for P24, and the unit of c,
µrad / (m/s)2 can be used to calculate the tilt due to wind at the level of the lower tiltmeter.
Tw = c * Vw2 (1)
The wind affected tilt angle correction of the lower tilt depends on the ice drift direction and the wind direction. If the directions are the same, the corrected angle can be
CHC-TR-075 13
calculated by subtracting the wind affected angle from the measured angle. If not, the corrected angle will equal to the sum of the measured tilt and wind affected tilt angle. The corrected tilt, θlower, can be calculated from the measured tilt, θMEAS, and the wind tilt
correction, Tw. .
θlower = θMEAS - Tw (2)
The ice force, Fice, is calculated from the corrected tilt at the lower tiltmeter
Fice = b * θlower (3)
where the coefficient b has a value of 0.04 for P23 and 0.02 for P24, with units of
MN/µrad.
The March 5, 2009 event will be used to illustrate the calculation method. Figure 12 shows that the total tilt, θMEAS, at 08:35 was 102 µrad for P23 and 232 µrad for P24. The
calculation of the peak force is presented in Table 1.
Table 1 Calculation of March 5, 2009 maximum ice forces
Pier # θMEAS, µrad Coef c Vw, m/s Tw, µrad θlower = Coef b Fice, N
P23 102 0.19 8 12.2 89.8 0.04 3.6
P24 232 0.30 8 19.2 212.8 0.02 4.3
The calculated ice force for the whole event from 6 AM to 11 AM March 5th, 2009 is shown in Figure 13 and Figure 14. The result with negative values indicates that the ice force is acting from NW to SE.
14 CHC-TR-075
Figure 14: Maximum ice force on P24 in 2009, March 5
3.4 Discussion of Results
The pier video record is used to identify the ice behaviour during an ice event associated with the wind-ice plot. As shown in Figure 15, the wind-ice plot for the P23 lower tiltmeter is limited to day-light hours (0600 to 2000). The tilt angle increases to a peak value and then drops suddenly at 8:35:12 AM. Following the drop, fluctuating tilts occur until 16:00, but they are of much lower magnitude. As observed from video data, the ice was stationary from 06:00 until the time the peak load occurred. The observed ice condition from the P23 video recording just a few seconds after the ice started to move is shown in Figure 16. Note the narrow margin of open water to the left of the pier. After the peak event happened, the ice continues moving to the northwest until about 16:30, when movement stopped.
CHC-TR-075 15
Figure 16: Pier camera observation at 08:35:12
The loading scenario seems to be one of the ice force on the pier slowly building up, probably under the action of current and wind on a large extent of ice, until it exceeded the strength of the ice cover and it failed against the pier. A similar loading signature was generated on both P23 and P24, so it is likely a large ice floe was located to the northwest of the bridge. It is possible that the rubble accumulation visible in Figure 16 was frozen to the pier and able to smoothly transfer force from the ice floe to the pier. No direct measurements of current are available, but it has generally been observed that the current runs to the southeast in the mornings. The video showed the ice continued to move to the southeast, probably primarily under the action of the wind which reached speeds of 15 m/s, but generating much lower loads. This type of loading scenario was noted several times during the three winters of data analysed, but were of much smaller magnitude. Normally loading events reflect a shorter term loading cycle, lasting a few minutes up to 10 minutes, and representing more of an impact of a thick ice feature or a ridge on a pier.
4. Summary
The tiltmeters have operated 12 winters since 1999 and produced reliable tilt data from the two bridge piers, P23 and P23, adjacent the navigation span. In this report, data from 2008-2010 were analyzed. The data include the measurement of pier tilt response to ice and wind forces. For the purpose of removing the wind effect, the wind data is analysed to calculate a correction to the ice force. Both wind data and tilt data are adjusted to local standard time (LST) for matching with the time on video recording. The video records provide information on ice condition in the vicinity P23 and P24, and ice failure behaviour around the P23. Daily ice charts provide information on ice thickness and concentration in the vicinity of the bridge. The wind data and ice data are averaged every 15 seconds for creating daily wind-ice plot. By comparing the tilt and wind plots, ice events can be
16 CHC-TR-075
identified and events with larger peak angle caused by ice interaction selected for calculation of ice forces. Over the three winters, 2008, 2009 and 2010, the largest force occurred on March 5, 2009 and was about 4 MN simultaneously on both P23 and P24. This maximum force was associated with a slow build-up of force on piers P23 and P24, followed by a rapid drop.
5. Acknowledgements
The funding support of the Program on Energy Research and Development (PERD) through the Offshore Environmental Factors Program is gratefully acknowledged. The assistance of Simon Prinsenberg, Murray Scotney and Helen Hayden at the Bedford Institute of Oceanography in setting up instrumentation and recovering data is appreciated.
CHC-TR-075 17
Table 2 Ice Event Recording
Year Month Date Event
Pier Event Time (1 - 24 hours) Lower Tilt (Mu Rad) Ice Drifting From Wind Speed (m/s) Wind Driection From Pier Camera Record Traffic Camera Record Wind Data Record 2008 Jan 19 24 14 - 15 < 20 T => NW => T 0 - 5 NW + - + 2008 Jan 25 23, 24 14 - 16 25 SE => T 0 - 5 NW + + + 2008 Jan 26 24 1 - 2 25 SE 0 - 5 NW - + + 2008 Jan 26 23, 24 20 - 22.5 < 25 NW 0 - - + + 2008 Jan 28 23, 24 3.5 - 8 20 - 25 SE 0 - 5 SE + + + 2008 Jan 28 24 10 - 11 50 NW 0 - 5 NW + + + 2008 Jan 30 23, 24 1 - 3 20 - 25 NW 0 - - + + 2008 Jan 31 23, 24 5 - 8 25 - 40 SE 5 - 15 NW - + + 2008 Feb 2 23, 24 7 - 8 30 - 40 SE 15 SE + + + 2008 Feb 3 24 22 - 24 20 - 30 SE 0 - 5 NW - + + 2008 Feb 4 24 0 - 2 45 T => NW 0 - 5 NW - + - 2008 Feb 4 23, 24 15 - 19 20 - 25 NW 0 - 10 NW + + - 2008 Feb 4 24 21.5 - 24 60 SE 0 - 5 NW - + - 2008 Feb 5 24 0 - 3 50 T => NW 0 - 5 NW - + + 2008 Feb 5 23, 24 21 - 24 15 - 25 SE 5 - 10 SE - + + 2008 Feb 7 24 1 - 3 20 - 25 SE 5 - 10 NW - + + 2008 Feb 8 23, 24 6.5 - 10 10 - 25 NW 0 - 5 NW + + + 2008 Feb 8 24 12 - 14 15 - 25 SE 0 - 5 NW + + + 2008 Feb 9 24 0 - 1 <20 SE 0 - - + - 2008 Feb 10 23, 24 4 - 5 <25 SE 5 - 10 SE - + - 2008 Feb 10 23, 24 14 -18 20 - 40 SE 5 - 10 SE + + - 2008 Feb 12 24 18 - 19.5 25 SE 5 - 10 NW + + - 2008 Feb 14 24 18 - 20 30 - 40 SE 5 - 15 NW + + + 2008 Feb 15 24 10.5 - 15 20 - 50 NW 0 - 15 SE + + + 2008 Feb 15 24 17 - 19 25 - 50 SE 0 - 10 SE + + + 2008 Feb 17 23, 24 3 - 7 100 NW => T 0 - 5 NW - + + 2008 Feb 17 23, 24 13 - 17.5 10 - 25 NW 0 - 10 SE + + +
18 CHC-TR-075
Table 2 Ice Event Recording
Year Month Date Event
Pier Event Time (1 - 24 hours) Lower Tilt (Mu Rad) Ice Drifting From Wind Speed (m/s) Wind Driection From Pier Camera Record Traffic Camera Record Wind Data Record 2008 Feb 18 24 6 - 9.5 25 - 30 SE 10 - 15 SE + - + 2008 Feb 19 24 19 - 20 40 NW 0 - + - + 2008 Feb 20 24 7 - 10 25 - 50 NW 5 - 10 NW + - + 2008 Feb 21 23, 24 18 - 23 50 - 55 NW 5 - 10 NW + - + 2008 Feb 22 24 0 - 3 25 - 40 - 5 - 10 NW - - - 2008 Feb 22 23, 24 7 - 11 30 - 40 NW 0 - 10 NW + - - 2008 Feb 24 24, 24 21 - 24 <25 - 0 - - - + 2008 Feb 25 24 11 - 12 20 NW 0 - + - + 2008 Feb 28 24 0 - 1 25 - 0 - 5 NW - - + 2008 Feb 28 23, 24 2 - 3 15 - 25 - 0 - 5 NW - - + 2008 Feb 28 23, 24 9 - 14.5 20 - 30 T => NW 0 - 10 NW + - + 2008 Feb 28 24 17 - 18 30 SE 0 - 5 NW + - + 2008 Feb 29 24 0 - 3 20 - 35 - 0 - 5 NW - - - 2008 Feb 29 23, 24 9 - 15 25 - 50 T => NW 0 - 5 NW + - - 2008 Mar 8 24 14 - 15 20 SE 5 - 10 NW + - + 2008 Mar 10 24 16 - 18 30 SE => T => NW 0 - 5 NW + - + 2008 Mar 14 24 4 - 7 25 - 45 SE => T => NW 0 - 5 NW - + - 2008 Mar 14 24 11 - 15 25 - 30 NW 0 - 5 NW + + - 2008 Mar 15 24 6 - 7 20 SE 0 - 5 NW + + - 2008 Mar 21 23, 24 3 - 4 20 NW 0 - 5 NW - + + 2008 Mar 22 23, 24 9 - 10 20 - 30 NW => T 0 - 5 NW + + + 2008 Mar 22 23, 24 19 - 23 20 - 25 NW 5 NW - + + 2008 Mar 23 23, 24 0 - 1 20 SE 5 NW - + + 2008 Mar 23 23, 24 6 - 12 30 - 55 NW 5 NW + + + 2008 Mar 26 24 18 - 19 40 SE 5 SE + + + 2008 Mar 30 23, 24 8.5 - 14 20 SE => T => NW 5 - 10 NW - + +
CHC-TR-075 19
Table 2 Ice Event Recording
Year Month Date Event
Pier Event Time (1 - 24 hours) Lower Tilt (Mu Rad) Ice Drifting From Wind Speed (m/s) Wind Driection From Pier Camera Record Traffic Camera Record Wind Data Record 2008 Mar 30 24 14.5 - 16.5 80 NW => T => SE 0 - 10 NW - + + 2009 Jan 17 23, 24 1 - 2 <25 - 5 NW - - 2009 Jan 17 23, 24 22 - 23.5 <20 - 0 - 5 NW - - 2009 Jan 18 24 12 - 13 <20 SE 5 NW + - 2009 Jan 20 24 1.5 - 4 <25 - 0 - 5 NW - - 2009 Jan 20 24 13.5 - 16.5 25 NW 5 NW + - 2009 Jan 22 23, 24 14 - 18 <20 NW 5 NW + - 2009 Jan 27 23, 24 7 - 8 <20 NW 5 - 10 NW + + 2009 Jan 29 24 14 - 20 30 - 50 NW 5 - 10 NW + + 2009 Jan 30 24 1 - 5.5 25 - 50 SE 5 NW - + 2009 Jan 30 23 10.5 - 11.5 25 - 30 SE 5 NW + + 2009 Jan 30 24 14 - 15 25 SE 0 - 5 NW + + 2009 Jan 31 24 15 - 19 < 25 SE 5 - 10 SE + + 2009 Feb 1 24 10 - 13 25 - 30 NW 5 -10 NW + + 2009 Feb 2 23, 24 3.5 - 7.5 < 25 SE 0 - - + 2009 Feb 2 23, 24 10 - 14 < 20 NW 0 - + + 2009 Feb 2 23, 24 15 - 20 < 20 SE 0 - 5 SE + + 2009 Feb 3 24 14 - 15 25 NW 5 NW + + 2009 Feb 4 24 4 - 6 50 NW 10 - 15 NW - + 2009 Feb 4 24 7 - 10.5 130 T 5 - 15 NW + + 2009 Feb 4 24 18.5 - 22 50 SE 0 - 5 NW - + 2009 Feb 5 23, 24 10.5 - 14.5 < 25 NW 5 - 10 NW + + 2009 Feb 6 23, 24 3 - 5 < 25 NW 5 NW - + 2009 Feb 6 23, 24 13.5 - 18.5 25 NW 0 - 5 NW + + 2009 Feb 7 24 2.5 - 7 < 25 NW 5 - 10 NW - + 2009 Feb 7 24 9 -12 20 - 30 SE 0 - 5 NW + + 2009 Feb 7 23, 24 15 - 18.5 < 25 NW 0 - + + 2009 Feb 7 23, 24 20 - 24 < 25 SE 5 SE - +
20 CHC-TR-075
Table 2 Ice Event Recording
Year Month Date Event
Pier Event Time (1 - 24 hours) Lower Tilt (Mu Rad) Ice Drifting From Wind Speed (m/s) Wind Driection From Pier Camera Record Traffic Camera Record Wind Data Record 2009 Feb 8 24 12 - 13 25 - 30 SE 0 - + + 2009 Feb 10 24 14 - 15 <20 SE 5 NW + + 2009 Feb 11 23, 24 9 - 11 <20 NW 0 - 5 SE + + 2009 Feb 12 24, 24 15 - 18 ~25 SE 0 - 5 SE + + 2009 Feb 22 23, 24 22.5 - 23.5 <20 SE 5 - 10 SE - + 2009 Feb 24 24 13 - 16 50 NW 10 - 15 NW + + 2009 Feb 25 23, 24 4 - 7 20 - 30 NW 5 -10 NW - + 2009 Feb 25 24 19 - 22 25 - 30 NW 0 - - + 2009 Mar 3 23, 24 8.5 - 14.5 25 - 50 NW 5 NW + + 2009 Mar 3 24 16 - 18 50 SE 0 - 5 NW + + 2009 Mar 3 23, 24 18 - 19 25 SE 0 - 5 NW + + 2009 Mar 4 23, 24 8.5 - 13.5 25 NW 5 NW + + 2009 Mar 5 23 1 - 3 40 NW 0 - 5 NW - + 2009 Mar 5 24 3 - 5.5 50 NW 0 - 5 NW - + 2009 Mar 5 23, 24 5.5 - 16 150 - 250 T -> NW 5 - 15 NW + + 2009 Mar 6 24 19 - 20 50 SE 10 SE + + 2009 Mar 7 24 20 - 21 25 SE 5 NW - + 2009 Mar 9 23, 24 15.5 - 20 20 -30 NW 0 - 5 NW + + 2009 Mar 14 24 22 - 23 < 20 NW 0 - - + 2009 Mar 20 24 7 - 9 50 NW 5 - 10 NW + + 2009 Mar 20 24 12.5 - 15.5 25 NW 0 - 5 NW + + 2009 Mar 21 23, 24 14 - 17 20 - 30 NW 0 - 5 NW + + 2009 Mar 23 24 5 - 6 40 NW 5 - 10 NW - + 2009 Mar 23 23, 24 7 - 8 25 - 30 NW 5 NW + + 2009 Mar 23 23, 24 13 - 19 25 - 40 NW 5 NW + + 2009 Mar 24 23, 24 4 - 8 35 - 50 NW 0 - 5 NW - + 2009 Mar 24 24 11 - 12 20 - 25 SE 0 - 5 NW + LESS ICE + 2009 Mar 24 23, 24 16 - 19 25 - 75 NW 0 - 10 NW + +
CHC-TR-075 21
Table 2 Ice Event Recording
Year Month Date Event
Pier Event Time (1 - 24 hours) Lower Tilt (Mu Rad) Ice Drifting From Wind Speed (m/s) Wind Driection From Pier Camera Record Traffic Camera Record Wind Data Record 2010 Jan 27 23, 24 12 - 14 20 - 25 T => NW 10 - 15 NW + - 2010 Feb 11 24 15 - 18 30 - 40 NO ICE => NW 10 - 15 NW + + 2010 Feb 11 24 20 - 21 40 T 10 - 15 NW - + 2010 Feb 12 23, 24 9.5 - 10.5 <20 NW 10 - 15 NW + + 2010 Feb 13 24 7 - 11 <25 NW 5 - 10 NW + + 2010 Feb 13 24 17 - 18 25 NW 5 - 10 NW + + 2010 Feb 17 23, 24 19 - 23.5 10 - 25 NW 5 - 10 NW - + 2010 Feb 18 24 3.5 - 5 <20 T 0 - 5 NW - + 2010 Feb 20 23, 24 20 - 24 <25 NW 10 NW - + 2010 Feb 21 23, 24 0 - 2 25 NW => T 5 - 10 NW - + 2010 Feb 21 23, 24 9 - 15 25 - 50 NW 5 - 10 NW + + 2010 Feb 21 24 17.5 - 19.5 25 SE 0 - 5 NW + + 2010 Feb 21 23, 24 23 - 24 <20 NW 0 - 5 NW - + 2010 Feb 22 24 0 - 2.5 50 T 0 - 5 SE - + 2010 Feb 22 23, 24 11.5 - 15 <20 NW 0 - 5 NW + + 2010 Feb 23 24 12 - 15.5 25 T 5 - 10 SE + + 2010 Mar 11 24 3 - 5 25 NW 5 - 10 NW - + 2010 Mar 11 24 12.5 - 16 75 T => NW 0 - 5 NW + + 2010 Mar 12 24 16 - 17.5 25 NW 0 - 5 NW + + 2010 Mar 15 24 6 - 7 20 T => NW 0 - 5 SE + - 2010 Mar 15 24 14 - 15.5 25 SE 0 - 5 NW + -
CHC-TR-075 23
6. References
[1] Brown, T.G., 2006, Analysis of ice event loads derived from structural response,
ScienceDirect: Cold Regions Science and Technology 47 (2007) 224-232, October 23,
2006.
[2] Frederking, R., Kubat, I. and Prinsenberg S., 2007, ICE INTERATION WITH CONFEDERATION BRIDGE – REVIEW OF NRC PROGRAM, Confederation Bridge
Engineering Summit, Charlottetown, PEI, Canada, August 19-22, 2007.
[3] Kubat, I. and Frederking, R., 2001, RESPONSE OF CONFIDERATION BRIDGE TO ICE FORCES: 2000 WINTER SEASON, Proceedings of the 16th International
Conference on Port and Ocean Engineering under Arctic Conditions (POAC’01), Ottawa,
Ontario, Canada, August 12-17, 2001.
[4] MANICE, 2005, Manual of Standard Procedures for Observing and Reporting Ice Conditions, June 2005, Revised Ninth Editions, Canadian Ice Service (CIS).
24 CHC-TR-075
APPENDIX A
Daily time series plots of pier P23 and P24 lower tiltmeter and wind data for the winters 2008, 2009 and 2010.
Each plot is labeled with a header that identifies the date in a format of year-month-day all numbered in sequence; 20080115 is 2008 January 15. The Julian Day for the year is identified by JD.
The 2008 record runs from 2008 01 15 (JD15) to 2008 04 03 (JD94). The 2009 record runs from 2009 01 14 (JD14) to 2009 04 22 (JD112). The 2010 record runs from 2010 01 15 (JD15) to 2010 03 16 (JD75).