Publisher’s version / Version de l'éditeur:
Journal of ASTM International, 4, Nov/Dec. 10, pp. 1-13, 2007-11-01
READ THESE TERMS AND CONDITIONS CAREFULLY BEFORE USING THIS WEBSITE.
https://nrc-publications.canada.ca/eng/copyright
Vous avez des questions? Nous pouvons vous aider. Pour communiquer directement avec un auteur, consultez la
première page de la revue dans laquelle son article a été publié afin de trouver ses coordonnées. Si vous n’arrivez pas à les repérer, communiquez avec nous à [email protected].
Questions? Contact the NRC Publications Archive team at
[email protected]. If you wish to email the authors directly, please see the first page of the publication for their contact information.
Archives des publications du CNRC
This publication could be one of several versions: author’s original, accepted manuscript or the publisher’s version. / La version de cette publication peut être l’une des suivantes : la version prépublication de l’auteur, la version acceptée du manuscrit ou la version de l’éditeur.
For the publisher’s version, please access the DOI link below./ Pour consulter la version de l’éditeur, utilisez le lien DOI ci-dessous.
https://doi.org/10.1520/JAI101055
Access and use of this website and the material on it are subject to the Terms and Conditions set forth at
Understanding low-sloped roofs under Hurricane Charley from field to
practice
Baskaran, B. A.; Molleti, S.; Roodvoets, D.
https://publications-cnrc.canada.ca/fra/droits
L’accès à ce site Web et l’utilisation de son contenu sont assujettis aux conditions présentées dans le site
LISEZ CES CONDITIONS ATTENTIVEMENT AVANT D’UTILISER CE SITE WEB.
NRC Publications Record / Notice d'Archives des publications de CNRC: https://nrc-publications.canada.ca/eng/view/object/?id=2dcc3fa7-0643-4e7a-b8eb-61563eb557a8 https://publications-cnrc.canada.ca/fra/voir/objet/?id=2dcc3fa7-0643-4e7a-b8eb-61563eb557a8
U n d e r s t a n d i n g l o w - s l o p e d r o o f s u n d e r
h u r r i c a n e C h a r l e y f r o m f i e l d t o p r a c t i c e
N R C C - 5 0 0 2 3
B a s k a r a n , A . ; M o l l e t i , S . ; R o o d v o e t s , D .
A version of this document is published in / Une version de ce document se trouve dans: Journal of ASTM International, v. 4, no. 10, Nov/Dec. 2007, pp. 1-13, doi:
10.1520/JAI101055
The material in this document is covered by the provisions of the Copyright Act, by Canadian laws, policies, regulations and international agreements. Such provisions serve to identify the information source and, in specific instances, to prohibit reproduction of materials without written permission. For more information visit http://laws.justice.gc.ca/en/showtdm/cs/C-42
Les renseignements dans ce document sont protégés par la Loi sur le droit d'auteur, par les lois, les politiques et les règlements du Canada et des accords internationaux. Ces dispositions permettent d'identifier la source de l'information et, dans certains cas, d'interdire la copie de documents sans permission écrite. Pour obtenir de plus amples renseignements : http://lois.justice.gc.ca/fr/showtdm/cs/C-42
Understanding Flat Roofs Under Hurricane Charley
From Field to Practice
A. Baskaran
1, S.Molleti
2and D. Roodvoets
31 Vice-Chair, Senior Research Officer, Roofing Industry Committee on Weather Issues, National Research Council Canada, Ottawa, Ontario, Canada, K1A [email protected]
2 Research Officer, National Research Council Canada, Ottawa, Ontario, Canada, K1A 0R6. 3 Ex Chair, Roofing Industry Committee on Weather Issues
ABSTRACT
Natural wind hazard damages have been dramatic in recent years, incurring losses of life and property around the world. Wind induced failure is one of the major contributors to insurance claims, and it is rising. To address these growing concerns, RICOWI (Roofing Industry Committee on Weather Issues) started a Wind Investigation Program (WIP) to investigate the field performance of roofing assemblies after major windstorm events and to factually describe roof assembly performance and modes of damage. As part of this program, hurricane Charley, which hit the Punta Gorda FL with winds exceeding 140 mph, was investigated. This paper mainly focuses on the field performance of the low-sloped roofs with three important parameters that were found critical in the failure of the roofing systems, namely
1. Effect of Corner Wind Suction 2. Effect of Parapet
3. Effect of Internal Pressure
For each scenario, first scientific documentation was presented, and then how the field observation reflects the fundamental principles were discussed. Based on this exercise correlations are developed for roof wind design. In addition, wind design data from the North American codes of practice are also calculated and compared to show the impact of science and field observation on durable roof design. With these illustrations, this paper offers recommendations to advance the roof system design for hurricane prone regions.
Keywords
1. INTRODUCTION
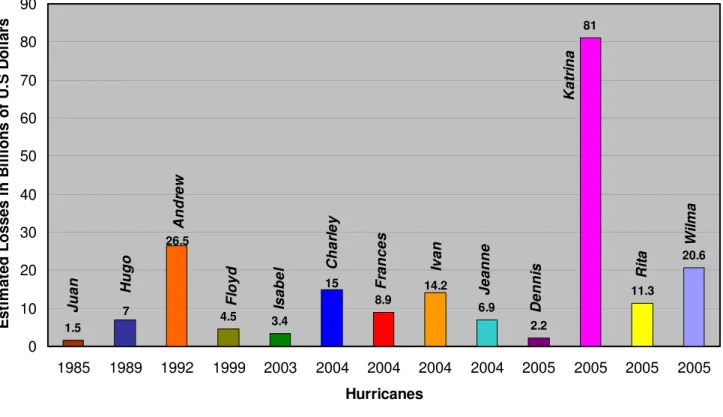
Natural wind hazards such as typhoons and hurricanes have been dramatic in recent years, incurring losses of life and property damages. Figure 1 shows the trend of the damage amounts of the most costly hurricanes in the United States. As shown in the Figure 1 [National Oceanic and Atmospheric Administration (NOAA), 2007] the years 2004 and 2005 can be considered as the worst hurricane disaster years incurring total losses of 45 and 115 billion U.S. dollars respectively (not adjusted for inflation). Of these, Hurricane Charley, in the year 2004 was a category 4 event. (Categories range from 1-5 with 5 having the highest wind speeds and severe damage expected) incurring losses of $15 billion U.S dollars across the areas of Florida and South Carolina. In contrast to Hurricane Katrina, where the damages were a combination of water and wind induced failures, nearly all damages from Hurricane Charley were wind-induced failure. Wind induced failure is one of the major contributors to insurance claims, and it is rising. Therefore, understanding as how to prevent wind damages by establishing engineering standards, or standard practices will allow designer to design roofs that can stay during high winds.
Figure 1: Approximate cost of hurricanes (Source: NOAA)
Hurricanes Hugo and Andrew created awareness of roof failures. There was also concern that the truth of the causes of failures, and the types of products that failed was distorted (Cook and Soltani, 1993, Smith et. al., 1992). Following these storm events, two workshops were devoted to identify and discuss roof wind uplift issues and solutions (Baskaran et. al., 1997). One of the outcomes of these workshops resulted in the establishment of the Roofing Industry Committee on Weather Issues (RICOWI). An additional outcome was the formulation of “Special Interest Group for Dynamic Evaluation of Roofing Assemblies” (SIGDERS), a North American roofing consortium.
RICOWI is made up of 15 sponsors representing the major roofing associations and 42 affiliates representing general interested parties. RICOWI started a Wind Investigation Program (WIP) with a mission of:
1. to investigate the field performance of roofing assemblies after major wind storm events 2. to factually describe roof assembly performance and modes of damage
3.
to formally report the results for substantiated wind speeds.Keys to the RICOWI investigations are that investigation teams are balanced, unbiased and trained in wind damage assessment. The teams typically are made up of a manufacturer, a
roofing consultant, university or insurance organization personal, and a manufacturer from another part of the roofing industry. Initial training for the investigation teams occurred at Oak Ridge National Lab (ORNL) in 1996 (Baskaran et.al,1997). Training focused on how winds interact with the built environment, how to detect wind damage, wind direction and causes of the damage. Badges were issued to each member of the team that attended the training seminar. Attendance was mandatory to issue of badges, (Official US Department of Energy Badges) which members used for identification purposes during the wind investigation.
In the year 2004, Hurricane Charley with winds exceeding 140 mph made landfall with a direct hit on Punta Gorda, FL. WIP deployment criteria is 95mph-sustained winds. Based on this, field investigation started after it was determined that the storm had the appropriate wind and sufficient roof damage. A small scouting team that reported back to RICOWI headquarters made this effort. Within the first week after the storm, the teams were called out and assembled, and arriving on site the teams were updated on the storms extent and other issues such as safety and communication measures.
All inspections documented the investigations using standard forms, and the failure modes were photographed. At the end of each day of investigation, reports were completed and were provided to the administrator, and also a feedback session occurred so that the teams could follow up on interesting leads. Although teams typically worked from the highest wind damaged areas to the less wind damage areas, there was no attempt to get randomized data. Towards the end of investigation report writers that were members of the investigation teams developed a final report from the data (RICOWI,2006). This paper mainly focuses on the field performance of the low sloped/ flat roofs as discovered in the investigations after Charley.
The objective of the paper is not to present several photographs and information related to specific roof configurations. Rather, efforts were made to scrutinize all these photographs and field observations towards developing a relationship with the existing science in the wind and roofing field. In doing so, and to respect to the page limitation of the paper, only three important parameters that were found critical in the failure of the roofing systems are selected, namely
1. Effect of Corner Wind Suction 2. Effect of Parapet
3. Effect of Internal Pressure
observation reflects the fundamental principles are discussed. Based on this exercise correlations are developed for roof wind design. In addition, wind design data from the North American codes of practice are also calculated and compared to show the impact of science and field observation on durable roof design. With these illustrations, this paper offers recommendations to advance the roof system design for hurricane prone regions.
2. CORRELATION OF FIELD FAILURE OBSERAVTIONS WITH THE EXISTING
KNOWLEDGE
2.1 Effect of Corner Wind Suction
Wind flow around buildings creates both negative and positive fluctuations over a roofing system. The negative pressure is created by the flow separation on the windward side of the roof while the positive pressure is created by the internal pressure in the building. The internal positive pressure is dependent on the location of dominant openings in the building and it is generated by the wind flow into the building and the temperature difference across the envelope. These pressures are dynamic and can be separated into static and fluctuating components. The static component is simply the mean pressure. The transient component occurs as a random process and its dominant frequencies depend on the frequency of the upstream wind and the geometry of the building. Thus the wind effect on roofing and its response is dynamic.
As mentioned before, wind pressure distribution varies spatially over a roof and it can have high suction at the corner and perimeter, due to vortex flow and separations. This science is clearly displayed in Figure 2, which represents pressure variation on a building roof taken from a wind tunnel study at National Research Council of Canada (NRC) (Savage et.al., 1994). The wind tunnel tests were carried out in the 30 ft x 30 ft (9 m × 9 m) NRC wind tunnel. These tests used full-scale roofing components 10 ft x 10 ft (3 × 3 m in size) having different heights. For wind directions perpendicular to a building face (normal wind) and at 45 degrees to a face (oblique wind) measurements were made in smooth wind and turbulent wind conditions for five wind speeds, ranging from 30 to 60 mph (13.4 m/s to 26.8 m/s). As shown in the Figure 2, PVC (Polyvinyl Chloride) roofing system was tested with 81 pressure taps fitted on the single ply membrane to measure the unsteady pressure loads on the roof (Savage et al., 1994). In total, 30 configurations were tested in this wind tunnel study. Wind induced corner suctions are evident from the Figure 2 with maximum measured mean pressure coefficient (Cp) of 1.8 on corners. Pressure coefficients (Cp) are the non-dimensional ratios of wind-induced pressures on
a building to the dynamic pressure (velocity pressure) of the wind at the reference height, which is the roof eave height.
Figure 2: Wind tunnel model and wind induced pressure distribution over a roof assembly (Savage et. al, 1994))
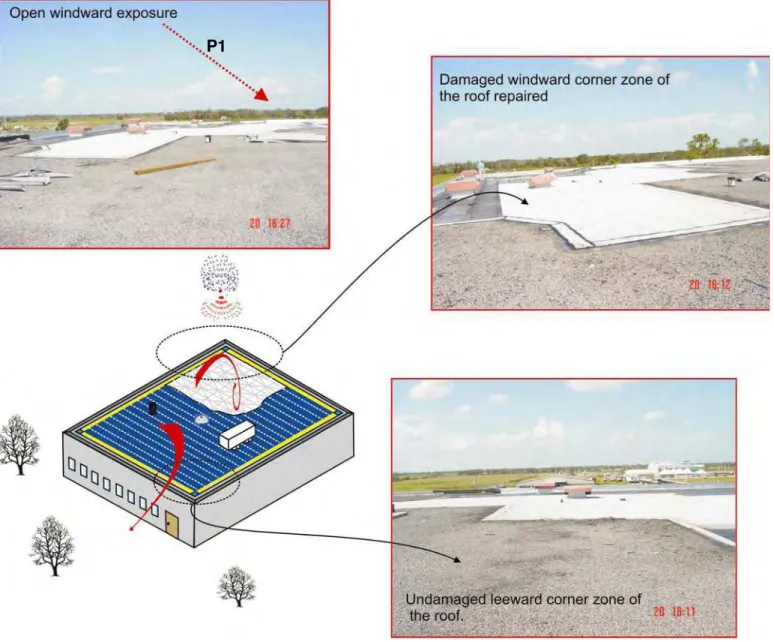
2.1.1 Case Study 1: Failure Investigation of a School Roof
Figure 3 shows the failure investigation of a school roof in which the above discussed scientific data have been correlated to the field observation. All the photographs shown in the Figure 3 are taken from the top of the roof under investigation. P1 shows the prevailing windward exposure condition. According to the American codes standards of practice (American Society of Civil Engineers, ASCE 7-05), this can be classified as Exposure C where as the Canadian building code (National Building Code of Canada, NBCC 2005) classifies it as Open country exposure. Even though there is variation in the terminologies, both of them define that “open terrain with
scattered obstruction having flat open country, grasslands and water surface as the criteria for this exposure condition”.
The building under investigation was a 40 ft (12 m) high concrete walled gymnasium. It is part of a school used as a shelter during hurricane Charlie, although it was not designated as a shelter. The building is of substantial construction with concrete walls and a lightweight concrete deck. There was only one exterior fire escape door that led to the outside. It was reported as closed during the storm. Primary access was through the corridors of the adjacent building. The entire complex with several roof areas totalled more than 140,000 sq. ft (13,000 sq. m). The damaged roof area section was about 40000 sq. ft. (3700 sq. m) and had a stone surface 4-ply BUR (Built-up Roofing). The membrane was attached to a lightweight concrete deck mechanical fastener. A large section of the gymnasium roof (over 40% of the membrane) blew off during the storm when about 400 people were inside. This released a large volume of water that spread across most of the school complex. Other than some limited edge metal damage, there was no damage to about 100.000 sq.ft (9300 sq. m) of roof on adjacent parts of the structure. These sections were all BUR membrane roofs appearing to be of the same construction as the sections that were blown off.
The gymnasium roof structure did not appear to fail because of pressurization below the deck; the cause appears to have been purely suction force. The school roof was the highest point in several miles, so it took the brunt of the hurricane’s force. The low 2 ft (0.7 m) parapet in the
upwind corner did not help to reduce the maximum uplift (also refer to discussion of Figure 4 and 5). The roof failure pattern was typical of the uplift forces that would be present in a cornering wind with an L-shaped area. As temporary repairs had been made, it was not possible to determine the sequence of failure. It is interesting to correlate the failure shape with the wind pressure distribution diagram of the Figure 2 where the roof corner experiences high suction. This was the similar phenomenon in the case of the school roof, where those high suction pressures on the corner of the roof caused the failure of the roof.
Figure 3: Roof assembly failure due to high suctions caused by cornering wind
2.2 Effect of Parapet
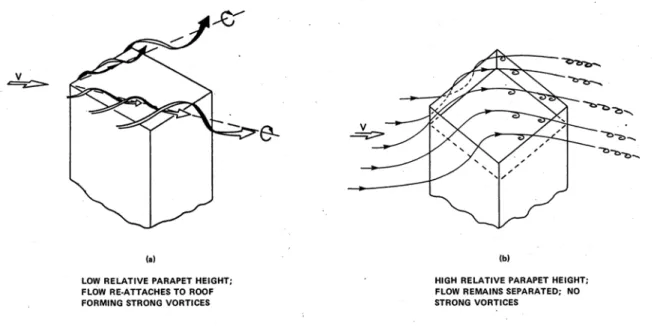
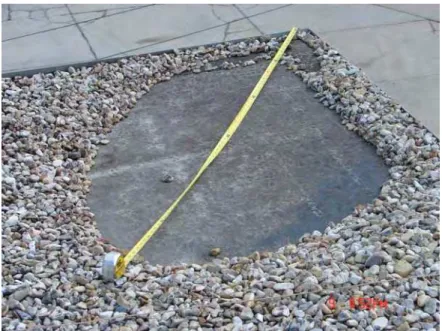
Most flat roofs have a parapet. It is the low wall built along one side of, or, all around the perimeter of a flat roof, where it may modify the wind flow over the roof so that the pressure on it is more uniformly distributed. It also provides a measure of safety in that no objects (gravel, for example) are so easily blown into the street below. Parapets have been of research interest from early 1970’s and several wind studies are being carried out to quantify the influence of parapet on roof wind loads (Baskaran, 1986, Baskaran and Stathopoulos, 1988, Kopp et al 2005). Figure 4 shows a typical wind flow over roofs with parapet. According to Kind et. al., (1977 to 1987) increased parapet height generally resulted in more favourable pressure distributions. That is, maximum suctions were reduced and suction peaks were broadened so that pressure are less non- uniform and monotonic, there was no ‘worst’ non – zero parapet height. Parapets are also effective in preventing stone blow off from the buildings having ballasted roof systems. However limitations do exist regarding the effectiveness of the parapet height in providing resistance to the phenomenon of stone blow-off [Kind et. al.1977, Single Ply Roofing Industry (SPRI), 2002]. Field observation on a gravel roof with low parapet confirms these scientific theories (Figure 5).
Figure 4: Effect of parapet height on wind flow over roofs, (Kind, Savage and Wardlaw, 1987) Figure 5: Wind vortex formation on gravel roofs due to low parapet.
Building standards and codes only recently provided guidelines in the context of parapet effects on wind induced suction pressures on flat roofs. The effect of perimetric parapets on pressure coefficients differs from one region of a flat roof to another:
Generally the mean pressure coefficients at the field region of the roof have minimum effect by parapets. Therefore, one may assume wind loads for field regions of flat roofs are the same regardless of the existence of a parapet.
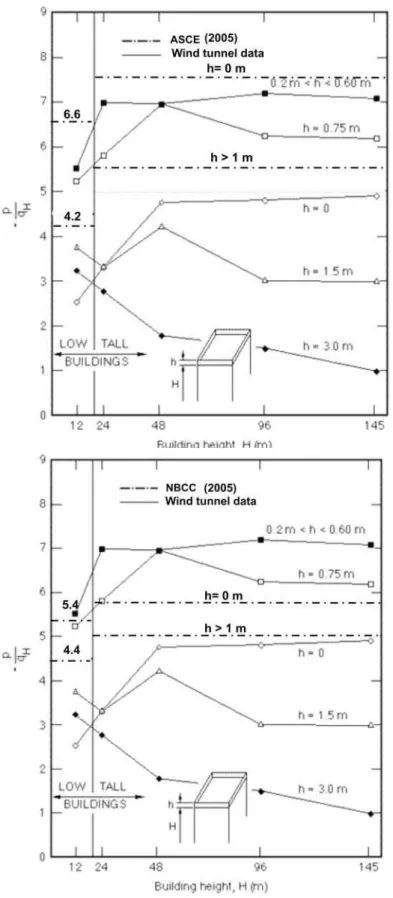
At the edge regions, parapets decrease the peak pressure coefficients. A low parapet, i.e., a parapet less than 3 ft (1 m) high, reduces these pressure coefficients by up to 10% for tall [60 ft (20) m or higher] buildings, and by up to 30% for low [less than 60 ft (20 m) high] buildings. A high parapet reduces the peak pressure coefficients by up to 20% for tall buildings, and by up to 15% for low buildings. Overall for the edge region parapets are beneficial in reducing the suctions irrespective of the building and parapet heights. At corner regions (Figure 6), low parapets tend to increase both the mean and peak
pressure coefficients. In fact, with winds approaching a roof obliquely (at 45°), 1 ft to 1.2 ft (0.3 to 0.4 m) high parapets can roughly double the pressure coefficients at the corner regions of a roof of both low and tall buildings. Parapets of 3 ft (1 m) or higher, however, reduce the pressure coefficients of roof corners of tall buildings significantly, but only marginally on low buildings
Based on the wind tunnel measurements building codes recommends reduction in roof wind uplift design loads for tall building. Refer Figures I-9, I-15 and Figures 6.11 and 6.17 respectively in the NBCC 2005 and ASCE 7 –2005.
Figure 6: Relationship of code specifications {NBC (2005) and ASCE (2005)} to measured data (Baskaran, 1986) regarding pressure coefficients on roof corners with parapet
2.2.1 Case Study 2: Success Story of Condominium Building
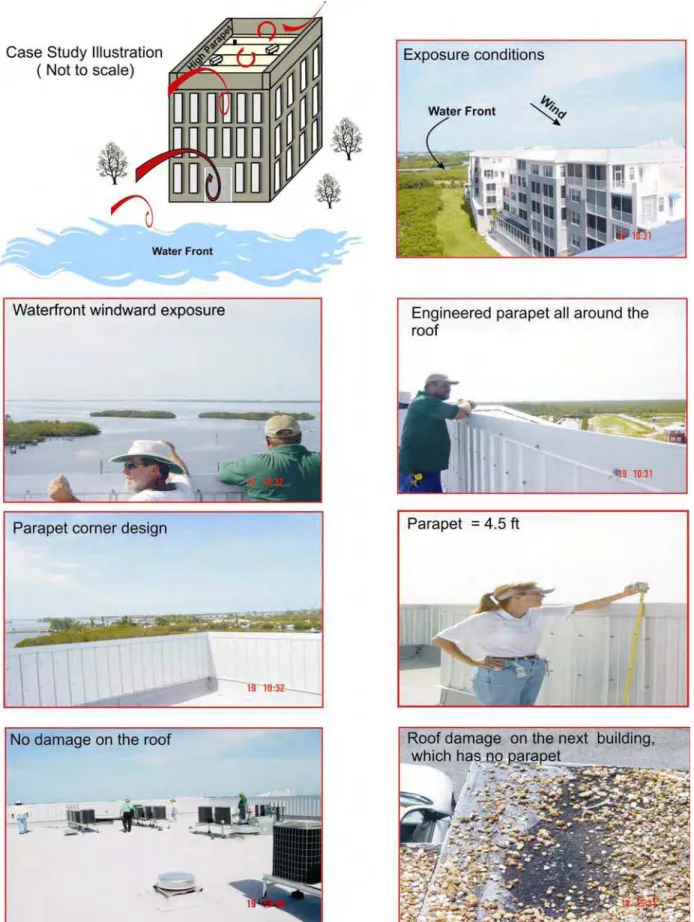
Figure 7 shows the beneficial effect of parapet on the wind uplift resistance of a roof assembly. The investigated building was a six-storey condominium building; stucco wall construction with a poured concrete roof deck. Granule surface BUR system was over mopped-in-place with perlite insulation. Roof was approximately 37,000 sq.ft (3400 sq. m). The perimetric parapets were designed well and the field measurements indicated they are about 5 ft (1.5 m) high. Parapet corners are also well designed and capped with a single piece of metal coping. Wind-related damages were limited to approximately 5% of the wall/parapet cap and underside of soffit. No damages were observed to the roof. As shown in the photograph of Figure 7, the building is relatively new and exposed to water front exposure (“Exposure C” – ASCE 7-05, “Open terrain” –NBCC 2005). This exposure condition is considered to be the most severe exposure condition..
As illustrated in Figure 6, due to high perimetric parapet configuration, the wind suctions on the rooftop of the condominium might have reduced, which possibly could have caused fewer damages to the roof assembly. Also there were many individual HVAC units that were mounted on the condominium rooftop stands and all of these were in excellent condition. No movement was apparent for any of the HVAC units. However, the surrounding buildings in the neighbourhood of this condominium, which had no parapets, experienced severe damages. One such building with gravel blow off from the roof is also shown in Figure 7. This gravel blow-off exposed the membrane to the ultraviolet radiation which may eventually reduce the durability of roof assembly. Note that that the parapet is not the only important factor for the roof assembly to sustain hurricane force uplift. Parapets with sufficient height can influence in reducing the wind-induced loads. It is equally important that other good roofing practices such as attachment of the assembly (i.e., adhesion, cohesion, mechanical attachment, air barrier, etc) should be adequate to sustain whatever uplift forces it experiences. Failure to do so can blows off the roof whether a sufficient height parapet is present or not.
Figure 7: Beneficial effect of parapet on the wind uplift load reduction of roof system
2.2.2 Case Study 3: Success Story of Commercial Building
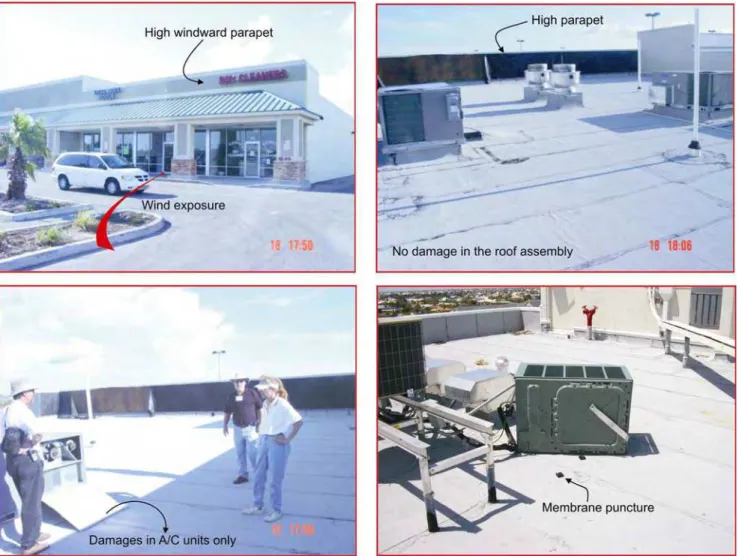
Figure 8 presents a success story of a commercial building roof assembly, which might have survived due to high parapet. Roof area was approximately 5,000 sq.ft (460 sq. m) with a 5.5 ft (1.8 m) parapet on the storefront side, a 4.5 ft (1.5 m) shared wall on one side, a 3 ft (1 m). parapet on the third side, and a gutter edge along the rear side. Granule surface modified bituminous membrane was installed directly over mechanically attached insulation, which had metal deck as the substrate. No damages were noticed on the roof assembly. However, contrary to the case study 2, there were several blow offs of HVAC (Heating Ventilation and Air Conditioning) panels. More severely, some of the air-handling units lifted from their base due to the lack of proper attachment. It has also been observed that these units moved in distance from the base as far as the electric wiring allowed. These blow offs and flip-flop movements caused punctures of the roof membrane and resulted in the failure of the waterproofing capacity of the roof assembly.
Figure 8: Survived roof assembly due to high parapet and damages caused by the rooftop equipments.
2.3 Recommendation from Field to Practice
Corner wind can cause high wind suction and use of high parapet can mitigate those high suctions. Wind flow aerodynamics over a roof area has been modified based on the presence of parapet and its height. These modifications affect the wind-induced suctions on the roof assembly. Measured data show that high parapets on tall building show beneficial effect in suction reduction. Therefore, in hurricane prone regions use of parapets over 3 ft (1 m) high are recommended.
2.4 Effect of Internal Pressure
Design wind pressure on a roof is the algebraic sum of the external pressure and internal pressure across the roof assembly. It can be presented as follows:.
psf NBCC (1) ) C C C C C C ( q I = p w e g p - e gi pi
(
p- i)
2 d zt zK K V IGC GC K 00256 . 0 = p psf ASCE (2)CeCgiCpi and GCi are the internal pressure components respectively according to NBCC and
ASCE. The magnitudes of these internal coefficients depend on the distribution of the openings and air leakage paths in the building envelope. Due to the uncertainties of the size and distribution of openings in the building, the internal pressure coefficients can have a wide range as given below:
NBCC: Openings Category
Category 1: Cpi : -0.15, 0.0
Category 2: Cpi : -0.45, 0.3
Category 3: Cpi : -0.7, 0.7
ASCE: Enclosure Classification
Open Buildings : GCi : 0.00
Enclosed Buildings: GCi : +0.18, – 0.18
Partially Enclosed Buildings: GCi : +0.55, – 0.55
Examples of wind load calculation with /without internal pressure
Two buildings of height 30 ft (10 m) and 70 ft (21 m) are located in a hurricane prone region having wind speed of 150 mph (67 m/s). These buildings have importance category II and exposure conditions of C. With the assumption of building “enclosed” before storm and building
becomes “partially enclosed“ during the storm, Table 1 illustrates the variation of design pressures using ASCE 7-05. Similar calculations are performed using NBCC 2005 for the same building located in the high wind region of Newfoundland and the results are also presented in Table1.
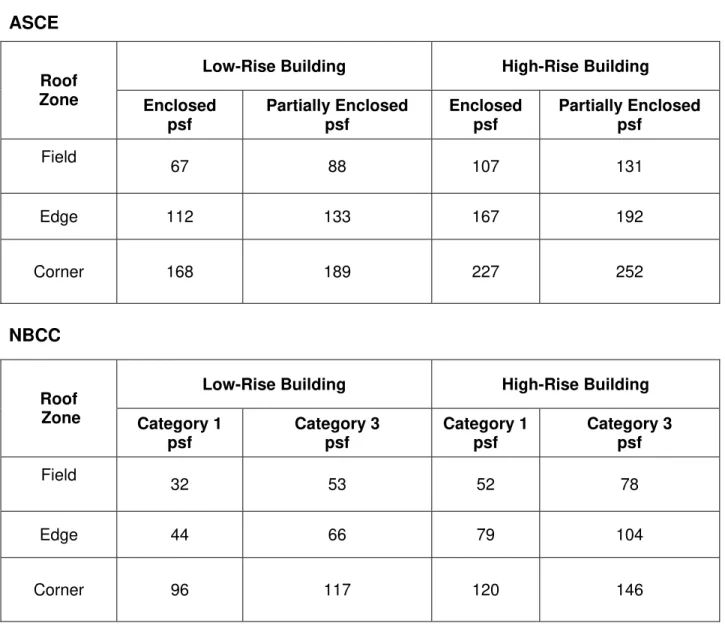
Table 1: Variation in design pressure with the respect to the internal pressure
With the assumption that the 30 ft (10 m) low rise building was designed and constructed as enclosed building, the design pressures as per ASCE 7-05 indicated in the Table 1 are 67, 112, 168 psf (3.2, 5.4, 8 kPa) for the field, edge and corner respectively. Now, during the hurricane with winds blowing at speed of 150 mph (67 m/s), assume that the low-rise building undergoes deformation of walls and damages to the windows making the building partially enclosed. The design pressures for the roof covering will be increased as illustrated in Table 1 as 88, 133, 189 psf (4.2,6.4,9 kPa) for the field, edge and corner respectively. The transition from enclosed to partially enclosed has resulted an increase of design pressure by 21 psf (1 kPa) for the three zones of the roof. Similar trend was also observed in the design pressures of the low-rise building calculated using NBCC 2005. This increase in the design pressure indicates, that for the buildings located in the hurricane prone regions or high wind regions, the roof design should account for these high probability situations that could occur from severity of the storm. It should be noted that this 21 psf (1 kPa) increase is only on the design pressures and not on the required resistance of the roof assembly. In order to obtain the required resistance, the design pressures are to be multiplied by appropriate safety factors. Systems tested under dynamic testing can use a value of 1.5 as safety factor (CSA, 2004) whereas statically tested systems can use a safety factor of 2.0 or higher. In other words, for this particular low rise building, the roof covering should be designed as a partially enclosed building with design pressures of 88, 133, 189 psf (4.2,6.4,9 kPa ) for the field, edge and corner respectively and the required resistance should be 176, 266 and 378 psf ( 8.4, 12.7, 18 kPa) respectively. The following case study will clearly illustrate how the transition from an enclosed building to a partially enclosed during the Hurricane Charley lead to failure of the roof and it signifies the pivotal role of internal pressure on the roof covering design.
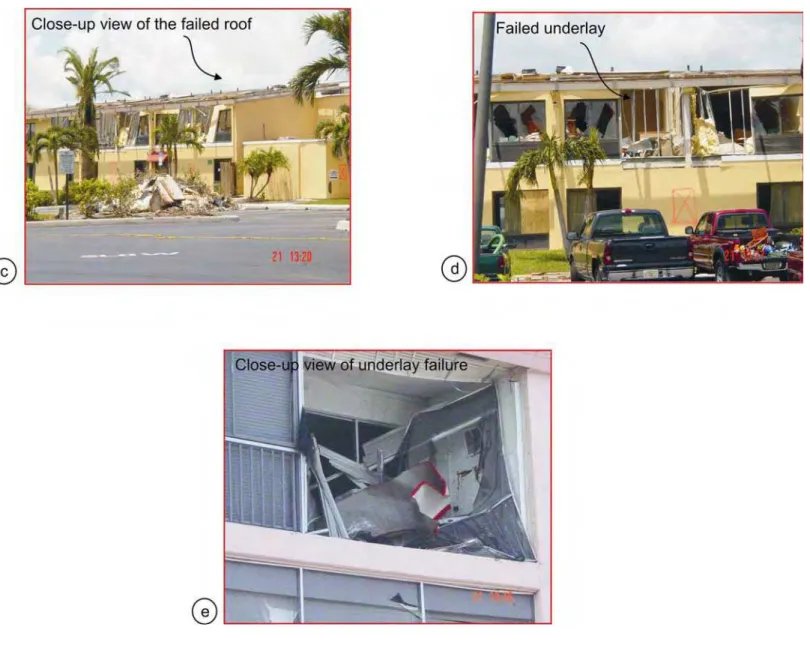
2.4.1 Case Study 4 :Failure Investigation of a Multi-Occupancy Building
As shown in Figure 9, the failed roof assembly belongs to a multi-occupancy building. The building comprised of two sections, the section on the right was an old construction on which the
roof survived. An addition to this section on the left was a relatively new construction on which the roof assembly completely failed. The walls of this new addition were constructed of EIFS (Exterior Insulation and Finish System). Field failure observation indicated that poor integration of wall/window interface. In other words, windows were just plastered without any anchorage to the structural support to the walls as part of the whole building envelope system. As a result, the blowing wind on the windward side as shown in Figure 9, ripped apart the windows from the EIFS surged inside the building and increased the internal pressure, which ultimately lifted the entire roof assembly. In contrast, the old construction was of brick cladding and the windows were properly integrated with the building envelope, and as shown in Figure 9, it was devoid of any damage. This case study is a good illustration of the scientific phenomenon of internal pressure build-up and the severity of the damage it can cause to the roof assembly.
Figure 9: Roofing assembly failure due to sudden build-up in the internal pressure
2.5 RECOMMENDATION FROM FIELD TO PRACTICE
Internal pressure build-up can increase the roof failure probability. Probabilities of window cladding failures are high in hurricane prone regions and such failures can significantly increase the internal pressure that can lead to roof uplift failures. It is recommended that designer should allow provisions to account for such failures during the design and the selection of the roofing system. This can be achieved by classifying the building as Category 3 as per NBCC 2005 or Partially enclosed building as per ASCE 7-05.
3. NEED FOR ENGINEERED EDGE DESIGN
Perimeters and corners of low slope roofs have been recognized as the most vulnerable areas of the roof. The high uplift found in these areas has been factored into the model national buildings codes, and resisting these loads has been a requirement of the codes for many years. Failure however continues to occur at these vulnerable parts of the buildings because both design and installation practices are inadequate. The negative forces at the perimeter must be resisted by adequate mechanical attachment or bonding of the roofing membrane to the substrate and deck. Many designs allow pressurization of the underside of the roofing system, which significantly adds to the loads that must be resisted. The load to be resisted is dynamic and most tests used to evaluate roofing systems are static, or quasi static. Tests also focus on the vertical force of uplift, but the forces once they break the initial bond or mechanical attachment become peel forces that are not measured in current testing. In current testing the first mechanical failure (screw withdrawal) or separation of the membrane stops the test. In
nature roofs survived with small amounts of initial failure if the peel forces were resisted. If the peel forces are resisted catastrophic damage is less likely.
Prior to 2004 there were no code requirements for roof edge attachment. This has been corrected with the addition of ANSI/SPRI/ES-1 (SPRI,2003) Edge Design Standard For Low Slope Roofs as a code requirement in the International Building Code. This illustrates the point however that building codes prefer to reference consensus standards as the basis for design and installation requirements. This is where ASTM (American Society for Testing and Materials) and other standards developers must be working to understand the problems and develop tests, and standard practices that provide more pertinent data and functional systems.
4.CONCLUSIONS
This paper presented relationship between field observations during Hurricane Charley and the existing science in the wind engineering and roofing field. This has been discussed for three important parameters that were found critical in the failure of the roofing systems, namely
Effect of Corner Wind Suction Effect of Parapet
Effect of Internal Pressure
Each of these scenarios, first scientific documentation was presented, and then how the filed observation reflects the fundamental principles were discussed. Wind design data from the North American codes of practice are also calculated and presented to show the impact of science and field observation on durable roof design.
REFERENCES
American Society of Civil Engineers Standard ASCE 7-2005, “Minimum Design Loads For Buildings And Other Structures”.
Baskaran, A., Wind loads on flat roofs with and without parapets. M.Eng. thesis, Concordia University, Montreal, 1986
Baskaran, A. and T. Stathopoulos. Roof corner wind loads and parapet configuration. J. Wind Engineering and Industrial Aerodynamics, 29:79 88, 1988.
Baskaran, B.A.; Desjariais, A.; Roodvoets, D.; Wood-Shields, P. "Strategic plan for the wind event investigation program," 8th US Wind Engineering Conference (Baltimore, MD. USA, June 05, 1997), pp. 1-5, 1997
CSA Number A123.21-04 (2004),”Standard test method for the dynamic wind uplift resistance of mechanically attached membrane-roofing systems, Canadian Standards Association, Canada. Cook, R.A and Soltani, M (1992), “Hurricanes of 1992-Lessons Learned”, Proceedings of Symposium by American Society of Civil Engineers, Dec 1-3, 1993.
Hurricanes Charley and Ivan Wind Investigation Report, RICOWI Inc. Powder Springs, GA 30127,2006
Kind, R.J. and Wardlaw, R.L., “The Development of a Procedure for the Design of Rooftops Against Gravel Blow-off and Scour in High Winds,” Proceedings of the Symposium on Roofing Technology, 1977, pp. 112.
Kind, R.J. and Wardlaw, R.L., “Wind Tunnel Tests on Loose-Laid Roofing Systems for Flat Roofs,” Proceedings of the Second International Symposium on Roofing Technology, 1985, pp. 230.
Kind, R.J., Savage, M.G., and Wardlaw, R.L., “Further Model Studies of the Wind Resistance of Two Loose-Laid Roof Systems (High-Rise Buildings), National Research Council of Canada, Report LTR-LA-269, April 1984.
Kind, R.J., Savage, M.G., and Wardlaw, R.L., “Further Wind Tunnel Tests of Loose-Laid Roofing Systems”, National Research Council of Canada, Report LTR-LA-294, April 1987.
Kind, R.J., Savage, M.G., and Wardlaw, R.L., “Pressure Distribution Data Measured During the September 1986 Wind Tunnel Tests on Loose-Laid Roofing Systems”, September 1987.
Kopp,G., Surry, D., Mans, C., “Wind effects of parapets on low buildings: Part 1. Basic aerodynamics and local loads”, Journal of Wind Engineering and Industrial Aerodynamics, 93(11), 817-841, 2005
Kopp,G., Mans, C., Surry, D., “Wind effects of parapets on low buildings: Part 2. Structural loads.” Journal of Wind Engineering and Industrial Aerodynamics, 93, 843-855, 2005
Mans, C., Kopp, G., Surry, D., “Wind effects of parapets on low buildings: Part 3. Parapet Loads.” Journal of Wind Engineering and Industrial Aerodynamics, 93, 857-872, 2005
Kopp,G., Mans, C., Surry, D., “Wind effects of parapets on low buildings: Part 4. Mitigation of corner loads with alternative geometries.” Journal of Wind Engineering and Industrial Aerodynamics, 93(11), 873-888, 2005
National Oceanic and Atmospheric Administration,(NOAA),”The Deadliest, Costliest, And Most Intense United Sates Tropical Cyclones from 1851 TO 2006 (and other frequently requested hurricane facts), Technical memorandum, NWS TPC-5, April 2007.
NRC (National Research Council). 2005. National Building Code of Canada, Part 5. Ottawa: National Research Council of Canada, Ottawa, Ontario, Canada, K1A 0R6.
Savage, M.G, Baskaran, A., Cooper, K.R and Lei, W., 1996. “Pressure Distribution Data Measured During the November 1994 Wind Tunnel Tests on a Mechanically-Attached, PVC Single-Ply Roofing System”, IAR Report LTR-A-003, National Research Council, Canada.
Smith, T.L., Kind, R.J., McDonald, J.R., “Hurricane Hugo: Evaluation of Wind Performance and Wind Design Guidelines for Aggregate Ballasted Single-Ply Membrane Roof Systems,”
Proceedings of the VIII International Roofing and Waterproofing Congress, 1992, pp. 598. SPRI, (Single Ply Roofing Industry) ES-1 Wind Design Standard for Edge Systems Used With Low Slope Roofing Systems. Needham MA, 2003.
SPRI (Single Ply Roofing Industry), RP-4 “ Wind Design Standard For Ballasted Single Ply Roofing Systems” 2002.
RICOWI (Roofing Industry Committee on Weather Issues), Hurricanes Charley and Ivan Wind Investigation Report, RICOWI Inc. Powder Springs, GA 30127,2006
ACKNOWLEDGEMENTS
The presented research is being carried out for a consortium, the Special Interest Group for Dynamic Evaluation of Roofing Systems (SIGDERS) formed from a group of partners interested in roofing design. These partners included:
Manufacturers Atlas Roofing Corporation, Canadian General Tower Ltd., Carlisle Syn
Tec., GAF Materials Corporation, GenFlex Roofing Systems, Firestone Building Products Co., IKO Industries Ltd., ITW Buildex, Johns
Manville, Sarnafil Roofing, Soprema Canada, Stevens Roofing,
Tremco and Trufast.Building Owners Canada Post Corporation, Department of National Defence, Public
Works and Government Services Canada.
Industry Associations Canadian Roofing Contractors' Association, Canadian Sheet Steel
Building Institute, National Roofing Contractors’ Association and Roof Consultants Institute.
4.5 3.4 8.9 6.9 2.2 81 11.3 20.6 14.2 15 26.5 1.5 7 0 10 20 30 40 50 60 70 80 90 1985 1989 1992 1999 2003 2004 2004 2004 2004 2005 2005 2005 2005 Hurricanes E s tima te d L o s s e s in B illi o n s o f U .S D o ll a rs Jua n Hugo Andr ew Fl o y d Isabe l Ch a rl e y Fr ances Iv a n Jeanne Denni s Kat ri n a Ri ta W ilm a
Figure 2: Wind tunnel model and wind induced pressure distribution over a roof assembly (Savage et. al, 1994))
P1
Figure 6: Relationship of code specifications {NBC (2005) and ASCE (2005)} to measured data (Baskaran, 1986) regarding pressure coefficients on roof corners with parapet
Figure 8: Survived roof assembly due to high Parapet and damages caused by the rooftop equipments.
Table 1: Variation in design pressure with the respect to the internal pressure
ASCE
Low-Rise Building High-Rise Building
Roof Zone Enclosed psf Partially Enclosed psf Enclosed psf Partially Enclosed psf Field 67 88 107 131 Edge 112 133 167 192 Corner 168 189 227 252
NBCC
Low-Rise Building High-Rise Building
Roof Zone Category 1 psf Category 3 psf Category 1 psf Category 3 psf Field 32 53 52 78 Edge 44 66 79 104 Corner 96 117 120 146 * Note 1 psf = 47.88 Pa