BIOTECHNOLOGY MANUFACTURING PLANT LOCATION DECISIONS: MASSACHUSETTS CASE STUDIES
by Jean S. Poteete
Bachelor of Arts Harvard University
1974
Master of Business Administration Boston University
1980
SUBMITTED TO THE DEPARTMENT OF URBAN STUDIES & PLANNING IN PARTIAL FULFILLMENT OF THE REQUIREMENTS OF THE DEGREE
MASTER OF SCIENCE IN REAL ESTATE DEVELOPMENT AT THE MASSACHUSETTS INSTITUTE OF TECHNOLOGY
SEPTEMBER, 1993
@Jean S. Poteete 1993
All rights reserved
The Author hereby grants to M.I.T.
permission to reproduce and to distribute publicly copies of this thesis document in whole or in part.
/1
Signature of the author
6/
Department of UrbanCertified by
Lecturer, Department of Urban Accepted by
Interdepartmental Degree
1
Jean S. Poteete Studies & Planning July 31, 1993 Sandra Lambert Studies & Planning
~iesis Supervisor
William C. Wheaton Chairman Program in Real Estate Development
MASSACHUErTT !NSTUT
BIOTECHNOLOGY MANUFACTURING PLANT LOCATION DECISIONS: MASSACHUSETTS CASE STUDIES
by
JEAN S. POTEETE
Submitted to the Department of Urban Studies and Planning on July 30, 1993 in partial fulfillment of the
requirements for the Degree of Masters of Science in Real Estate Development
ABSTRACT
The manufacturing plant location decisions made by five Massachusetts biotechnology firms were examined. Information was gathered from company literature and by means of questionnaire-based interviews with senior corporate staff involved in the decisions. The five companies were all in the
biotherapeutic segment of the industry, and ranged in size from 90 to 1500 employees. In their location decisions, the factors most frequently cited as important were: labor availability; proximity to existing company facilities, and other agglomerization economies; taxes; business climate; economic
development assistance; and overall costs. All firms quantified costs, but did not make their final decisions on the basis of cost alone; other considerations took precedence, in some cases. Risk-minimization appeared to be at least as great a concern as profit-maximization for this group of companies, perhaps reflecting the relatively great uncertainties with which their decision-makers were faced in product development, approval, and manufacturing. All five companies had urban headquarters and research and development facilities; three located their manufacturing plants in cities, two in the suburbs.
Thesis Supervisor: Dr. Sandra Lambert
Acknowledgments
I would like to thank Dr. Sandra Lambert, my advisor, for her guidance,
patience and suggestions for improvements of this paper. I also thank Professor Charles Cooney, co-director of M.I.T.'s Program on the
Pharmaceutical Industry, for his invaluable advice, direction, and information about the Massachusetts biotechnology industry. I thank other Center for Real Estate faculty: Dr. Marc Louargand, for suggesting appropriate studies; and Professor William Wheaton, for shaping my "neoclassic" thinking about manufacturing location.
I am also grateful for the time, good humor, and openness of the
biotechnology company managers, consultants, and government officials, who answered my questions. I also thank my dear and patient husband, Tony, for trying to explain to me about "boning chromosomes" (genetic engineering)
nearly 20 years ago, and for his typing, copy editing skills, and child care expertise.
CONTENTS
Page
Introduction ... . ... .... 6
Chapter 1: The Biotechnology Industry ... 10
Geographic Distribution... 11
Financing/Commercialization Strategies... 13
Production Processes... ... .. 15
The Product-Cycle Concept... 18
Biotechnology Industry Product-Cycle...20
Comparison of Biotechnology and Microelectronics Industries... 21
Space Requirements ... .... 21
Massachusetts Biotechnology Industry ... 23
Labor Factors... ... 2 5 Massachusetts Survey... 26
Chapter 2: Industrial Location Theory and Locational Decision-Making...30
Methodologies... ....- 30
Neoclassicist... ... ...30
Behavioralist... ... 33...33
Structuralist... ... .. 34
Manufacturing Location Search and Decision-Making... 35
Location Factors in Industry in General... 36
Location Factors in High-Technology Industry... 41
Comparison of Location Factors in Biotechnology, High-Technology, and General Industry ... 43
Location Framework for the Biotechnology Industry... 46
Neoclassicist Issues... 47
Behavioralist Issues ... .... 49
Structuralist Issues ... 50
S u m m a ry ... . 5 1 Chapter 3: Case Studies... 53
Study A: BASF Bioresearch Corporation... 53
Company Identity... 53
Company History ... 53
Manufacturing Location Decision... 55
General Business Strategy... 57
F ina ncing ... . 5 7 Study B: Genzyme Corporation ... 57
Company Identity... 57
Company History ... 58
G eneral Business Strategy... 61
Financing... - .... 62
Study C : Alpha-Beta Technology ... 62
Com pany Identity... .. ... 62
Com pany History ... 63
M anufacturing Location Decision... 63
G eneral Business Strategy... 65
Financing... ... . ... 66
Study D: Com pany X... 66
Com pany Identity... 66
Com pany History ... 67
M anufacturing Location Decision... 68
Future M anufacturing Plant Siting ... 70
G eneral Business Strategy... .. 71
Financing... ... ..72
Study E: Biogen ... 72
Com pany Identity... 72
Com pany History ... 73
M anufacturing Location Decision... 74
G eneral Business Strategy... 77
Financing... 77
C hapter 4: A nalysis ... ... ... 78
Individual C om panies' Location Decisions ... 78
BASF Bioresearch Corporation ... 78
G enzym e Corporation... 79
Alpha-Beta Technology... 80
Com pany X ... ... .... 80
Biogen... 80
Correspondence of Observations with the Theoretical Framework...81
Neoclassicist Issues... 81
Behavioralist Issues ... 83
Structuralist Issues ... 83
Locational Decision-M aking ... 85
Chapter 5: Conclusions and Suggestions for Further Research...87
Appendix A : Q uestionnaire... 93
Appendix B: Sum m ary of C hapter 19 ... 98
Appendix C : C ase Sum m ary M atrix... 99 Bibliography... . ... .-1 1 1
INTRODUCTION
This thesis examines the manufacturing locational decisions of five firms in the biotechnology industry in Massachusetts, in order to determine which location decision processes and locational factors are deemed important by these firms and how they are different from or similar to manufacturing decisions and factors of aggregate industry groups and of other high-technology industry groups. Several local biotechnology firms are currently moving to the
manufacturing stage in the product development process, from being primarily engaged in research and development and pilot plant trials. Knowledge of where and how they decide to locate their manufacturing facilities is useful for
other biotechnology industry decision makers, since the industry is in a phase of rapid growth, and other companies will soon need to expand into manufacturing facilities. These companies will be faced with difficult choices, because of the high cost of manufacturing space may be coupled with capital constraints. How some firms have managed their location decision-making process to address growth within their constraints is shown. Finally, the potential location in Massachusetts of these manufacturing facilities has important implications for high-wage manufacturing employment stability.
For this paper, the specific firms surveyed were in the biotherapeutic segment of the industry. The first chapter discusses the biotechnology industry
in general, on a national and state basis, to provide a context for the case studies. The second chapter surveys the location theory and location decision-making literature, which is broadly catalogued in three methodologies:
neoclassicist, behavioralist, and structuralist. To develop a framework for the case studies and analysis, this chapter examines important concepts in each methodology, and relates the biotechnology industry to these methodologies.
In view of the findings in locational literature, I hypothesized that if a firm's overall size is small, and if its manufacturing space needs, both short and long term, are relatively modest, then it will likely remain in an urban location. This
likelihood is based on the known preference of biotechnology firms for proximity of their manufacturing facilities to their research and development sites, and a ability to expand in place, if expansion space needs are modest. However,
much depends on the importance placed within the firm on cost-minimization criteria, and whether economic development assistance is available. I
hypothesized that these small biotechnology firms will tend to stay in urban locations, take advantage of urbanization and localization economies such as proximity to skilled labor and availability of infrastructure, and make location decisions on an informal basis, unless costs are prohibitively high.
I also hypothesized that biotechnology firms with large manufacturing
facility requirements will increasingly decentralize, moving intra-regionally to suburban locations where lower land costs predominate, but more importantly, land is more available. As with small firms, existing urban locations are
attractive for large firm expansion because of labor availability and labor quality there, but the unavailability of appropriate land will discourage siting in urban centers unless government intervention occurs, particularly in the physical assembling of land and in assuming environmental liabilities. Urban land cost
may be an issue; however, cost minimization criteria will not be as important as other business goals for these firms.
The third chapter presents five case studies of Massachusetts biotechnology companies which have made or are about to make a major manufacturing plant location decision. The companies range in size from 90 to
1500 employees; one of them is a division of an international company with
interview protocol; they cover company identity, history, nature of existing space and plant, nature of the manufacturing location decision or decisions, company financing, and business strategy.
The subjects of the five case studies are Massachusetts biotherapeutics firms, which were identified through a recent survey (Malaterre, 1993) as having recently made or being about to make a manufacturing location decision.
Company contacts were individuals recommended by Professor Charles Cooney, co-director of M.I.T.'s Program on the Pharmaceutical Industry, as
industry people willing to talk about their experiences. In one case, the name of the firm, my interview contacts there, and the community location were altered to protect confidential information.
A questionnaire was developed (see Appendix A) as an interview
protocol, based on Roger W. Schmenner's (1982) questionnaire. Face-to-face interviews were conducted with senior corporate staff involved in the location decisions. Additional or follow-up data were gathered through telephone
interviews. It became apparent that, because the biotechnology industry was in its infancy, manufacturing plant rlocation questions were not relevant; in situ expansion or new plant location decisions were the main concerns. The questionnaire was also designed to ask about overall business strategy and goals, because it became clear that how and why location decisions are made are components of an overall business strategy and culture, whether explicitly or implicitly articulated.
The questionnaire has many open-ended, non-quantitative questions and I made an attempt to allow interviewees to tell the story, rather than prompt them for information. Insofar as possible, I asked companies the same
questions. Prior to the interviews, I read about the industry both in
the case study companies are publicly held).
The firms selected do not necessarily represent a cross section of the biotherapeutic segment. They are not only all high growth firms, but three out of the five represent the largest Massachusetts firms in terms of employment. All
have the explicit goal of vertical integration. As a result, functions from research and development through commercial production, at least to bulk protein
manufacture, are desired as in-house activities. Other biotherapeutic firms and other biotechnology firms may choose to remain as research and development labs only, with revenues generated from licensing their proprietary technology, for example. Others may be forced to cede manufacturing autonomy in
alliances or buy-outs because of capital constraints.
In all cases, specific cost data about location decisions were confidential and not available to me. I interviewed one major decision-maker in each
company, and occasionally, a second person involved in the location decision. Firms typically had made several location decisions in their company history; the intent of my questions was to focus on a major plant decision, made
recently, in which commercial-scale manufacturing was a significant component of the plan. For consistency, I limited the study to decisions that dealt with
genetically-engineered biotherapeutics, as opposed to other products. The fourth chapter presents the case study data in a summary matrix, which is analyzed according to the location theory concepts developed in
Chapter 2. The analysis identifies common locational factors across all five firms, identifies differences, and attempts to elucidate the important distinctions across different firms' decisions.
The final chapter draws conclusions from the data and presents some generalizations about biotechnology firms' location decision-making. These generalizations may be useful for other firms about to make similar decisions.
Chapter 1: The Biotechnology Industry
Biotechnology as an industry segment generally includes "those firms which employ the techniques of genetic engineering and molecular biology in the manufacture of peptides, proteins, and other biological materials, for use in
health care, chemical, agricultural, or environmental applications," according to Professor Charles Cooney. For the purpose of this study, biotechnology
companies engaged in biotherapeutics were chosen for analysis. The following information is intended to provide an industry context.
In 1992, the national industry was composed of 1231 companies, with
225 companies publicly traded (Burrill and Lee, 1992). Companies were
typically classified according to their primary markets, defined as follows: Table 1
Segment Percentaae of companies
Human health care--diagnostics 28
(disease detecting products)
Human health care-biotherapeutics 38
(pharmaceutical drug development and manufacture)
Ag-bio (microbial crop protectants, plant 10 genetics, food processing, animal health)
Suppliers to the industry (instrumentation, 16 lab supplies, reagents, other supplies)
Chemical, environmental and services 8
Source: Burrill and Lee (1992) As indicated, 66% of companies were in human health care. As well, human health care companies represented 83% of public companies. Total company growth in numbers from the previous year was modest, from 1107 to 1231, but
employees increased from 70,000 to 79,000. Revenues exceeded $5.9 billion, with research and development expenses at $4.9 billion, and net L= at $3.4
billion. However, product sales growth from the previous year, for public companies, was 31%.
Burrill and Lee (1992) categorized companies by size; small companies
(1-50 employees) predominate, with a 76% share of the industry's overall
employment.
Table 2
Company Size % of Total Industry % of Public Companies
small (1-50) 76 48
mid-size (51-135) 16 31
large (136-299) 6 10
top-tier ( 300) 2 11
Source: Burrill and Lee (1992)
Most companies in all size categories posted losses at the end of 1991, ranging from an average $2.4 million for small companies to $20.9 million for the top tier.
Geographic Distribution
Table 3 shows the distribution of biotechnology companies nationwide. As shown in the table, the San Francisco, New York-Tristate and Boston areas possess the largest concentrations of firms. Companies in these three areas alone employ 36% of the industry's total workforce.
Table 3
Geographic Segment Demographics
Percent of Public company size breakdown Public company market breakdown within industry within within geographic region (percent) geographic region (percent)
region
Chem,
Environ-mental
Ptblic Al Diag- Thera- and
cos. cos. Srnal Mid-size Large Top-tier nostic peutic Ag-bio Supplier Services
San Francisco Bay Area 16 15 39 31 11 19 11 70 8 8 3
New York Tri-State Area 15 11 54 2 15 3 15 76 0 9 0
Boston Area 14 10 33 37 17 13 14 80 3 3 0
San Diego Area 10 8 29 62 9 0 14 67 14 5 0
Washington DC Area 6 9 3D 39 7 15 15 54 15 8 8
Los Angeles/Orange Co. 6 6 50 2 0 25 33 67 0 0 0
Philadelphia/South NJ 5 3 46 18 18 18 0 73 18 0 9 Seattle Area 3 4 43 43 0 14 0 86 0 14 0 Florida 3 2 71 0 0 29 0 100 0 0 0 Minnesota 3 2 86 17 0 17 33 33 0 34 0 Colorado 2 2 6) 20 3) 0 0 80 20 0 0 Michigan 2 2 60 40 0 0 60 0 2) 20 0 Texas 2 4 s 2 25 0 25 50 25 0 0 North Carolina 1 3 67 33 0 0 67 33 0 0 0
Source: Burrill and Lee (1992) In part, these concentrations are a direct result of the history of biotechnology, which had its genesis in university research in molecular biology conducted at Harvard, MIT, Stanford and Caltech, and funded largely by federal agencies. Virtually all biotechnology start-up companies were founded, managed or directed by university professors, beginning with the founding of Cetus in California in 1971. A common model was for an academic to team up with venture capitalists; initially, public stock offerings were not common, nor were limited partnerships or alliances with chemical or pharmaceutical companies until the mid to late 1980's. Pharmaceutical companies (historically
concentrated in the New York-Tristate area) entered the business actively beginning in 1983, in five ways: (1) in-house research labs, (2) contracts with universities and with the professor-initiated companies, (3) licensing and
marketing agreements, (4) limited research and development partnerships, and
(5) equity purchases (Hall et al., 1988).
Financing/Commercialization Strategies
Currently, the biotechnology industry is primarily funded by the equity markets, through private placements, public stock offerings, and corporate
partnerships. Partial acquisition by a pharmaceutical company is an example of the latter; for example, a substantial or controlling portion of a biotechnology company's stock may be purchased by a large pharmaceutical company. Biotechnology companies are also forging innovative alliances with other biotechnology firms, as well as pharmaceutical firms, combining resources with them, or initiating product swaps. In these alliances, companies place
emphasis on royalty percentages and retention of U.S. manufacturing and marketing rights. In some alliances for research and development funding, benchmark payments for specific achievements are made, according to Professor Charles Cooney.
Public equity capital, both initial and secondary public offerings, has been a substantial source of funding. ($3.24 billion was raised in the July 1991 through June 1992 period.) Currently, however, market uncertainties have
dampened these financing activities. President Clinton's signing of the Biodiversity Agreement, and prospective health care reform, with its cost containment provisions, have injected uncertainty into the capital markets. Many firms, even those with proprietary processes or products, fear facing reduction in prospective profits. (Gupta, 1993)
Unlike traditional pharmaceutical companies, biotechnology firms have very little debt financing or internal financing. The primary factors restricting
asset debt financing are: lack of credit-worthiness of the industry due to its annual operating losses (despite its high capital reserves), restrictive Federal
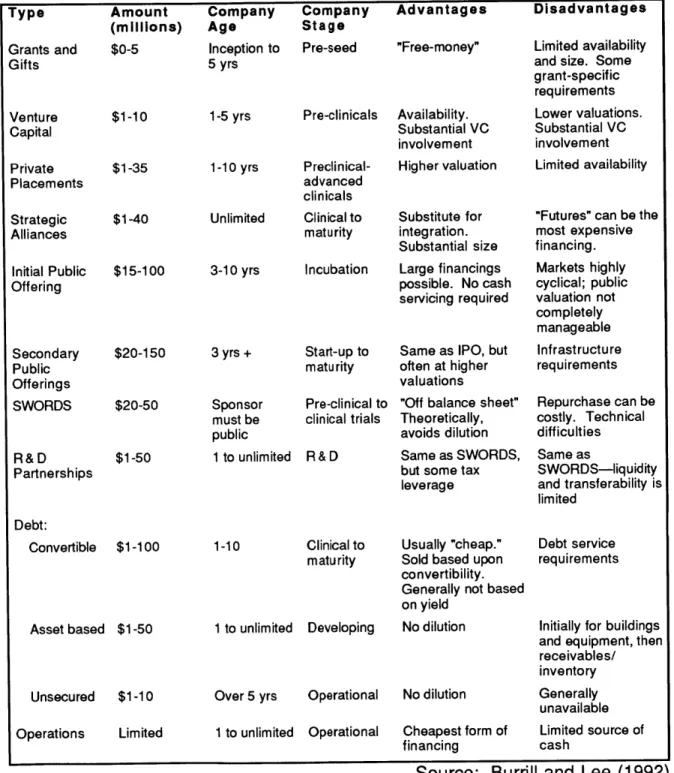
Reserve-imposed bank lending practices on real estate in general, and potential lenders' unwillingness to lend on what are perceived as special purpose properties without potential resale value (NAIOP, 1992). Table 4 describes financing alternatives.
Table 4: Biotechnology Financing Alternatives Type Grants and Gifts Venture Capital Private Placements Strategic Alliances Amount (millions) $0-5 $1-10 $1-35 $1-40 Initial Public $15-100 Offering Secondary Public Offerings SWORDS R&D Partnerships $20-150 $20-50 $1-50 Debt: Convertible $1-100 Asset based $1-50 Unsecured $1-10 Operations Limited Company Age Inception to 5 yrs 1-5 yrs 1-10 yrs Company Company Stage Pre-seed Advantages "Free-money" Pre-clinicals Availability. Substantial VC involvement Preclinical-advanced clinicals Higher valuation
Unlimited Clinical to Substitute for
maturity integration. Substantial size 3-10 yrs 3 yrs + Sponsor must be public 1 to unlimited 1-10 1 to unlimited
Incubation Large financings
possible. No cash servicing required
Start-up to Same as IPO, but
maturity often at higher
valuations
Pre-clinical to
clinical trials R&D
"Off balance sheet"
Theoretically, avoids dilution Same as SWORDS, but some tax leverage
Clinical to Usually "cheap."
maturity Sold based upon
convertibility. Generally not based on yield
Developing
Over 5 yrs Operational
1 to unlimited Operational
No dilution
No dilution Cheapest form of financing
Source: Burrill and Lee (1992) Disadvantages
Limited availability and size. Some grant-specific requirements Lower valuations. Substantial VC involvement Limited availability
"Futures" can be the most expensive financing. Markets highly cyclical; public valuation not completely manageable Infrastructure requirements Repurchase can be costly. Technical difficulties Same as SWORDS-liquidity and transferability is limited Debt service requirements
Initially for buildings and equipment, then receivables/ inventory Generally unavailable Limited source of cash
In an Ernst and Young survey of biotechnology company CEOs, 42% said their goal was fully integrated facilities (conducting all phases from
research and development through commercialization of the product) and 27% wanted to build their own manufacturing facility (Burrill and Lee, 1992). Such vertical integration suggests that the biotechnology firms would remain diverse and independent. Autonomy, retention of proprietary technology, quality control and full capture of profits are some of the benefits of vertical integration. More cautious growth strategies and simultaneous pursuit of multiple product
developments are methods companies use to attain this goal. Financing
arrangements are likely to be "hands-off" corporate partnerships or public stock offerings for these companies; they may also be more aggressive about seeking economic development assistance.
Production Processes
The industry is characterized by complex production processes, a long product cycle (see Table 5 below), and chronic shortage of working capital because of long lead times to commercial production. A noteworthy
characteristic contributing to the long product lead time of the industry, particularly for the biotherapeutic segment, is the level of federal regulation, primarily through the Food and Drug Administration (FDA), whose product testing and approval criteria must be met before pharmaceutical products can be marketed. For these approvals, safety and efficacy of the product, and
process and manufacturing consistency must be demonstrated. It is noteworthy that recently, the FDA has signaled that product cost effectiveness is an
additional criterion for approval.
Table 5 Financing Sources Product Stage Space Requirements
Biotechnology Company Life Cycle
Research Development
0-3 years 4-7 years
$5-10 million $25-60 million Investor seed Corporate money, venture partners, Initial capital public offering Discovery Clinical testing R & D lab space Expanded
administrative, Small manufacturing Commercialization 8-12 years $100+ million Secondary financings, Product sales Market introduction Production facilities
Source: Feinstein Partners, NAIOP (1992)
The production process (through the developmental and commercial-ization phases) is defined and constrained by this regulatory framework, as well as the actual product outcome desired. The regulatory timetable has been described in more detail elsewhere (Belden, 1993; Webb, 1991). An example of the complexity of the production process for an enzyme (a potential
biotherapeutic) is shown in Figure 1. Table 6 details the necessary regulatory steps during the developmental phase.
Strain
development MICROBIAL CELLS
1. Derepression 2. Genetic
engineering
Figure 1. Stages in the production of purified enzymes (Jacobsson et al, 1986).
Table 6
Biotechnology Industry
Approval Cycle for a Medical Therapeutic Product
PHASE GENERAL ACTIVITY
(Preclinical) IND (Clinical Trials) Phase I Phase Il Phase III Final FDA Approval (NDA)
Research and testing on animals for efficacy & toxicity as well as replicating
production
Filing of "Investigative New Drug" application. New data requests could require 6-12 months of additional testing Tests on healthy humans at multiple centers to determine product safety Tests on limited group with the medical problem to determine product safety Test of large numbers of patients to determine product efficacy
Collection, correlation, preparation & submission of test data and product review TOTAL TIME SPAN 1-2 years 1-2 months 1-2 years 1 year 2-3 years 1-2 years 6-10 years
Source: S. Brainard, M. Podsedly, L. Sutlif, "Biotechnology Industry Analysis",
Boston College School of Management (1989); Webb (1991)
The Product-Cycle Concept
The product-cycle concept argues that each stage of a product's
development has different requirements, in terms of management, technology, labor, external economies and capital. It is summarized in the figure below, for manufacturing generally.
Product-Cycle Phase
Requirements Early Growth Mature
Management
W-l
Scientific-Engineeringw
Know-HowUnskilled Labor
ExternalEconomies
Capital
Figure 2. The product-cycle and production inputs. The relative importance of each category of input at each phase in the product-cycle is indicated by the size of the corresponding square. Source: Watts (1987)
Relatively fewer, or more, of various production inputs are required at different phases of the product cycle. The early stage typically requires high levels of scientific and technical inputs, and external economies derived from access to information sources and supplier linkages, for example. Capital investment is low relative to the later stages, because investment in fixed assets, for example, does not occur at the early stage (production runs are short and experimental). At this product stage as well, products and processes are undergoing constant creation and revision, requiring a high input of skilled labor. Greater
management skills and capital are required in the growth phase of a typical company, relative to the early phase, to plan expansion and to invest in capital
equipment. The mature phase is characterized by mass production using a stable technology. The major capital investment required to set up the mass production is offset at this stage by the labor input, which is less skilled relative
to that in the early and growth phases. (Watts, 1987)
Biotechnology Industry Product-Cycle
The biotechnology industry fits the product-cycle pattern overall, with some differences from manufacturing in general. Because of the long times to production, biotechnology firms require more capital in the early phase, relative to manufacturing in general, as well as in the highly automated mature phase.
Scientific, engineering and technical inputs are higher for biotechnology than for a typical low-tech manufacturer through all three phases, and external
economies are typically higher for biotechnology, relative to manufacturing in general, in the growth phase as well. For biotechnology, unskilled labor requirements are lower, relative to those in manufacturing in general, in all three phases. A suggested modification of the product-cycle for the
biotechnology industry is pictured in Figure 3.
Prcoduct-Cycle Phas e
Requirements Early Growth Mature
Management Scientific-Engineering Know-How Unskilled Labor External Economies Capital
Figure 3. Biotechnology product-cycle and production inputs. Biotechnology is represented by the shaded squares; where the relative importance of a
requirement in manufacturing in general, the latter is indicated by a blank square.
Comparison of Biotechnology and Microelectronics Industries
The California biotechnology industry has been compared to another industry in California, microelectronics, partly because both are high-technology industries, and are clustered in the same area (San Francisco). Further
similarities between the two industries include dependence upon a highly skilled labor force, and proximity of both kinds of firms to universities and related research and developement facilities. (Watts, 1987)
Microelectronics differs from biotechnology in having not only a substantially shorter product cycle length, but lower capital requirements as well. In addition, microelectronics companies have had a different history. They were frequently started by engineers who had had prior corporate experience, unlike the biotechnology industry's academics, who generally had no
production or product-marketing experience. (Blakely and Nishikawa, 1991) Microelectronics products are sold as components of more complex systems, whereas many biotech products are.. .sold to end users. The
nature of research and development also differs. With
microelectronics, variations and incremental changes in style and performance characteristics occur, with biotechnology, every product starts from original science.. .biotechnological innovation is not
systemic in nature and compatibility among different processes and products is not an issue. (Blakely and Nishikawa, 1991, pp. 8-9)
Although the industries differ substantially, there are locational factors common to high-technology firms in general, as will be shown in the sections that follow.
Space Requirements
General spatial details should be highlighted: When companies start, lab bench space (2000-5000 square feet) for several research scientists is the space requirement. When clinical trials begin for fermentation-based products, for example, companies require pilot plants, ranging in size from 5000 to 20,000 square feet, to support 50-100 liter production batches for these trials. These
plants may be an expansion of the laboratory space used for basic research, or may be located in a separate pilot plant facility, often in the same building as the research and development function. After the FDA approves a product license, a 10- to 1000-fold scale-up of the production process occurs in a separate, dedicated manufacturing plant of 50,000 to 200,000 square feet. Before a plant can actually start marketable production, a GMP (good manufacturing practices) certification is required from the FDA, as well as a plant and process license,
and an establishment license application approval (ELA), typically engendering an additional six-month delay in production after facility construction is
completed. Once these FDA manufacturing approvals are gained, it is typically easier to amend them for new product manufacturing than to start the process anew at a new plant location. (Webb, 1991)
Costs associated with manufacturing plant construction range from $300 to $1000 per square foot (NAIOP, 1992). In general, functional areas at the
manufacturing plant are divided into bioreactors, purification, quality control and quality assurance, HVAC, and warehousing. They are typically two- to
three-story, new structures. Retrofitting of existing industrial buildings occurs, but is usually not cost-effective because of high floor-to-ceiling height requirements and high floor load requirements. Ceiling heights must be designed to accommodate specialized HVAC systems to control particulate flow,
temperature and humidity in production areas. Energy and plumbing systems are specialized as well. For some products, sterility must be maintained
through installation of seamless stainless steel equipment, provision of a sterile water processing plant and special treatment of waste before it is discharged
into the public sewer system (Belden, 1993).
As noted above, the rigor and expense of plant requirements are dependent on the process used and product manufactured. In addition,
biotherapeutics are typically low-volume high-value products, and thus have low shipping costs. The effect of transport costs on the manufacturing location decision will be described in the section that follows.
Massachusetts Biotechnology Industry
The biotechnology industry in Massachusetts mirrors the industry nation-wide. The commonwealth possessed approximately 128 firms in 1992,
representing 10% of all companies, with 80% concentrated in the
biotherapeutics market segment. Fifty percent of the firms are small and mid-size companies, having 135 or fewer employees. Employment in 1992 was estimated at 13,530, with total sales of $471 million posted in 1991 (Malaterre,
1993; Burrill and Lee, 1992).
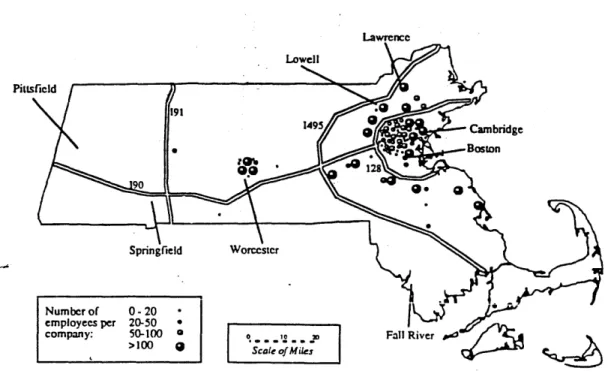
Figure 4 shows the location of Massachusetts biotechnology companies; firms are predominantly in urban areas or on major highways. Zoning or board of health regulations are formally in place in these communities (approximately
25 state-wide), explicitly to regulate genetic engineering research. These
regulations typically incorporate by reference NIH guidelines regarding the use of recombinant DNA, and provide for a local inspection board. (Recombinant
DNA technology is subject to an extraordinary degree of regulation because it is
relatively new and radical; fermentation and enzyme technologies are older.) Adoption of such regulations by a community sends a signal to the
biotechnology industry that it is encouraged to locate there (Griffith, 1992).
Piusficld
Number of 0-20 employecs per 20-50 *
company: 50-100
[
,o Fall River>100 9 '
Figure 4. Location of Massachusetts biotechnology firms (Malaterre, 1993). Massachusetts firms occupy about 7 million square feet of lab, office or manufacturing space, with 3 million square feet in institutional use in the Boston area around major research hospitals, and 4 million square feet in corporate use. Of this corporate square footage, 1.8 million are in Cambridge and 0.7 million are in the Worcester area. Institutions are usually owners and
corporations typically lessees of the space. In Massachusetts, biotechnology laboratory space is fully occupied, with unmet demand estimated at 0.4 million square feet in Cambridge and 0.35 million square feet in Worcester. Projected additional demand is estimated at 8.1 million square feet by the year 2000 for all types of biotechnology facilities (NAIOP, 1992).
The real estate development community has already identified sites in Boston, Cambridge, Worcester/Shrewsbury and other communities. These
sites can support the 8-9 million square feet of projected demand (Feinstein,
1992). However, most Massachusetts firms are still in the research and
development or clinical trials stage, and find it impossible to access asset debt financing for construction of base facilities or for tenant improvements. The lack of credit enhancement to secure such financing is seen by the Massachusetts real estate development community as one of the major obstacles to the construction of biotechnology facilities (NAIOP, 1992).
A variety of state and local economic development policies, financing
and tax initiatives have been catalogued and recommended in other studies, to deal with the specific issue of credit enhancement, as well as the broader issue
of the attraction/retention of biotechnology facilities. Economic development incentives have also been advocated for attracting and retaining manufacturing. The nature and quality of jobs generated, both directly and indirectly, from
manufacturing employment (average salary of over $30,000 and up to 17.5 jobs per $1 million in activity, consistent with the traditional pharmaceutical
manufacturers' job-multiplier effect) have been emphasized (Belden, 1993; Malaterre, 1993; NAIOP, 1992; Webb, 1991; Massachusetts has a variety of programs in place at the local and state level, described by Belden and NAIOP).
A recent development in Massachusetts economic development
incentives has been the passage of legislation (M.G.L., Chapter 19, in March
1993). Three components of this new legislation that have important
implications for the biotechnology industry are: the creation of an Emerging Technology Fund, an increase in the investment tax credit, and tax increment financing, according to Joseph Donovan of the Massachusetts Office of Business Development (Appendix B more fully describes these programs).
Labor Factors
Massachusetts biotechnology employment is currently at about 13,530,
as noted above. The projected employment in various functions is shown in Table 7.
Table 7
Employment Evolution in Massachusetts Biotechnology (estimated number of employees)
1992 1995 2000
Employ. (%) Employ. (%) Employ. (%)
R & D 5,610 (42) 7,800 (41) 11,000 (36)
Manufacturing 5,370 (39) 7,500 (40) 13,200 (44) Administration 2.550 (19) 3.450 (19) 5.700 (20) TOTAL 13,530 (100) 18,750 (100) 30,000 (100)
Source: Malaterre (1993) Skill levels of workers are estimated as over 90% with bachelors degree or higher at the research and development stage in the product cycle, 66% at the pilot plant stage and 43% at the commercial plant stage. Total employees in
a pilot plant averaged 41, and at a commercial plant, 53. The commercial plant, with automated production processes and larger unit operations, requires fewer employees per unit of output than the pilot plant.
Massachusetts Survey
Malaterre completed a survey in late 1992 of 40 Massachusetts
biotechnology firms, asking them to rank the importance of various locational factors, for both research and development and manufacturing facilities. The
strengths and weaknesses of Massachusetts vis
A
vis locational factors were also surveyed. His summary tables are reproduced below:Table 8
R & D Facility Location Factor
(ranked by mean response of the total sample)
Locational Factors Massachusetts
(1 =very important, Strengths/weaknesses 5=not important) (1 =strength, 3=weakness) Mean Variance Mean Variance
Proximity to universities 1.5 0.4 1.1 0.1
Proximity to medical institutions 1.7 0.7 1.1 0.1 Availability/cost of space for expansion 2 0.9 2.3 0.5 Availability/cost of existing facility 2.1 0.9 2.2 0.4
State government attitudes 2.1 1 2.3 0.6
Local government attitudes 2.1 1 2.2 0.4
History of local regulations 2.3 1.1 2.2 0.4
Reasonable cost of living 2.4 0.9 2.7 0.3
Availability/cost of land 2.5 1.1 2.4 0.4
Proximity to other R&D biotech firms 2.6 0.9 1.2 0.1 Founder/CEO wanted to live in area 2.8 2.2 1.7 0.3
Infrastructures/Transportation 2.8 0.7 1.8 0.5
Cultural facilities 2.8 1.3 1.2 0.2
Access to venture capital funds 3.1 1.8 1.6 0.3
Availability/cost of incubator facility 3.1 1.9 2.1 0.4 Proximity to technology transfer center 3.3 1.5 1.6 0.3 Proximity to post-high voc./tech. schools 3.3 1.4 1.8 0.2
(Total sample = 40)
Table 9
Manufacturing Facility Location Factor (ranked by mean response of the total sample)
Locational Factors (1=very important, 5=not important) Mean Variance Massachusetts Strengths/weaknesses (1 =strength, 3=weakness) Mean Variance Availability/cost of space for expansion
Availability/cost of land Proximity to firm R&D facility State government attitudes Availability/cost of existing facility
Labor cost
Reasonable cost of living Local government attitudes Cost of utilities
Majority of employees live near site History of local regulations
Infrastructures/Transportation
Proximity to post-high voc./tech. schools State/local training programs
Proximity to universities
Proximity to other manufacturing biotech f
Proximity to medical institutions Cultural facilities
Founder/CEO wanted to live in area Proximity to major customers
(Total sample = 40) firms 1.8 1.9 2 2 2.1 2.1 2.1 2.2 2.3 2.3 2.4 2.4 2.5 2.6 2.6 2.8 3.2 3.2 3.3 3.4 0.7 0.7 0.7 1 1 0.6 0.8 1 0.6 0.8 1. 0.6 1.1 0.6 0.7 0.7 1.2 1.3 2 0.9 2.4 2.4 1.6 2.4 2.3 2.4 2.4 2.2 2.3 1.7 2 1.9 1.9 2.1 1.4 1.6 1.4 1.4 1.7 1.9 0.5 0.4 0.4 0.5 0.3 0.2 0.3 0.3 0.3 0.3 0.3 0.4 0.4 0.3 0.2 0.4 0.2 0.3 0.2 0.2 Source: Malaterre (1993) For research and development facilities, the most important location factors were: proximity to knowledge centers (universities and medical institutions); availability and cost of both existing space and space for
expansion; and government attitudes, described in the questionnaire as taxes, financing, or regulations. In contrast, for manufacturing facilities, availability and cost factors, for expansion space and land, had priority. Proximity to the firm's
research and development facility was rated as the third most important location factor, and state government attitudes fourth. Significantly, labor and utility
costs, which were not considered important locational factors in research and development facility siting, were viewed as important for manufacturing.
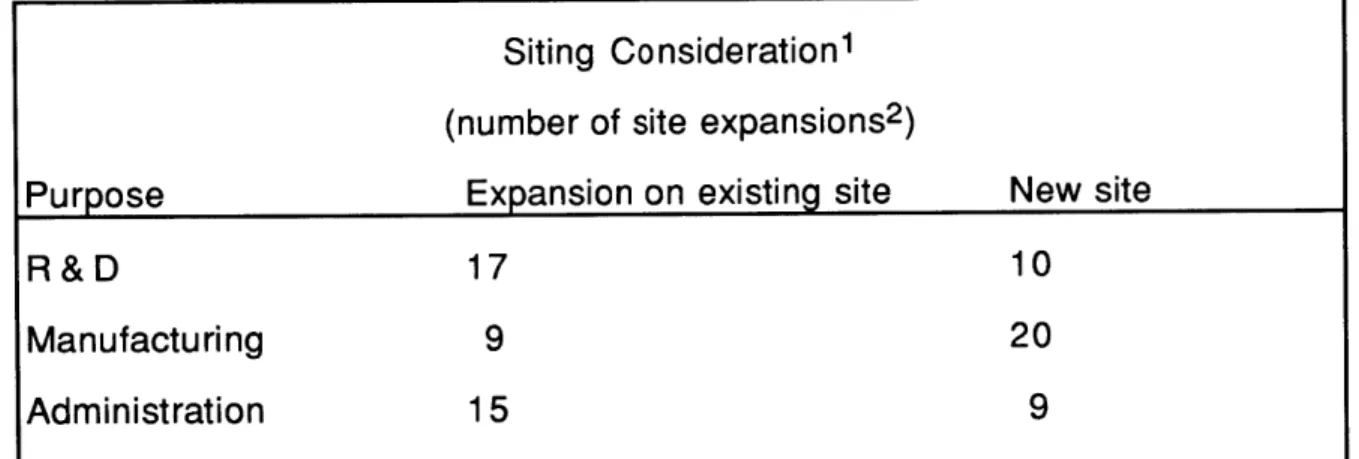
Another finding of the Malaterre survey was that manufacturing expansion was planned more frequently on new sites, while research and development expansion was planned on existing sites. This finding is logical, given the greater space requirements of manufacturing over research and development. Table 10 presents siting data.
Table 10 Siting Consideration1
(number of site expansions2)
Purpose Expansion on existing site New site
R&D 17 10
Manufacturing 9 20
Administration 15 9
1 Companies were asked if they were planning a site expansion, on their existing site or on a new site. The answers were not designed to be exclusive. Thus, a very entrepreneurial company could perfectly respond that they were planning to expand at their existing site for all purposes, as well as at a new site for the same reasons.
2Total sample = 40
Source: Malaterre (1993)
Malaterre also found that Massachusetts is ranked by 92% of the companies as the preferred site for manufacturing siting; however adjoining states, California, Puerto Rico and foreign countries (Ireland, France) were also
Chapter 2: Industrial Location Theory and
Locational Decision-Making
Why and how firms make the location decisions they do, and what factors
are important determinants of the decision, are the subjects of an extensive literature of location theory and locational decision-making. The literature can be divided into three general methodologies, neoclassicist, behavioralist, and structuralist; the first part of this chapter is a brief description of each. In a second part, I review studies of the locational decisions of manufacturing firms, large and small, general and high-technology. The cited studies, while not exhaustive, provide a conceptual framework for analyzing the locational decisions of biotechnology firms in Massachusetts, the subject of the third and final part of this chapter.
METHODOLOGIES Neoclassicist
Studies employing this methodology are highly quantitative, and follow the seminal econometric work of Alfred Weber (1929). Weber posited that firms
would locate in response to transport, labor availability and the
advantages/disadvantages of clustering with other industries, at least cost locations, for assembling raw materials and distributing output. Weber
theorized that if labor productivity gains (savings in labor cost per unit of output) exceeded the extra transport cost involved, a firm could be attracted to a
different location. He also noted the possibility that agglomeration economies can lure a firm away from its minimum transport and labor cost location. Weber considered that these economies (or diseconomies) arose from internal or external economies of scale, concentration or diffusion of labor skills, selling
prices (cited by Cooper, 1974).
To explain why economic activity is attracted to certain locations, Hoover further refined agglomeration into three distinct components: localization, urbanization, and scale (cited by
0
hUallachbin and Satterthwaite, 1992).Localization economies are the tendency in some industries for a firm to have lower costs if located in the same area as others in its industry. Urbanization economies are the advantages large cities have in infrastructure, available services, and larger labor markets. Economies of scale lower unit production costs as the rate of production increases.
Later theorists criticized Weber's assumptions of given production costs, perfect competition, and given market conditions. Alonso (1964, 1967) showed that transport costs are not proportional to distance and theorized that the price of land is the most important determinant of location. He interpreted the
suburbanization of automated manufacturing firms as a Weberian cost-minimization strategy, but with land price driving the location decision.
Further econometric elaborations in the Weberian tradition, at both the intrametropolitan and interregional scale, followed. Goldberg (1969) and Keeble (1984) found that space constraints limit the growth a plant can
experience, and that lack of land availability is usually considered the premier reason for a firm's relocation. Foster (cited by Pacione, 1985), in a 1972 interregional study, found that labor costs can vary significantly in space and employers will have to pay more the further they are from labor's residence. Struyk and James (1975), in an intrametropolitan study, noted that
manufacturing employment exhibits a high degree of mobility; that increased decentralization was found in manufacturing firms; and that the spatial
clustering of related firms and the employment characteristics of the urban area influence locational behavior of firms. Czamanski (1974) refined the
agglomeration economies theory by studying industrial clusters. They developed the argument that major cities derive capital benefits from close
proximity and short linkages between related industries. The main influences shaping modern location decisions, in their view, are technical and societal characteristics of the man-made environment (such as what industries are already present, and what technical competencies exist within them), rather than physical features like raw material availability or transport costs.
Moriarty (1980) noted the importance of cost of labor and availability of labor in locational choice. However, Czamanski (1981) asserted that it is not the cost or availability of labor, but rather the "distribution of skills, productivity and lack of labor disputes" that is important. Lever (1972) pointed out that the ultimate rationale in neoclassicist theory is that firms will locate where profits are
highest, and that firms avoid large urban centers where land costs are highest. Labor costs may be higher away from cities, but more efficient use of labor is possible there. (In a more recent study, Kowalski and Parakevopoulos (1990) showed that submarket segmentation, as well, was an important determinant of land price, as was the land's expressway exposure.)
Wasylenko (1980) found that local property tax differentials were important determinants of manufacturing relocation. In addition, Mullen and Williams (1990) note that the educational profile of the workforce can partially account for labor efficiency growth and thus for interurban variations in
productivity gain.
The costs of land, labor, taxes, and transport-as well as agglomeration economies associated with industry clustering, infrastructure, and the
educational level, skill, and productivity of labor-all affect the locational decision. Urban space constraints also play a role. These factors are in general viewed by the neoclassicists as producing a cost-minimizing location
result. It should be emphasized here that in the location decision, these factors typically do not all point in the same direction. For example, economies
associated with skilled labor clustered in an urban setting are typically offset by higher urban land prices, resulting in a manufacturing move to a suburban location. However, the localization economies associated with the
biotechnology industry may offset the urban land cost factor. This issue will be discussed in more detail below. A mixed result, with some biotechnology firms remaining in urban locations, and others moving to suburban locations, can be expected, depending on the individual firms' needs and constraints.
Neoclassical factors are not discarded in the theoretical frameworks of the behavioralists and structuralists that follow, but rather are embedded in them.
Behavioralist
Criticisms of the neoclassicist models of location, viewing an omniscient, rational "economic man" as an impossible decision-making ideal, resulted in a series of behavioral studies. Pred (1969) used a behavioral matrix to illustrate that the better the information that is available and the better the ability to use it, the more likely the location chosen would be the point of maximum profit.
However, he pointed out that firms work with imperfect information and information availability. His work was based on that of Simon (1955), who found that some firms (optimizers) seek to maximize profits, while others (satisficers) seek to make sufficient profits; and on that of Rawston's (1958) concept of spatial margin to profitability-the idea that different process technologies have different cost and revenue structures, which can direct
location. Krumme & Wood (cited by Pacione, 1985) found that firms use little information in locational choice decision-making. They distinguished between large and small firms, and noted that large firms do not have to make locational choices on cost minimization criteria. Cyert & March (1963) took the position
that multiple business goals exist (particularly in a large organization): growth, security, risk minimization, entrepreneurial satisfaction, self-preservation, as well as profit maximization. These goals will affect locational choice, even if full information is available about a profit-maximizing location. They also found that social and environmental preferences may weigh more heavily with small firms' locational decisions than with large ones'. Duncan (cited in Pacione, 1985) viewed the location decision-making environment in terms of a scale of increasing uncertainty and risk. The more firms can control external
environmental elements (including price of inputs, products and flow of capital, labor and land), the more they can reduce the element of risk.
Thus, while acknowledging the neoclassicists' view that factor cost minimization criteria were important, the behavioralists incorporated the individual decision makers' values and preferences. At the same time, they recognized the imperfection of information use, particularly in forecasting the future.
Structurallist
Massey (1974, 1984) felt that the behavioralists did not take an adequately wide view of social forces and the macro-economy. As an alternative approach to neoclassicist theory, Massey's new conceptual view was that firms are part of a wider societal structure where labor and capital are in conflict. The firm is not abstracted as a model in itself, but "explanations of locational change are sought in the structure of the capitalist society in which the firm works" (Watts, 1987, p. 14). Massey recognized that different types of firm react in different ways. Large firms create their own distinctive patterns, and smaller firms react to the existing environment. Bluestone & Harrison (1982)
noted firms were fleeing from unionized areas in the U.S. on a regional level. Bull (cited by Pacione, 1985) found that suitable labor, premises and relative
accessibility are important, and that most manufacturers rent. Thus, in the short and medium term, the property available for rent places constraints on
manufacturing. Fothergill & Gudgin (1982), like the neoclassicists Goldberg and Keeble, also noted spatial constraints on in situ expansion in urban areas, typically leading to firms leaving urban premises. They also found growth in the
number of multi-plant firms, which are less constrained locationally because national or international profitability decisions are made outside of existing locations (for example, decisions are based to some degree on lower tariffs, access to international markets, and lower factor costs).
Locational studies dealing with capital issues are not numerous, in large part because of the perception that capital operates in a national market. One,
Estall's 1972 study, showed that venture capital promoted science research and development in Boston and Philadelphia, however (cited by Watts, 1987).
All three conceptual frameworks deal either explicitly or implicitly with
factor cost minimization, labor force quality, and agglomeration economies. However, the behavioralists acknowledge the human element of preference and imperfect use of information, and the structuralists incorporate the firm's situational dynamics within the macroeconomy-politics or capital market conditions, for example.
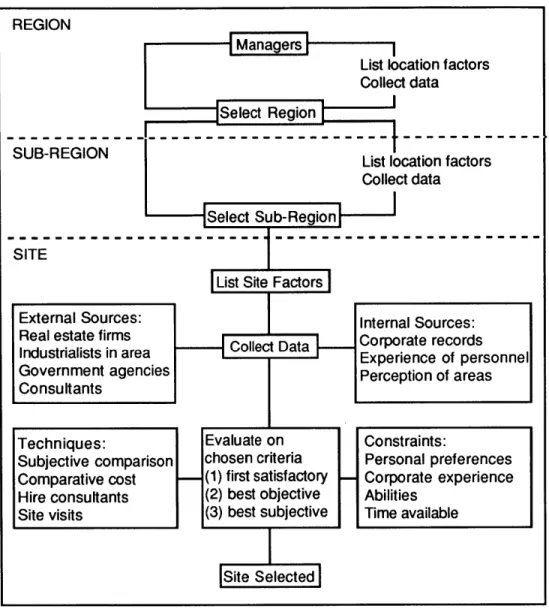
MANUFACTURING LOCATION SEARCH AND DECISION-MAKING Once a decision to locate a manufacturing plant at a new location has been made, the subsequent location decision-making process typically proceeds in three stages, according to Watts (1987). The process is diagrammed in Figure 5.
REGION
Select Region
SUB-REGION List location factors
Collect data
- Select Sub-RegionI I
SITE
List Site Factors
External Sources: Internal Sources:
usral ss in area Collect Data Corporate records
Government agencies Perception of areas
Consultants
Techniques: Evaluate on Constraints:
Subjective comparison chosen criteria Personal preferences Comparative cost (1) first satisfactory Corporate experience Hire consultants (2) best objective Abilities
Site visits (3) best subjective Time available
|s ite
Selected|Figure 5. A three-stage industrial location decision sequence. This assumes a decision to move has already been made, and that a new facility, or relocation of an existing facility is needed. From Watts (1987).
In this section, I review the literature on the particular factors influencing location decisions in industry in general, and in high-technology industry. This review forms the basis of a comparison with the studies of locational factors in the biotechnology industry cited in Chapter 1.
Location Factors in Industry in General
The manufacturing location search and decision-making processes have been described by Schmenner (1982), Stafford (1974), and Cooper (1975). In
a survey of 484 executives, Schmenner found that the location decision was actually three decisions: whether to add capacity, how to add it (through in situ expansion, new plant construction or relocation) and where to site. In situ expansion was preferred because lower costs were associated with it. Both formal and ad hoc planning for the location decision occurred, with ad hoc
planning most likely in smaller firms, which were also most likely to stay close to their initial sites.
Schmenner identified six dominant concerns or factors in the decision: labor costs, labor unionization, proximity to markets, proximity to
suppliers/resources, proximity to other facilities of the company, and an area's quality of life. Stafford's study also found amenities and personal contacts to be important in the search, and that firms frequently confined their searches to areas where they already operated. Thus, Schmenner and Stafford's findings are consistent with the work of the neoclassicists in their cost and proximity concerns; of the behavioralists in the importance placed on quality of life,
amenities and personal contacts; and of the structuralists in labor unionization concerns.
Schmenner also found that different factors were emphasized differently depending on the scale (i.e. regional, state, or site) of the decision. For
example, he found that taxes had little effect on short-distance movers and land costs were less important for them as well, compared to long-distance movers. (See Tables 11, 12, and 13). He also found that 40% of location decisions were
not formally costed out, and that government regulations and their cost, as well as the retention or attraction of managerial talent, were sometimes neglected in
location decisions.
Table 11
Constraints on the Region/State Choice: Factors Viewed as "Musts"-All Industries Factor Percent of Plant Openings Percent of Movers
Citing at Least 1 Factor Citing at Least 1 Factor
Favorable labor climate 76 39
Near market 55 0
Attractive place for engineers/ 35 19
managers to live
Near supplies, resources (includes 31 28
energy
Low labor rates 30 19
Near existing facilities of division/ 25 17
company
Environmental permits 17 8
Facility/land already available 3 6
Better transportation 2 0
Taxes, financing 1 0
Retaining current labor force 0 56
Community attitude 0 3
Source: Schmenner (1982) Table 12
Constraints on Final Site Selection: Factors Viewed as "Musts"-All Industries Factor Percent of Plant Openings Percent of Movers
Citing at Least 1 Factor Citing at Least 1 Factor
Rail service 47 25
On expressway 42 31
Special provision of utilities 34 22
(gas, sewerage, water)
Rural area 27 19
Environmental permits 23 3
Within metropolitan area 21 39
On water 16 11
Available land/building 8 11
Transportation (airport 3 3
truck service
Community financing, support 1 0
Proximity to other division plant 1 3
Minimum acreage 1 0
Non-union site 1 0
Table 13
Influences on Site Selection: Factors Viewed as "Desirable, if Available"-All Industries
Factor Percent of Plant Openings Percent of Movers
Citing at Least 1 Factor Citing at Least 1 Factor
Favorable labor climate 76 44
Low land costs 60 50
Near markets 42 22
Low taxes 35 19
On expressway 35 28
Rail service 30 22
Low construction costs 29 33
Low wage rates 28 25
College nearby 26 14
Low energy costs 25 14
Government help with roads, 25 3
sewerage, water, labor training
Near suppliers 23 25
Government financing 13 6
Available land/buildings 3 11
Near other division facilities 3 3
Air transportation 1 0
Quality of life 1 0
Retain labor force 0 3
Number of plants citing at least 159 36
one factor
Source: Schmenner (1982) In addition, Schmenner pointed to the apparent importance of "business
climate", a factor which he described as follows:
I am persuaded that personal preference and "business climate" still
play a role in at least some location decisions. "Business climate" constantly eludes precise definition because it means different things to different people, yet for all it remains a rough metric of a location's expected ability to maintain a productive business climate: the attitude of working people to hard work, to quality work, to
unionization; the attitude of government to business, as reflected in government aid in solving joint problems, and in regulations, tax
rates, and financing; the attitude of government in managing itself, its services, its schools. A location's perceived business climate is
markedly self-perpetuating and hence difficult to turn around, but there is no doubt that it does exert influence on new plant location decisions. (Schmenner, 1982, p. 53)