Analytic scaling analysis of high harmonic
generation conversion efficiency
The MIT Faculty has made this article openly available.
Please share
how this access benefits you. Your story matters.
Citation
E. L. Falcão-Filho, M. Gkortsas, Ariel Gordon, and Franz X. Kärtner,
"Analytic scaling analysis of high harmonic generation conversion
efficiency," Opt. Express 17, 11217-11229 (2009)
As Published
http://dx.doi.org/10.1364/OE.17.011217
Publisher
Optical Society of America
Version
Author's final manuscript
Citable link
http://hdl.handle.net/1721.1/49436
Terms of Use
Creative Commons Attribution-Noncommercial-Share Alike
Analytic scaling analysis of high harmonic
generation conversion efficiency
E. L. Falcão-Filho, V. M. Gkortsas, Ariel Gordon and Franz X. Kärtner * Department of Electrical Engineering and Computer Science and Research Laboratory of Electronics, Massachusetts
Institute of Technology, 77 Massachusetts Ave. Cambridge, Massachusetts 02139, USA
Abstract: Closed form expressions for the high harmonic generation
(HHG) conversion efficiency are obtained for the plateau and cutoff regions. The presented formulas eliminate most of the computational complexity related to HHG simulations, and enable a detailed scaling analysis of HHG efficiency as a function of drive laser parameters and material properties. Moreover, in the total absence of any fitting procedure, the results show excellent agreement with experimental data reported in the literature. Thus, this paper opens new pathways for the global optimization problem of extreme ultraviolet (EUV) sources based on HHG.
2009 Optical Society of America
OCIS codes: (260.7200) Ultraviolet, extreme; (020.2649) Strong field laser physics.
References and links
1. Ch. Spielmann, N. H. Burnett, S. Sartania, R. Koppitsch, M. Schnürer, C. Kan, M. Lenzner, P. Wobrauschek and F. Krausz., “Generation of coherent X-rays in the water window using 5-femtosecond laser pulses,” Science 278, 661-664 (1997).
2. Z. Chang, A. Rundquist, H. Wang, M. M. Murnane, and H. C. Kapteyn, “Generation of coherent soft X rays at 2.7 nm using high harmonics,” Phys. Rev. Lett. 79, 2967-2970 (1997).
3. J. Seres, E. Seres, A. J. Verhoef, G. Tempea, C. Streli, P. Wobrauschek, V. Yakovlev, A. Scrinzi, C. Spielmann and F. Krausz, “Source of coherent kiloelectronvolt X-rays,” Nature 433, 596-596 (2005).
4. E. Goulielmakis, M. Schultze, M. Hofstetter, V. S. Yakovlev, J. Gagnon, M. Uiberacker, A. L. Aquila, E. M. Gullikson, D. T. Attwood, R. Kienberger, F. Krausz, and U. Kleineberg, “Single-cycle nonlinear optics,” Science, 320, 1614-1617 (2008).
5. L.-H. Yu, M. Babzien, I. Ben-Zvi, L. F. DiMauro, A. Doyuran, W. Graves, E. Johnson, S. Krinsky, R. Malone, I. Pogorelsky, J. Skaritka, G. Rakowsky, L. Solomon, X. J. Wang, M. Woodle, V. Yakimenko, S. G. Biedron, J. N. Galayda, E. Gluskin, J. Jagger, V. Sajaev, and I. Vasserman, “High-gain harmonic-generation free-electron laser,” Science 289, 932-934 (2000).
6. E. A. Gibson, A. Paul, N. Wagner, R. Tobey, D. Gaudiosi, S. Backus, I. P. Christov, A. Aquila, E. M. Gullikson, D. T. Attwood, M. M. Murnane, and H. C. Kapteyn, “Coherent soft x-ray generation in the water window with quasi-phase matching,” Science, 302, 95-98 (2003).
7. I J. Kim, C. M. Kim, H. T. Kim, G. H. Lee, Y. S. Lee, J. Y. Park, D. J. Cho and C. H. Nam, “Highly efficient high-harmonic generation in an orthogonally polarized two-color laser field,” Phys. Rev. Lett. 94, 243901 (2005). 8. R. J. Jones, K. D. Moll, M. J. Thorpe and J. Ye, “Phase-coherent frequency combs in the vacuum ultraviolet via
high-harmonic generation inside a femtosecond enhancement cavity,” Phys. Rev. Lett. 94, 193201 (2005).
9. P. B. Corkum, “Plasma perspective on strong-field multiphoton ionization,” Phys. Rev. Lett. 71, 1994-1997 (1993). 10. M. Lewenstein, Ph. Balcou, M. Y. Ivanov, A. L'Huillier and P. B. Corkum, “Theory of high-harmonic generation by
low-frequency laser fields,” Phys. Rev. A 49, 2117-2132 (1994).
11. P. Salières, P. Antoine, A. de Bohan and M. Lewenstein, “Temporal and spectral tailoring of high-order harmonics,” Phys. Rev. Lett. 81, 5544-5547 (1998).
12. N. H. Shon, A. Suda, and K. Midorikawa, “Generation and propagation of high-order harmonics in high-pressure gases,” Phys. Rev. A 62, 023801 (2000).
13. M. B. Gaarde and K. J. Schafer, “Space-time considerations in the phase locking of high harmonics,” Phys. Rev. Lett. 89, 213901 (2002).
14. E. Priori, G. Cerullo, M. Nisoli, S. Stagira, S. De Silvestri, P. Villoresi, L. Poletto, P. Ceccherini, C. Altucci, R. Bruzzese and C. de Lisio, “Nonadiabatic three-dimensional model of high-order harmonic generation in the few-optical-cycle regime,” Phys. Rev. A 61, 063801 (2000).
15. G. Tempea and T. Brabec, “Optimization of high-harmonic generation,” Appl. Phys. B 70, S197 (2000).
16. J. Tate, T. Auguste, H. G. Muller, P. Salières, P. Agostini, and L. F. DiMauro, “Scaling of wave-packet dynamics in an intense midinfrared field,” Phys. Rev. Lett. 98, 013901 (2007).
17. P. Colosimo, G. Doumy, C. I. Blaga, J. Wheeler, C. Hauri, F. Catoire, J. Tate, R. Chirla, A. M. March, G. G. Paulus, H. G. Muller, P. Agostini and L. F. DiMauro, “Scaling strong-field interactions towards the classical limit,” Nat. Phys. 4, 386-389 (2008).
18. C. Vozzi, F. Calegari, F. Frassetto, E. Benedetti, M. Nisoli, G. Sansone, L. Poletto, P. Villoresi and S. Stagira, “Generation of high-order harmonics with a near-IR self-phase-stabilized parametric source,” Proceedings of Conference on Ultrafast Phenomena, FRI2.2 (2008).
19. V. S. Yakovlev, M. Y. Ivanov and F. Krausz, “Enhanced phase-matching for generation of soft X-ray harmonics and attosecond pulses in atomic gases,” Opt. Express 15, 15351-15364 (2007).
20. A. Gordon and F. X. Kärtner, N. Rohringer and R. Santra, “Role of many-electron dynamics in high harmonic generation,” Phys. Rev. Lett. 96, 223902 (2006).
21. E. J. Takahashi, Y. Nabekawa, H. Mashiko, H. Hasegawa, A. Suda and K. Midorikawa, “Generation of strong optical field in soft X-ray region by using high-order harmonics,” IEEE J. Sel. Top. Quantum Electron. 10, 1315-1328 (2004). 22. E. Constant, D. Garzella, P. Breger, E. Mével, Ch. Dorrer, C. Le Blanc, F. Salin and P. Agostini, “Optimizing high
harmonic generation in absorbing gases: Model and experiment,” Phys. Rev. Lett. 82, 1668-1671 (1999). 23. M. Schnürer, Z. Cheng, M. Hentschel, G. Tempea, P. Kálmán, T. Brabec and F. Krausz, “Absorption-limited
generation of coherent ultrashort soft-X-ray pulses,” Phys. Rev. Lett. 83, 722-725 (1999).
24. M. Geissler, G. Tempea, A. Scrinzi, M. Schnürer, F. Krausz and T. Brabec, “Light propagation in field-ionizing media: Extreme nonlinear optics,” Phys. Rev. Lett. 83, 2930-2933 (1999).
25. M. V. Ammosov, N. B. Delone, and V. P. Krainov, “Tunnel ionization of complex atoms and atomic ions in a varying electromagnetic-field,” Sov. Phys. JETP 64, 1191-1194 (1986).
26. A. Gordon and F. X. Kärtner, “Quantitative modeling of single atom high harmonic generation,” Phys. Rev. Lett. 95, 223901 (2005).
27. R. Santra and A. Gordon, “Three-step model for high-harmonic generation in many-electron systems,” Phys. Rev. Lett. 96, 073906 (2006).
28. A. Gordon and F. X. Kärtner, “Scaling of keV HHG photon yield with drive wavelength,” Opt. Express 13, 2941-2947 (2005).
29. Lawrence Berkeley National Laboratory (http://henke.lbl.gov/optical_constants/).
30. T. Popmintchev, M. C. Chen, O. Cohen, M. E. Grisham, J. J. Rocca, M. M. Murnane and H. C. Kapteyn, “Extended phase matching of high harmonics driven by mid-infrared light,” Opt. Lett. 33, 2128-2130 (2008).
1. Introduction
For more than a decade, high harmonic generation (HHG) is pursued as a promising route towards a compact coherent short wavelength source in the XUV region [1-3]. Currently HHG is the only experimentally proven method for generating coherent XUV radiation and enables attosecond pulses [4]. Seeding of next generation free electron lasers in the XUV with high harmonics in combination with high gain harmonic generation is assumed to be a viable technique to transfer the coherence properties of the HHG seed to the hard x-ray range [5]. As a consequence, the laboratory concept of an HHG based XUV source is rapidly evolving to reality accelerated by advances in high power femtosecond laser systems and in HHG techniques, such as quasi-phase-matching HHG [6], two-color-HHG [7] and most recently cavity-based HHG [8]. In this context, quantitative scaling and optimization of HHG-based source characteristics is of key importance to accelerate the development and capabilities of this emerging research field.
In parallel to the experimental progress, a considerable effort has been devoted to the theoretical modeling and scaling of HHG [9-15]. Accurate quantitative simulation of the HHG efficiency including propagation effects is time-consuming, making a systematic parameter study impossible. Indeed, up to the present it is not entirely clear how the HHG efficiency scales for different experimental conditions, how far current results are from theoretical limits, and how to proceed to construct a maximally efficient HHG source for a particular range of harmonics. For example, over the last years, the role of the driving frequency, 0, to HHG
scaling has received great attention [16-19]. Dependences of HHG efficiency between 05 and 06 are being obtained from numerical simulations using the time dependent Schrödinger equation [16] including the single-atom response only. Preliminary experimental results
[17,18] are supporting these simulations. General scaling considerations concerning the scaling with drive frequency, including laser wavelength and pressure were presented recently [19], however, no expression for the HHG efficiency and its scaling as a function of all experimentally relevant parameters was presented. This paper gives the first, to our knowledge, closed form analytical expressions for HHG conversion efficiencies both for the plateau region and the cutoff region including both laser and material parameters. Also focusing conditions and related effects, such as intensity dependent phase mismatch, could be included, but is postponed for future work. For the purpose of this paper we consider plane wave geometry.
To this aim we make two simplifying assumptions. First, we use the single-active-electron (SAE) approximation, which is widely adopted. Second, multielectron effects are partially included using the recombination amplitude computed via the Hartree-Slater potential approach [20]. The HHG driven by a plane wave source includes besides the single-atom response the 1-D propagation effects due to absorption and phase mismatch caused by the neutral gas and plasma generation. Experimentally, HHG-setups either use free space focusing into a gas jet or cell or hollow fiber geometry. Considering a loose focusing regime [21] or hollow fiber geometry [6], the phase mismatch due to the Gouy-phase shift and the dipole phase is minimized or absent or are replaced by waveguide dispersion which can also be included in the 1-D model. Thus, even this simplistic model is expected to give upper bounds for the HHG efficiency, as reported in the literature [21-23]. In this paper, the discussion is also restricted to the adiabatic regime which holds for driver pulses as short as 4-optical-cycles excluding strong carrier envelope phase effects [11].
2. Derivation
The one-dimensional propagation equation commonly used for HHG [24] is
) , ( 2 1 2 1 ) , ( ( ) 0 t z E L P e c t z E h abs t z k i h z , (1)
where z is the position coordinate along the propagation direction, k is the phase mismatch, t is the retarded time appropriate for describing propagation at the speed of light in vacuum, E is the electric field of the harmonics, and h P is the polarization induced in the medium. Labs is the absorption length, which later will become frequency dependent to take frequency dependent absorption into account. The driving field is assumed to be a top-hat pulse, represented by elsewhere T t t E t E , 0 0 , ) sin( ) ( 0
0 (2)with time duration, T2N/0, where N means the number of optical cycles.
In the following, we use atomic units, where 40, , the electron mass,m , and its e
charge, e , are set to unity, and the speed of light in vacuum equals the inverse fine structure constant 1137. Defining as the density of atoms (number of atoms per atomic unit volume), Eq. (1) takes the form
) , ( 2 ) 2 ( ) , (zt e ( )x E zt Eh i kz h z , (3)
where is the absorption cross section, x is the dipole moment of a single atom, and
x
xt . With the Fourier transforms of the harmonic field E and the dipole velocity derived h
from the dipole acceleration x:
T i t h h z E zt e dt E 0 ) , ( 2 1 ) , ( ~ , (4)
T t i dt e t x i 0 () 2 1 ) ( ~ , (5)over the finite pulse duration, Eq. (3) becomes
) , ( ~ 2 ) ( ) ( ~ ) 2 ( ) , ( ~ ( ) z E e z Eh i kz h z , (6)
where a frequency dependent absorption cross section is introduced. Note, that we assumed that ~() does not depend on z, i.e. the changes in amplitude and phase of the driving pulse are small over the medium length L . The results can also be applied to a weakly focused Gaussian beam for Lz0, where z is the Rayleigh length. In this case the solution to Eq. 0
(6) is: ) , ( ) ( ) ( ~ 4 ) ( ~ L k g Eh , (7) where: ) ( 2 1 ) , ( ) 2 /( ) ( abs L L L k i L k i e e L k g abs , (8)
and Labs1/(). If the propagation distance is long compared to the absorption length, in general L3Labs is sufficient, and perfect phase matching conditions are satisfied,
1 ) , (k L
g , Eq. (7) approaches its absorption limited value E~h()4~()/().
The conversion efficiency into a given (odd) harmonic of 0, whose frequency is denoted by , is given by
0 2 2 | ) ( ~ | | ) ( ~ | 0 0 d E d Eh , (9) where
T t i dt e t E E 0 ) ( 2 1 ) ( ~ .In order to evaluate the numerator in Eq. (9) we note that x(t), the dipole acceleration of a single atom has the following property:
) ( ) / (t xt x
, (10)with 01. The minus sign on the right hand side of Eq. (10) is due to the sign change in the driving field. Note, that
accounts for the depletion of the ground state amplitudes during each half period defined by |a(t/)|2|a(t)|2 where |a(t)|2 denotes the probability to find the atom in the ground state. Thus, a(/)2 or, in other words:
0 / 0 )) ( ( exp wE t dt , (11)with the ionization rate w(E) calculated by the Ammosov-Delone-Krainov formula [25]. Furthermore, only the first recombination event is taken into account, because quantum diffusion greatly reduces the contribution of multiple returns [10]. Under these assumptions and using Eq. (10) in Eq. (7) and substituting the result into Eq. (9) we obtain
) ( 1 ) 1 ( 1 ) ( ) , ( 2 2 1 4 ) 1 ( 4 2 2 2 0 2 2 2 0 5 0 B e N E L k g N i , (12) where
2 2 5 2 3 0 0 ) (
dt e t x B i t . (13)The choice for the integration interval in (13) follows from the TSM [9, 10], showing that the dominant contribution to the high harmonics occurs in the interval 3/20t5/20. The high harmonics accounted for occur in N1 full cycles, which is the reason for the factor N1 instead of N in the exponent of in Eq. (12). The last quarter of a cycle in the N-cycle pulse is neglected to keep the expression simple. Comparison with a full numerical simulation considering a Gaussian pulse at the end of the paper shows that this approximation even yields good results for a four-cycle non-flat-top pulses.
As discussed above, the SAE approximation is adopted, where the atoms are modeled by a single electron in an effective potential [Eq. (1) in Ref. 26]. In order to obtain a closed-form expression for the efficiency, we use the improved version of the TSM (ITSM) for
x
(t
)
[26].
3/2 () 0 4 / 1 2 / 3 0 4 / 2 / 1 ) ( ) 2 /( 2 ) ( rec n iS t n n n n n P i a k e n tb t tb E tb E w t a tb a I e t x
, (14)where I is the ionization potential, P tb is the birth time of an electron that returns to the n
origin at time t and n denotes the trajectory. Sn(t)Sn
t,tbn
is the semiclassical action andn x n
rec k V r k
a ( )0 ( ) is the recombination amplitude, Eq. (7) of Ref. 20, which is obtained from the Hartree-Slater potential (see Ref. 27 for a more detailed explanation). The term kn(t) is the momentum upon return from of the nth trajectory which is related to the HHG frequency by nIPkn2/2. Notice, that in order to show the HHG scaling with
drive wavelength due to quantum diffusion, we pulled the factor 03/2 in front leaving the
denominator [0(ttbn)/(2)]3/2 dimensionless and largely invariant to drive wavelength.
To evaluate B(), the saddle point method is used. All the terms in Eq. (13), using Eq. (14), are slowly varying except the phase containing the classical action. The stationary phase approximation will give the conditiontSn(t), implying the transition energy of the recolliding electron has to be equal to . This condition is fulfilled twice during each half cycle and is referred as short and long trajectories. As increases approaching the cutoff frequency, cut IP3.17UP, with the ponderomotive energy UP(E0/20)2, the two
trajectories merge. At this point of degeneracy (i.e. cutoff) 2tSn(t)0, and as a consequence
an expansion of the action up to 3rd order is necessary:
6 ) ( 2 ) ( ) ( ) ( 3 3 2 2 n n t n n t n n n ta t S ta t S ta t S t S , (15)
where ta is the arrival time of each trajectory and n SnS
tan,tbn
. Considering theexpansion up to third order, as shown in Eq. (15), it is not possible to find a closed analytical formula for B(). However, by focusing our analysis separately to the plateau region or cutoff region, where either the second or third order term is dominant a closed form expression is achieved.
Thus for the case of cutoff the total phase in the integrand of B() is given by
6 / ) ( 3 3 cut n t cut cut ta S t ta S
, where the first two terms are constants and B() is reduced to an Airy function which can be evaluated numerically. The respective birth and arrival times are tbcut 1.88/0 and tacut 5.97/0. Accordingly, the final expression for
the efficiency at the cutoff region can be written as:
( )
1 ) 1 ( 1 ) ( ) , ( 2 0236 . 0 0 2 4 ) 1 ( 4 2 2 3 / 16 0 2 2 5 0 cutoff N cutoff cutoff rec p tb E w N E L k g a I , (16)where 0|a(tbcut)a(tacut)|2 accounts for the intra-cycle depletion of the ground state [28].
The efficiency at the cutoff region, given by Eq. (16), scales with a factor of 05. A cubic dependence with 0 is due to quantum diffusion. An additional factor of 0 comes from the fact that we are considering the conversion efficiency into a single harmonic, and the bandwidth it occupies is 20. The fifth 0 comes from the denominator in Eq. (9): The energy carried by a cycle of the driving laser field scales like its duration 2/0 at a given electric field amplitude. Note, that in Eq. (16) the factor
5 2
5/2
2 9/2 0 5 0 / ~ 3.17 ~ cut UP IP UP UP E for ponderomotive potentials large compared
to the ionization potential. Thus by shifting the cutoff to shorter wavelength by increasing the ponderomotive potential via the laser wavelength has a price in efficiency that scales at constant field with ~UP9/2. This demonstrates how sensitive the conversion efficiency
scales with drive wavelength, i.e. ~9, if cutoff extension is the goal to achieve.
In the plateau region, each harmonic has mainly contributions from two trajectories and, if the harmonic energy is not close to the cutoff, the third order term in Eq. (15) can be neglected. Then, the overall phase exhibits a quadratic dependence in t , and B() can be
expressed by the error function which are evaluated numerically. The final expression for the efficiency in the plateau region is
2 2 ) 2 ( 2 / 3 0 0 2 ) ( 2 / 3 0 0 2 1 4 ) 1 ( 4 2 2 4 0 2 2 5 0 ) 2 /( ) sin( ) ( ) ( ) 2 /( ) sin( ) ( ) ( 1 ) 1 ( 1 ) ( ) , ( 2 0107 . 0 0 l t ta S i l l l l l l s t ta S i s s s s s s i N rec p S e tb ta tb tb E w ta a tb a S e tb ta tb tb E w ta a tb a e N E L k g a I l l s s , (17)where, (tbs,tas), (tbl,tal) and Ss,lS(tas,l,tbs,l) are the pairs of birth/arrival times and the
corresponding semiclassical action for the short and the long trajectory of a particular harmonic, respectively. Equation (17) is valid for harmonic energies in the plateau region, satisfying the condition 1(IP)/UP3.1. The upper limit is to keep the parabolic approximation of the classical action valid and the lower limit is related to approximate value for the error function used in B() in Eq. (13).
Two interference mechanisms are built into Eq. (17). They are described by the last two terms. One is the interference between each half cycle, which under the condition of
1allows only odd harmonics, and the other is the interference between long and short trajectories. Notice, that intense pulses may break the symmetry due to substantial ionization between half-cycles, and then even harmonics can occur.
Comparing Eqs. (16) and (17), it is observed that both present the same term of 05 in the numerator and a term of E04 in the denominator. However, Eq. (17) contains the second derivative of the action, t2S, which is related to the chirp of the attosecond pulses emitted in each recollision or in other words, is related to the temporal spreading of HHG frequencies during emission. Moreover, as 2tSE02/0 , the overall efficiency exhibits an effective dependence proportional to 06/E06 ~UP3. In summary, the scaling of HHG efficiency with
the driving frequency is 05 at the cutoff and 06 at the plateau region for fixed harmonic wavelength.
3. Discussion
Equations (16) and (17) provide closed-form expressions for the HHG conversion efficiency into a single harmonic at the cutoff frequency and in the plateau region, respectively. In the following, our predicted efficiencies are compared with experimental data in the literature. Experimental data are chosen where the corresponding Keldysh parameter
1 2
/
IP UP
, a prerequisite for validity of the TSM. This is the case for the experiments reported in Ref. 7 and Ref. 21. Figure 1 shows the values used for the recombination amplitude, arec(), and the absorption cross section, (), taken from Ref. 20 and Ref. 29, respectively.
Fig. 1. (a) Recombination amplitude, arec(), and (b) absorption cross section, (), for different noble gases from [20] and [29], respectively.
Figure 2 shows the prediction for HHG efficiency from Eq. (17) for the experimental situation in Ref. 21, where HHG was carried out in neon and argon with 35 fs long (N13), 800 nm pulses. In neon under perfect phase matching and absorption limited conditions,
1 ) , (k L 2
g , a maximum efficiency of 0.35106 is calculated for the 59th harmonic. Note, that the oscillations observed in Fig. 2 are related to the interference between long and short trajectories, which sensitively depend on pulse shape and might be different in the actual experiment, however, the maximum efficiency does not depend strongly on the pulse shape. In argon, for an interaction length, L10cm, absorption length,Labs6.8cm, and phase mismatch, k0.0667cm-1, g(k,L)20.261, a maximum conversion efficiency into the 27-th harmonic of 1.2105is calculated from Eq. (17) as shown in Fig. 2(b). The measured maximum efficiencies stated in Ref. 21 are e for Ne and
5
10 3 .
1 for Ar, which compares very well with the maximum efficiency calculated and shown in Fig. 2(a) and Fig. 2(b) given the simplicity of the model.
0.12 0.14 0.16 0.18 1.0 2.0 3.0 4.0 5.0
Electric field (a.u.) (a) (1 0 -7 ) 0.07 0.08 0.09 0.10 0.11 0.0 0.5 1.0 1.5 2.0 (b)
(1
0
-5)
Electric field (a.u.)
Fig. 2. from Eq. (17), as function of E0, driven by pulses of 11 cycles at 800nm. (a) For the 59-th harmonic generate in neon under perfect phase match and absorption limited conditions. (b) For the 27-th harmonic generate in argon under the conditions of L10 cm, Labs6.8 cm and k0.0667 cm-1. 200 400 600 800 -0.6 -0.4 -0.2 0.0 0.2 0.4 0.6 are c Energy (eV) He Ne Ar Kr Xe (a) 200 400 600 800 1E-5 1E-4 1E-3 0.01 0.1 1 (b) (a .u .) Energy (eV) He Ne Ar Kr Xe
A third case is taken from Ref. 7, which presents maximum measured efficiency values of
5
10
1 (17th harmonic) and 1107 (35th–47th harmonic) for He, pumped by pulses of 27 fs at 400nm (20 cycles) and 800nm (10 cycles), respectively. The detailed experimental conditions are not quantified, however, we use the stated electric field strengths and assume perfect phase matching and absorption limited propagation. The laser intensity used was
14
10
5 W/cm2 for 800 nm and 81014W/cm2 for 400 nm. The calculated efficiencies from Eq. (17) are shown in Fig. 3 and are indeed 1105 and 1107for the given harmonics. Notice, that no fitting procedure was used, just the direct application of Eq. (17).
41 45 49 53 57 61 65 69 73 77 1E-11 1E-10 1E-9 1E-8 1E-7 1E-6 1E-5 HHG order (a) 13 14 15 16 17 18 19 20 1E-10 1E-9 1E-8 1E-7 1E-6 1E-5 1E-4 (b) HHG order
Fig. 3. Efficiency spectrum for HHG in He obtained from Eq. (17). (a) Driven by electric field 0
E = 0.125 a.u. and pulses of 10 cycles at 810 nm. (b) Driven byE0= 0.151 a.u. and pulses of 20 cycles at 420 nm.
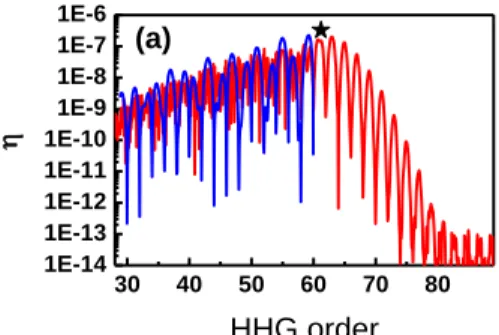
As a final comparison, in Fig. 4, the results calculated from Eqs. (16) and (17) for a square pulse are shown together with those for a Gaussian pulse using the ITSM without the saddle point approximation, i.e. by solving the integrals in Eqs. (9) and (14) numerically. Again excellent agreement is obtained even for pulses as short as 4 cycles. For pulses bellow 4 cycles the HHG spectrum starts to show a strong dependence on the carrier envelope phase and the agreement with Eqs. (16) and (17) deteriorates in the cutoff region.
30 40 50 60 70 80 1E-14 1E-13 1E-12 1E-11 1E-10 1E-9 1E-8 1E-7 1E-6 HHG order (a) 30 40 50 60 70 80 1E-14 1E-13 1E-12 1E-11 1E-10 1E-9 1E-8 1E-7 1E-6 (b) HHG order
Fig. 4. Comparison of Eqs. (16)-(17), which are derived considering a top-hat pulse, and the numerical simulation considering a Gaussian pulse. Efficiencies calculated considering Ne driven by electric field E0= 0.105 and 0 = 800 nm. (a) For pulses of FWHM = 13 cycles. (b)
For pulses of FWHM = 4 cycles. The red lines and the stars represent respectively the values
obtained using Eqs. (16) and (17), and the blue lines are the numerical simulation for Gaussian pulses.
Although most of the recent scaling discussions are focused on the drive frequency [16-19], other parameters may be equally important for maximizing HHG, such as the ionization level of the medium which determines the plasma dispersion and with it the phase matching [30]. The phase mismatch due to plasma generation is a function of the driving frequency and electric field, and critically determines the overall efficiency of the HHG process.
The phase mismatch due to plasma generation, as a function of the driving frequency and electric field, is given by
) 2 /( 02 2 c kPlasma P . (18)
Here, P is the plasma frequency, which is proportional to the electron density, e. It is clear from Eq. (18) that the plasma contribution to phase mismatch increases for longer drive wavelength. The plasma generation can be reduced by lowering the field strength, E , which 0
will have a direct impact on Eqs. (16) and (17) and therefore needs to be considered in a more general analysis.
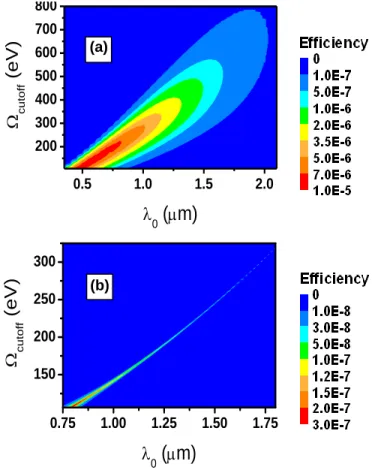
Besides the single-atom response, the other major contribution to be considered in the wavelength scaling is the medium characteristics, such as, recombination amplitude and absorption cross section, represented by arec()2/2(). This quantities exhibit a strong wavelength dependence which can have an important role if cutoff extension is the goal. Thus, in order to illustrate the significance of that statement we consider absorption limited HHG in neon and ask what the optimum drive wavelength is to achieve maximum conversion efficiency in the cutoff region. Equation (16) is used to compute the HHG efficiency at cutoff. The result is displayed in Fig. 5(a) as a function of drive wavelength and cutoff energy (IP3.17UP). A global maximum for Ne efficiency is clearly observed around 0 1.2m
and cut 451eV. It is at first surprising that the maximum efficiency shifts for different driver wavelength 0, but the maximum efficiency itself does not strongly depend on the driver wavelength, as one may expect from the scaling of the single-atom response. This behavior is also reproduced using a Gaussian pulse and numerical evaluation of Eq. (9) using the ITSM at constant field amplitude E while varying 0 0, as shown in Fig. 5(b). The reason is that in the range from 30 to 800 eV for Ne, the recombination amplitude arec increases while the absorption cross section decreases, as shown in Fig. 1, compensating almost completely the reduction due to the front factor of UP9/2 scaling the single-atom response. In particular the absorption cross section decreases more than two orders of magnitude for that range. In Fig. 6, the same problem is considered but more constrains are imposed. In Fig. 6(a) the efficiency at cutoff for a gas cell of 5 mm length at 1 bar of pressure and perfect phase matching is assumed. In this case, the maximum value of 8106 was reached for the HHG efficiency at 00.6m and cut 148eV . In Fig. 6(b), the plasma and neutral atom phase mismatch is included to the problem. In this final case, the maximum value of 2.7107 was reached for the HHG efficiency at 00.8m and cut 107eV.
Fig. 5. (a) Neon HHG efficiency at the cutoff region, using Eq. (15), as a function of the driver wavelength, 0, and the cutoff energy, cut. (b) Full spectrum obtained for Ne, considering a Gaussian pulse with E00.16 a.u. for different driver wavelengths. For both cases, perfect phase matching g(k,L)2 1 and a 5-cycle-driver-pulse were assumed.
(a) 200 400 600 800 1E-14 1E-13 1E-12 1E-11 1E-10 1E-9 1E-8 1E-7 1E-6 1E-5 1E-4
Energy (eV)
(b)Fig. 6. Neon HHG efficiency at the cutoff region, using Eq. (16), as a function of the driven wavelength, 0, and the cutoff energy, cut. (a) Considered a 5-cycle-driver-pulse, L5 mm and pressure 1 bar. (b) Same as (a) but also considering the plasma and neutral atom phase mismatching.
4. Conclusion
In summary, closed form expressions for the HHG conversion efficiency using square shaped pulses are presented for the plateau and cutoff regions. It is shown that the computed efficiencies are also in good agreement with Gaussian shaped pulses. Based on these expressions, absolute theoretical HHG conversion efficiencies were calculated for different gases under different laser pumping conditions. The calculated efficiencies are in good agreement with experimental results obtained from different groups under different experimental conditions. The presented formulas simplify the HHG optimization problem considerably and enable a complete HHG scaling analysis. As an example the efficiency at cutoff for Neon was optimized for plane wave geometry and the global maximum on the Ne efficiency was obtained under various conditions. Provide that most of the performed analysis were considering neon, the formulas and concepts discussed in this paper can be applied for any atomic or molecular gas. For this purpose it is just necessary to use the respective gas properties such as dispersion, ionization potential, absorption cross-section and recombination
0.5 1.0 1.5 2.0 200 300 400 500 600 700 800
0(
m)
c uto ff(e
V
)
(a) 0.75 1.00 1.25 1.50 1.75 150 200 250 300
0(
m)
c uto ff(e
V
)
(b)amplitude. A more comprehensive analysis including other gases will be published in a forthcoming paper. Due to its generality and simplicity, the theory presented in this paper should have a significant impact on the development of HHG based EUV sources.
Acknowledgments
This work was supported in part by U.S. Air Force Office of Scientific Research (AFOSR) grants FA9550-06-1-0468 and FA9550-07-1-0014, through the Defense Advanced Research Projects Agency (DARPA) Hyperspectral Radiography Sources program and SRC at University of Wisconsin. E. L. Falcão-Filho acknowledges support from Conselho Nacional de Desenvolvimento Científico e Tecnológico (CNPq), Brazil.
![Fig. 1. (a) Recombination amplitude, a rec ( ) , and (b) absorption cross section, ( ) , for different noble gases from [20] and [29], respectively](https://thumb-eu.123doks.com/thumbv2/123doknet/13988432.454839/9.918.202.718.143.370/recombination-amplitude-absorption-cross-section-different-noble-respectively.webp)