Automating the CMS DAQ
The MIT Faculty has made this article openly available.
Please share
how this access benefits you. Your story matters.
Citation
Bauer, G. et al. "Automating the CMS DAQ." Journal of Physics:
Conference Series 513 (2014): 012031 © 2014 IOP Publishing
As Published
http://dx.doi.org/10.1088/1742-6596/513/1/012031
Publisher
IOP Publishing
Version
Final published version
Citable link
https://hdl.handle.net/1721.1/121946
Terms of Use
Creative Commons Attribution 3.0 unported license
Detailed Terms
https://creativecommons.org/licenses/by/3.0/
Journal of Physics: Conference Series
OPEN ACCESS
Automating the CMS DAQ
To cite this article: G Bauer et al 2014 J. Phys.: Conf. Ser. 513 012031
View the article online for updates and enhancements.
Related content
Operational experience with the CMS Data Acquisition System
G Bauer, U Behrens, M Bowen et al.
-The data-acquisition system of the CMS experiment at the LHC
G Bauer, B Beccati, U Behrens et al.
-Distributed error and alarm processing in the CMS data acquisition system
G Bauer, U Behrens, M Bowen et al.
-Recent citations
DAQExpert - An expert system to increase CMS data-taking efficiency
J-M Andre et al
-New operator assistance features in the CMS Run Control System
J-M Andre et al
-Jean-Marc Andre et al
Automating the CMS DAQ
G Bauer1, T Bawej2, U Behrens3, J Branson4, O Chaze2, S Cittolin4, J A Coarasa2,
G-L Darlea1, C Deldicque2, M Dobson2, A Dupont2, S Erhan5, D Gigi2, F Glege2,
G Gomez-Ceballos1, R Gomez-Reino2, C Hartl2, J Hegeman2, A Holzner4,
L Masetti2, F Meijers2, E Meschi2, R K Mommsen6, S Morovic2,a, C
Nunez-Barranco-Fernandez2, V O'Dell6, L Orsini2, W Ozga2, C Paus1, A Petrucci2,
M Pieri4, A Racz2, O Raginel1, H Sakulin2,7, M Sani4, C Schwick2, A C Spataru2,
B Stieger2, K Sumorok1, J Veverka1, C C Wakefield2 and P Zejdl2
1 Massachusetts Institute of Technology, Cambridge, Massachusetts, USA; 2 CERN, Geneva, Switzerland;
3 DESY, Hamburg, Germany;
4 University of California, San Diego, San Diego, California, USA; 5 University of California, Los Angeles, Los Angeles, California, USA; 6 FNAL, Chicago, Illinois, USA;
a also at Institute Rudjer Boskovic, Zagreb, Croatia
E-mail: Hannes.Sakulin@cern.ch
Abstract. We present the automation mechanisms that have been added to the Data Acquisition and Run Control systems of the Compact Muon Solenoid (CMS) experiment during Run 1 of the LHC, ranging from the automation of routine tasks to automatic error recovery and context-sensitive guidance to the operator. These mechanisms helped CMS to maintain a data taking efficiency above 90% and to even improve it to 95% towards the end of Run 1, despite an increase in the occurrence of single-event upsets in sub-detector electronics at high LHC luminosity.
1. Introduction
Given the high costs of constructing and operating CERN’s Large Hadron Collider and its four experiments, and given the competition in the race to make discoveries, high data taking efficiency in the operation of the experiments has been of utmost importance. Operating the experiments 24/7 over a good part of the year meant that the experiments no longer could be operated by the experts who designed them but by members of the collaboration. Operational procedures thus had to be simplified and automated wherever possible. During Run 1 of the LHC, between 2009 and 2012 the instantaneous luminosity has been ramped up by several orders of magnitude, leading not only to important discoveries but also to more difficult operating conditions due to a higher radiation dose delivered to the on-detector electronics. In the Compact Muon Solenoid (CMS) [1] experiment, starting from the fall of 2011, some of the sub-detector electronics have been suffering from
7
To whom any correspondence should be addressed.
20th International Conference on Computing in High Energy and Nuclear Physics (CHEP2013) IOP Publishing Journal of Physics: Conference Series 513 (2014) 012031 doi:10.1088/1742-6596/513/1/012031
Content from this work may be used under the terms of theCreative Commons Attribution 3.0 licence. Any further distribution of this work must maintain attribution to the author(s) and the title of the work, journal citation and DOI.
event upsets blocking the data acquisition as often as several times per LHC fill. Recovery from these single-event upsets had to be automated to limit the impact on data taking efficiency.
2. Online System Overview
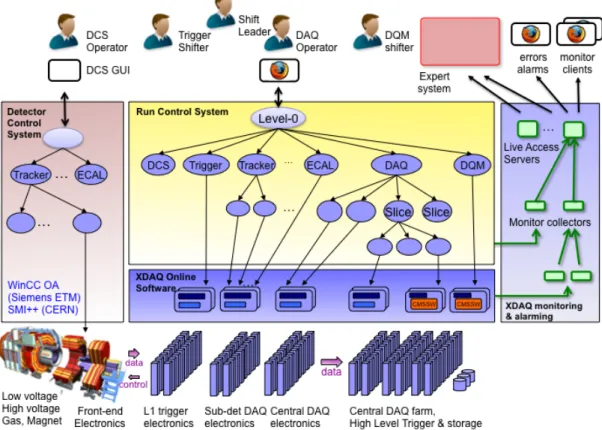
An overview of the CMS online-systems is shown in figure 1. All applications controlling custom hardware or handling the data flow—in the trigger system [2], sub-system readout systems and the central DAQ system [3]—are implemented in C++ within the XDAQ [4] framework. XDAQ provides standardized access to VME/PCI/µTCA hardware, powerful transport protocols, XML-based configuration and control through the Simple Object Access Protocol (SOAP) [5]. The hierarchic control structure of the DAQ and trigger systems is implemented in Java within the Run Control [6] framework. The Run Control framework runs as a web application in a set of Apache Tomcat servers. The individual control nodes (Function Managers), which are dynamically loaded into the web application, control a group of child resources and summarize their state to the parent. Using the framework API, Function Managers define a state machine, a set of parameters, and event handlers written in Java. Communication between Function Managers is based on Web Services. Through the top-level control node (Level-0), the DAQ operator controls the trigger system, the sub-detector readout systems, the central DAQ system including the High Level Trigger (HLT) and the Data Quality Monitoring system. Monitoring data as well as errors and alarms from XDAQ applications and Run Control Function Managers are collected using the XDAQ Monitoring and Alarming System (XMAS) [7] and made available to clients through Live Access Servers.
In parallel the Detector Control System (DCS) [8] controls all infrastructure such as low and high voltages or gas flows. DCS is implemented using the Joint Operations and Control Project (JCOP) framework defined at CERN, which is based on the Siemens WinCC OA platform and the State Management Interface SMI++ [9]. DCS defines a parallel control hierarchy operated by a separate operator. DCS interfaces with the LHC control system through the Data Interchange Protocol (DIP).
Figure 1. Overview of the CMS online systems.
20th International Conference on Computing in High Energy and Nuclear Physics (CHEP2013) IOP Publishing Journal of Physics: Conference Series 513 (2014) 012031 doi:10.1088/1742-6596/513/1/012031
3. Automating the Online Systems
Automation features have been added to the system gradually over Run 1 of the LHC as knowledge about the operation was gained and as new requirements and failure scenarios emerged.
3.1 Principles
In both the XDAQ and the Run Control frameworks, tasks can be automated using framework functionality and C++ or Java, respectively. The guiding principle for automation in the CMS DAQ was to implement it as local as possible i.e. at the lowest hierarchic level. This has the advantage that the knowledge about system details stays encapsulated. Furthermore this distributed approach allows for automatic tasks to be performed in parallel. Only in cases where hardware failure requires the system structure to be recomputed, automation is implemented external to the XDAQ and Run Control frameworks using an external expert system (see Section 4).
3.2 Automation in XDAQ
Automation at the XDAQ level can make use of framework functionalities but also of low-level operating system features such as signals. For example, in the High Level Trigger, in order to reduce configuration time and memory footprint on a multi-core system, a master event processor is started and configured and then forks child processes that perform the actual event processing in parallel. In case of a crash of the reconstruction code in one of the child processes, the master event processor automatically forks a new child process.
3.3 Automation in Run Control
In the Run Control system, Function Managers receive asynchronous notifications about state changes of their child nodes. Child nodes may also send parameters to their parent nodes. Automation is implemented in custom event handlers that are activated upon receipt of a notification from a child node or upon receipt of a command from the parent node.
3.3.1 Automation at the local level in Run Control
An example at the local level is the exclusion of crashed processes from the control, which is activated upon a notification from the Job Control service, a service that starts and monitors processes in CMS. By excluding processes from control, runs can still be stopped and started when non-vital components in the central DAQ have become unavailable. Another example at the local level is the recovery from a failure to drain the central DAQ when stopping the run. If one of the detector front-ends has not delivered all fragments to the central DAQ at the end of the run, some events cannot be built and fragments remain in the buffers of the central DAQ. This situation may appear in only one of the DAQ slices (the current DAQ system has 8 independent slices building events). A Function Manager responsible for the corresponding slice would then detect the situation and perform a recovery action on that slice, only.
3.3.2 Automation in the top-level control node of Run Control
Several tasks have to be automated in the top-level control node of Run Control as they require coordination between the trigger system and the sub-system DAQ systems. This concerns mainly the three areas detailed in the following sub-sections.
3.3.2.1 Automatic actions in response to DCS and LHC state changes
Several state changes in the DCS and LHC require settings to be changed in the sub-detector DAQ systems and the Trigger system. Some sub-systems need to suppress their payload due to noise when their detector high voltage is off. Others need to reduce gains or change thresholds when the high voltage is off. Some links in the trigger system are sensitive to the frequency variation of the LHC clock while the LHC is ramping up its magnets and therefore need to be disabled during LHC ramp.
20th International Conference on Computing in High Energy and Nuclear Physics (CHEP2013) IOP Publishing Journal of Physics: Conference Series 513 (2014) 012031 doi:10.1088/1742-6596/513/1/012031
Initially, whenever a relevant state change happened in the DCS or the LHC—and there are many such state changes in the preparation of a physics run—the DAQ operator manually needed to start a new run with new settings. It was soon realised that this mode of operation was error prone and inefficient. Starting from 2010, automatic actions were implemented in the top-level control node. Through a bridge and a new DCS Function Manager, the top-level control node receives asynchronous notifications about state changes in the DCS or LHC. If a run is on-going upon receipt of such a notification, a new run section is created: the run is automatically paused and the new DCS and LHC states are passed to the relevant sub-systems before resuming the run. The DAQ operator can thus start a run, long before ‘stable beams’ are declared by the LHC—usually this is done at ‘flat top’, just after the LHC magnets have been ramped. Automatic actions in the DCS system then ramp up high voltages as appropriate and the DAQ system follows by automatically creating new run sections.
3.3.2.2 Automatic recovery from soft errors
As the LHC continued to increase the instantaneous luminosity, more and more cases of ‘soft errors’ occurred in the readout electronics of some sub-detectors—mostly in the tracking detectors, which are closest to the interaction region. In many cases these errors could be traced to single-event upsets in the electronics due to the high radiation dose incurred. Figure 2 shows how these single-event upsets occur proportional to the integrated luminosity in the Pixel system. These errors blocked the sub-system DAQ and required the run to be stopped (30 seconds), a sub-sub-system to be re-configured (~ 2 minutes) and the run to be re-started (15 seconds), incurring a down time of at least 3 minutes in the most optimistic case (shifter very alert and fast, no subsequent errors). Towards the end of 2011, such errors occurred several times per LHC fill and it was thus decided to automate recovery. The new soft-error recovery mechanism is coordinated by the top-level control node, but detection of the soft-error and recovery are implemented by the corresponding sub-system. Sub-systems notify the top-level control node by changing their state. The top-level control node then pauses triggers, calls a newly defined recovery method on the sub-detector, resynchronizes and resumes the run. It is also possible to preventively call the recovery method of other sub-systems in the shadow. On average, a recovery from a soft error took 12 seconds in 2012. When compared to the most optimistic manual recovery time, at least 46 hours of down time were avoided in 2012 by the automatic recovery mechanism. (The total remaining down time in 2012 was 94 hours.)
Figure 2. Single-Event Upsets (SEU) in the Pixel sub-system in 2012.
20th International Conference on Computing in High Energy and Nuclear Physics (CHEP2013) IOP Publishing Journal of Physics: Conference Series 513 (2014) 012031 doi:10.1088/1742-6596/513/1/012031
3.3.2.2 Automatic configuration parameterization
Another area of automation in the top-level control node is the parameterization of the configuration that has to be performed by the DAQ operator. Initially, many configuration parameters such as one run key per sub-system, and the High-Level-Trigger configuration had to be selected manually by the DAQ operator. Additionally, the Trigger operator had to select several keys for the L1 trigger configuration and the clock source for the experiment. Parameters had to be changed according to running conditions and had to be synchronized between the Trigger and DAQ systems. Despite good instructions and well-trained operators this inevitably led to runs being taken with inconsistent trigger settings. A new combined trigger key was thus introduced during 2010, tying together all configuration parameters of the L1 and High Level triggers. For each of a number of combined trigger modes, experts defined a current, consistent set of parameters. The DAQ operator then just needed to select the correct mode. Additionally, from 2010 the DAQ operator had to select the clock source or could have it automatically selected by the top-level control nodes based on the LHC beam and machine modes. During 2012 several sub-systems required that their run keys be changed whenever the trigger configuration changed. A CMS-wide run mode was thus introduced linking together all configuration parameters. For each run mode a current, consistent set of parameters is defined by experts. The DAQ operator then just selects the correct run mode according to the type of run to be taken. Alternatively the CMS-wide run mode can also be automatically selected by the top-level control node depending on the LHC beam and machine modes. With this automation in place the DAQ operator just needs to stop and start runs whenever requested to do so by automatic guidance built into the top-level control node and after confirming with the shift leader. Automatic cross-checks also warn the shifter to reconfigure sub-systems if this is required due to LHC clock instabilities or due to other configuration changes such as the in/exclusion of sub-detectors or front-end drivers.
4. Automation through a central expert system
In 2011, based on the experience gained with operations in 2010, an expert system, the “DAQ Doctor”, was introduced to aid the shift crew. The DAQ Doctor continuously analyses the monitoring data of the central DAQ system and the trigger system and correlates information from the different applications in the DAQ system. It is able to detect anomalies in many system parameters such as: L1 trigger rate, HLT physics stream rate, rate to disk, resynchronization rate, dead-time, back-pressure, event-builder throughput, HLT farm utilization. Additionally, it detects if applications stop updating their monitoring data and then checks the status of the corresponding machine in the infrastructure monitoring. The DAQ Doctor advises the shift crew through text messages, sounds and spoken alerts. In many cases it provides instructions on further checks to be done by the shift crew or it provides a solution to a diagnosed problem. One particular problem that plagued central-DAQ on-call experts had been hardware failure in machines of the central DAQ event builder which required a manual intervention to black-list the machine and to compute an alternate DAQ configuration avoiding the affected machine. In order to make recovery as quick and as painless as possible, the tool used to create DAQ configuration, the DAQ Configurator [10], was first simplified as much as possible. Since 2012 the recovery is completely automated in the DAQ Doctor, which now calls the DAQ Configurator to recompute the configuration. This feature has avoided several down-times and saved the on-call experts many hours of sleep.
The DAQ Doctor is based on the high-level scripting language Perl. It consists of a generic framework and pluggable modules performing the actual analysis. Detection of a high-level problem may trigger a more detailed analysis. The DAQ Doctor archives all its diagnosis, and also generates separate archives about sub-system problems. In case of a severe problem it dumps all monitoring data for further analysis by experts.
20th International Conference on Computing in High Energy and Nuclear Physics (CHEP2013) IOP Publishing Journal of Physics: Conference Series 513 (2014) 012031 doi:10.1088/1742-6596/513/1/012031
5. Data Taking Efficiency
CMS data taking efficiency during stable beam periods provided by the LHC increased from 91% in 2010 to 93% in 2011 and 95% in 2012 despite frequent single-event upsets since the fall of 2011. This increase in efficiency was only possible by automating standard operations and error recovery as much as possible. It should be noted that the availability of the central DAQ system exceeded 99.6% in all three years of data-taking.
6. Summary and Outlook
We presented the automation mechanisms added to the CMS DAQ system during Run 1 of the LHC. Most automation is integrated into the XDAQ and Run Control frameworks and is performed as local as possible. Only recovery from hardware failure, which requires the system structure to be changed, is performed through an external expert system. The discussed automation features helped to increase CMS data taking efficiency from 91% to 95% over Run 1 of the LHC.
The automation integrated into the XDAQ and Run Control frameworks has served the experiment well and will be kept for Run 2. It is planned to extend the soft-error recovery mechanism to recover from more types of sub-system errors. Due to the major upgrade of the central DAQ system [11-13] for Run 2, the external expert system will have to undergo major changes. We are currently also evaluating alternative implementations such as the use of a complex decision logic system.
Acknowledgments
This work was supported in part by the DOE and NSF (USA) and the Marie Curie Program.
References
[1] The CMS Collaboration 1994 CMS Technical Proposal, CERN LHCC 94-38
The CMS Collaboration (Adolphi R et al.) 2008 The CMS Experiment at CERN LHC, JINST 3 S08004 p. 361,
[2] The CMS Collaboration 2000 CMS, The TriDAS Project, Technical Design Report, Volume 1:
The Trigger Systems, CERN/LHCC 2000-38
[3] The CMS Collaboration 2002 CMS, The TriDAS Project, Technical Design Report, Volume 2:
Data Acquisition and High-Level Trigger, CERN/LHCC 2002-26
[4] Bauer G et al. 2010 The CMS data acquisition system software, J. Phys.: Conf. Ser. 219 022011 [5] Box D et al. 2000 Simple Object Access Protocol (SOAP) 1.1, W3C Note
[6] Bauer G et al 2012 First Operational Experience with a High-Energy Physics Run Control System based on Web Technologies, IEEE Trans. Nucl. Sci. 59 4 1597-1604
[7] Bauer G et al. 2012 Distributed error and alarm processing in the CMS data acquisition system
J. Phys.: Conf. Ser. 396 012038
[8] Bauer G et al. 2012 Status of the CMS Detector Control System J. Phys.: Conf. Ser. 396 012023 [9] Gaspar C, Franek B 1997 SMI++ - object oriented framework for designing control systems for HEP experiments, presented at CHEP’97 - Int. Conf. Computing High Energy Physics, Berlin, Germany, April 7-11, 1997
[10] Bauer G et al. 2010, Dynamic configuration of the CMS data acquisition system, J. Phys.: Conf.
Ser. 219 022003, 2010
[11] Bauer G et al., The new CMS DAQ system for LHC operation after 2014 (DAQ2), in these
proceedings
[12] Bauer G et al., 10Gbps TCP/IP streams from the FPGA for High Energy Physics, in these
proceedings
[13] Bauer G et al., Prototype of a File-Based High-Level Trigger in CMS, in these proceedings
20th International Conference on Computing in High Energy and Nuclear Physics (CHEP2013) IOP Publishing Journal of Physics: Conference Series 513 (2014) 012031 doi:10.1088/1742-6596/513/1/012031