HAL Id: inria-00495557
https://hal.inria.fr/inria-00495557
Submitted on 28 Jun 2010
HAL is a multi-disciplinary open access
archive for the deposit and dissemination of sci-entific research documents, whether they are pub-lished or not. The documents may come from teaching and research institutions in France or abroad, or from public or private research centers.
L’archive ouverte pluridisciplinaire HAL, est destinée au dépôt et à la diffusion de documents scientifiques de niveau recherche, publiés ou non, émanant des établissements d’enseignement et de recherche français ou étrangers, des laboratoires publics ou privés.
Multichannel SAR Image Classification by Finite
Mixtures, Copula Theory and Markov Random Fields
Vladimir Krylov, Gabriele Moser, Sebastiano B. Serpico, Josiane Zerubia
To cite this version:
Vladimir Krylov, Gabriele Moser, Sebastiano B. Serpico, Josiane Zerubia. Multichannel SAR Image Classification by Finite Mixtures, Copula Theory and Markov Random Fields. International Workshop on Bayesian Inference and Maximum Entropy Methods in Science and Engineering (MaxEnt), Jul 2010, Chamonix, France. �inria-00495557�
Multichannel SAR Image Classification by Finite
Mixtures, Copula Theory and Markov Random
Fields
Vladimir A. Krylov
1∗,†, Gabriele Moser
∗∗, Sebastiano B. Serpico
∗∗and
Josiane Zerubia
†∗Dept. of Mathematical Statistics, Faculty of Computational Mathematics and Cybernetics,
Lomonosov Moscow State University; 1, Leninskie Gory, 119991, Moscow, Russia
†EPI Ariana, INRIA/CNRS/UNSA, CR INRIA Sophia Antipolis - Méditerranée; 2004, Route des
Lucioles, B.P. 93, F-06902, Sophia Antipolis, France
∗∗Dept. of Biophysical and Electronic Engineering (DIBE), University of Genoa; Via Opera Pia
11a, I-16145, Genoa, Italy
Abstract. In this paper we develop a supervised classification approach for medium and high reso-lution multichannel synthetic aperture radar (SAR) amplitude images. The proposed technique com-bines finite mixture modeling for probability density function estimation, copulas for multivariate distribution modeling and a Markov random field (MRF) approach to Bayesian classification. The novelty of this research is in introduction of copulas to classification of D-channel SAR, with D> 3, within the mainframe of finite mixtures - MRF approach. This generalization results in a flexible and well performing multichannel SAR classification technique. Its accuracy is validated on several mul-tichannel Quad-pol RADARSAT-2 images and compared to benchmark classification techniques. Keywords: multichannel SAR, amplitude, classification, dictionary, probability density function estimation, Markov random field, copula
PACS: 02.50.Sk, 02.70.Rr, 93.85.Bc, 93.85.Pq
INTRODUCTION
The last decades have witnessed an intensive development and a significant increase of interest to remote sensing, and, in particular, to synthetic aperture radar (SAR) image processing. This paper focuses on the supervised SAR image classification, which is one of the fundamental SAR image processing problems. Recently, various models have been proposed for modeling the single channel statistics of SAR data [1], however, nei-ther is general and flexible enough to model the joint probability density function (pdf) in case of D-channel SAR, D> 3. In this paper we propose a joint pdf model for multi-channel SAR, based on finite mixture modeling for marginal pdf estimation and copulas for multivariate distribution modeling. We apply this model to medium and high resolu-tion multichannel SAR amplitude image classificaresolu-tion by combining it with a contextual Markov random field (MRF) approach [2] that allows to take into account the contextual information and to gain robustness against the inherent noise-like phenomenon of SAR known as speckle. The finite mixture modeling is done via a recently proposed
specific dictionary-based stochastic expectation maximization (DSEM) approach [3, 4], that is applied to class-conditional amplitude probability density function estimation separately to all the SAR channels. For modeling the class-conditional joint distributions of multichannel data the statistical concept of copulas [5] is employed, and a dictionary-based copula selection method is proposed. The contribution of this study is the general-ization of the recently considered DSEM - MRF classification approach [6] to D-channel SAR, D> 3, via copulas, and its experimental validation on several multichannel Quad-pol RADARSAT-2 images with a comparison to benchmark classification techniques.
METHODOLOGY
Method overview
We consider the supervised classification of a D-channel SAR image with M target classes and we assume training pixels to be available for all the classes.
Marginal-step. The marginal pdf of each channel for each class is estimated sepa-rately by applying DSEM to the training pixels. The mixture DSEM pdfs pdm(yd|ωm)
and the corresponding cumulative distribution functions (CDFs) Fdm(yd|ωm), whereωm
is the event of observing the m-th class, are as follows: pdm(yd|ωm) =
Kdm
∑
i=1
Pdmipdmi(yd|θdmi), Fdm(yd|ωm) = Kdm
∑
i=1
PdmiFdmi(yd|θdmi), (1)
where m = 1, . . . , M, d = 1, . . . , D, yd are the observed amplitudes and Kdm are the
numbers of mixture components. Fdmi and pdmi represent the i-th mixture component
in the CDF and pdf domains, respectively, and Pdmiare the related mixture proportions.
Copula-step.The joint pdfs pm(y|ωm) for classes m = 1, . . . , M are constructed from
marginals (1) by means of automatically selected from a specific dictionary copulas Cm∗:
pm(y|ωm) = p1m(y1)··· pDm(yD) ∂ DC∗
m
∂y1···∂yD
(F1m(y1), . . . , FDm(yD)). (2)
Contextual-step.To take into account the contextual information disregarded by the pixel-based Copula-DSEM pdfs (2) and to gain robustness against the inherent noise-like phenomenon of SAR known as speckle, we adopt a contextual approach based on an MRF model. Following a classical definition of an MRF [2], we consider a two dimensional latticeS with N pixels {si} and class labels x = {xi}, xi∈ {1,...,M} and
introduce an isotropic second-order neighborhood systemC with cliques of size 2. The resulting MRF energy function for the class labels is parameterized byβ > 0:
H(x|β) =
∑
{s,s′}∈C [ −β δxs=xs′ ] , withδxs=xs′ = { 1, if xs= xs′ 0, otherwise.In a hidden MRF model, the unobserved class labels are modeled as an MRF and the observations are conditionally independent given labels [2]. Given (2) and denoting the
value of vector y at pixel i as yi, the hidden MRF energy function is the following: U (ωm|y,β) =
∑
i∈S [ −log pm(yi|ωm)−β∑
s:{i,s}∈Cδ xi=xs ] . (3)In order to estimate β in (3), we suggest to use a simulated annealing procedure [7] with pseudo-likelihood function PL [2] of the following form:
log PL(x|β) = log [
∏
s∈Sp(xs|xS\{s},β) ] = log ∏
s∈S exp(−U(xs|xS\{s},β)) ∑ zs∈XS exp(−U(zs|xS\{s},β)) , (4) and xs={ω1, . . . ,ωM}. We employ N(βt, 1) as a proposal distribution [6] andexponen-tial decrease Tt = 0.95· Tt−1 as a cooling schedule. Theβ-estimation is performed on
maximum likelihood preclassification map, associating with every pixel of the image a label with the highest probability assigned by the context-free Copula-DSEM model (2). Optimization-step. This step involves the minimization of the energy (3)-(4). For this optimization problem an iterative deterministic Modified Metropolis Dynamics (MMD) [8] algorithm is adopted. It is a compromise approach between fast but local deterministic Iterated Conditional Modes algorithm [2], and global yet slow Simulated Annealing [7]. As such, MMD is computationally feasible and provides reasonable results in real classification problems [8] and in our optimization problem. Structurally, MMD algorithm proceeds as follows:
1. sample a random initial configurationω0; set k = 0 and temperature T0= T0;
2. increase k; using a uniform distribution pick a state η which differs exactly in one element fromωk;
3. compute∆U = U(η)−U(ω) and acceptη according to the rule:
ωk+1=
{
η, if∆U 6 0 or ln(α)6 −∆UT k 6 0,
ωk, otherwise.
whereα ∈ (0,1) is a constant threshold, chosen once at the start of the algorithm; 4. decrease Tk+1=τ· Tk, and goto Step 2 until convergence, i.e.∆U/U <γ is fulfilled.
Dictionary-based Stochastic Expectation Maximization
To take into account the heterogeneity scenario, when several distinct land-cover typologies are present in the same SAR image, a finite mixture model (FMM) for the distribution of grey levels is assumed. Specifically, the dictionary-based stochastic expectation maximization (DSEM) approach developed in [3, 4] is applied to estimate marginal class-conditional statistics. Here, we follow the notations in [4] and refer to it for more details. Separately focusing on each class ωm and each channel yd,
TABLE 1. DSEM dictionaryD of parametric pdf families with MoLC equations
Family Probability density function MoLC equations
Log-normal p1(r) =σr√12πexp [ −(ln r−m)2 2σ2 ] , r > 0 κ1= m κ2=σ2 Weibull∗ p2(r) = µηηrη−1exp [ −(r µ )η] , r> 0 κ1= lnµ+Ψ(1)η−1 κ2=Ψ(1,1)η−2 Nakagami† p3(r) =Γ(L)2 (λL)Lr2L−1exp ( −λLr2), r> 0 2κ1=Ψ(L) − lnλL 4κ2=Ψ(1,L) Generalized Gamma p4(r) =σΓ(κ)ν (r σ )κν−1 exp { −(r σ )ν} , r> 0 κ1=Ψ(κ)/ν+ lnσ κj=Ψ( j − 1,κ)/νj, j = 2, 3 ∗Ψ(·) the digamma function and Ψ(ν,·) the νthorder polygamma function [9]
†Γ(·) is the gamma function [9]
pdf p(r) = ∑Ki=1Pipi(r), r > 0, with K components, where pi(·) is the i-th mixture
component, i = 1, . . . , K, and {Pi} is a set of mixing proportions, i.e., ∑Ki=1Pi = 1
and 0 < Pi < 1. Each component pi(·) is modeled by resorting to a finite dictionary
D = {p1, . . . , p4} (see Table 1) of four SAR specific distinct parametric pdfs pj(r|θj),
parameterized byθj∈ Aj, j = 1, . . . , 4.
For this mixture estimation problem we use the iterative stochastic expectation max-imization (SEM) scheme [10]. The convergence properties of SEM have been proved under suitable assumptions [10], which do not hold strictly for all the pdfs inD. How-ever, we recall that SEM, compared to the classical EM or other deterministic variants for FMM estimation, was specifically designed to improve the exploratory properties of EM in case of multimodal likelihood function [10]. Instead of adopting the maximum likeli-hood estimates as the classical SEM scheme [10] suggests, DSEM employs the Method of Log-Cumulants (MoLC) [3] for component parameter estimation. Based on the Mellin transform [9], MoLC allows to formulate a set of equations relating the unknown parameters of a given parametric pdf with several sample log-cumulants (see Table 1). MoLC has been demonstrated to be an effective estimation tool for all the pdfs inD [4].
Each iteration of DSEM goes as follows (everywhere i = 1, . . . , Kt, j = 1, . . . , M):
• E-step: for each greylevel z = 0,...,Z − 1 and ∀i, compute the posterior probability estimates corresponding to the current pdf estimates:
τt i(z) = Pitpti(z) ∑Kt j=1Ptjptj(z) ,
with greylevel labels sz∈ {σ1, . . . ,σKt}, assigning each greylevel z to one of the mixture components, and pti(·) being theσi-conditional pdf estimate on the t-th step.
• S-step: ∀z sample the label st(z) according to the posterior distribution{τt
i(z)}.
• MoLC-step: for the i-th mixture component, compute the following histogram-based estimates of the mixture proportions and the first three log-cumulants:
Pit+1= ∑z∈Qith(z) ∑Z−1 z=0 h(z) , κ1it =∑z∈Qith(z) ln z ∑z∈Qith(z) , κbit = ∑z∈Qith(z)(ln z−κ t 1i)b ∑z∈Qith(z) ,
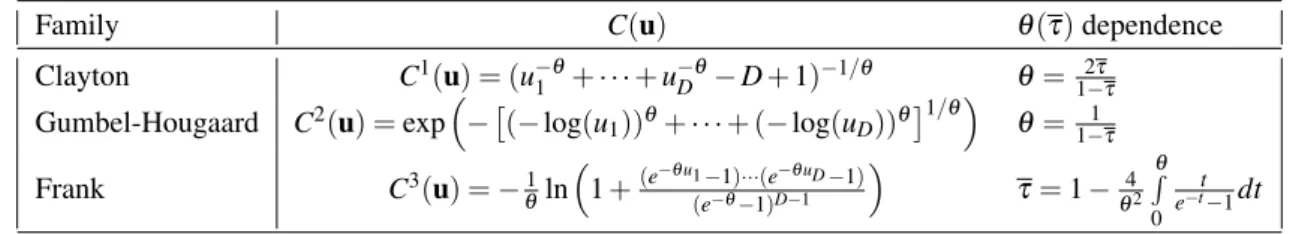
TABLE 2. Dictionary of copula families C(u) withθ(τ) dependencies.
Family C(u) θ(τ) dependence
Clayton C1(u) = (u−θ
1 +··· + u−Dθ− D + 1)−1/θ θ=
2τ 1−τ
Gumbel-Hougaard C2(u) = exp ( −[(−log(u1))θ+··· + (−log(uD))θ ]1/θ) θ=1−1τ Frank C3(u) =−θ1ln ( 1 +(e−θu1−1)···(e−θuD−1) (e−θ−1)D−1 ) τ= 1−θ42 θ ∫ 0 t e−t−1dt
where b = 2, 3; h(z) is the image histogram; Qit ={z : st(z) =σi} is the set of grey
levels assigned to the i-th component; then, solve the corresponding MoLC equations (Table 1) for each parametric family fj(·|θj) inD, resulting in MoLC estimatesθi jt.
• K-step: ∀i: if Pt+1
i <γ, eliminate the i-th component; update Kt+1. The choice of
thresholdγ does not appreciably affect DSEM, provided it is small, e.g. 0.005.
• Model Selection-step: ∀i = 1,...,Kt+1, compute the log-likelihood of each
estimated pdf fj(·|θi jt) according to the data assigned to the i-th component:
Lti j =∑z∈Qith(z) ln fj(z|θi jt), and define pt+1i (·) as the estimated pdf fj(·|θi jt)
yield-ing the highest value of Lti j.
Copulas
For the purpose of modeling the joint distribution of a D-channel SAR image, given the estimates of the related marginal distributions, we employ copulas [5]. In the lit-erature, various models have been proposed for the marginal statistics of SAR ampli-tudes [1], however, none of them is general and flexible enough to model a joint pdf in case of multichannel SAR data for each class. In order to overcome this limitation, we merge the marginal pdfs provided by DSEM into a joint pdf by means of copulas.
A D-dimensional copula is a function C : [0, 1]D⊂ RD→ R, which satisfies: 1. C(u) = 0 for any u:∃i ∈ {1,...,D} so that ui= 0.
2. C(u) = ud for any u: ui= 1, for all i̸= d.
3. the D-increasing condition: for any 06 ui,16 ui,26 1, where i = 1,...,D,
VC≡ 2
∑
i1=1 ···∑
2 iD=1 (−1)(i1+···+iD)C(u 1,i1, . . . , uD,iD)> 0.The important property of copulas is given by the Sklar’s theorem [5], which states the existence of a copula C, that models the joint distribution H of arbitrary random variables Y1, . . . ,YDwith CDFs F1, . . . , FD: H(y) = C(F(y1), . . . , F(yD)),∀y ∈ RD. In this paper we
consider one-parameter archimedean copulas [5]. This class provides a representative panel of joint pdf forms and has easy parameter estimation techniques [5, 11]. For pa-rameter estimation we use the copula’s connection with Kendall’sτ ranking coefficient:
τ+ 1 = 4
∫
(a) RS1 image, VV pol (b) manual GT (c) K-NN-MRF
(d) Copula-DSEM-MRF 3 (e) Copula-DSEM-MRF 2
FIGURE 1. (a) RS1 image (1000× 700 pixels) in VV pol, RADARSAT-2 Data and Products ©MacDonald, Dettwiler and Associates Ltd., 2008 - All Rights Reserved. (b) Manually created ground truth (GT) and classification maps obtained by: (c) K-NN-MRF on HH/HV/VV, (d) Copula-DSEM-MRF on HH/HV/VV and (e) Copula-DSEM-MRF on HH/VV. Automatically selected copulas: Gumbel for “water/wet” and “vegetation”, Frank for “urban”.
where C(u, v) is a 2-copula of the same type and τ is the average of D(D− 1)/2 con-sistent Kendall’s τ estimates corresponding to different bivariate marginals (Yd1,Yd2): τ=N(N4−1) ∑
i̸= j
I[Yi,d16 Yj,d1]I[Yi,d26 Yj,d2]−1. The use of Kendall’s tau based parameter
estimation is explained by a relatively small number of samples N employed [11]. The dictionary of employed archimedean copulas include Clayton, Gumbel-Hougaard and Frank copula families (Table 2). This is a very basic set, yet it allowed to achieve good results and it will be studied further. The choice of a best fitting copula Cm∗ in the dictionary for every class m = 1, . . . , M, is based on a dedicated criterion: we choose the copula with the highest p-value provided by a Pearson Chi-square test-of-fitness (PCS) [12]. PCS tests the null hypothesis that the sample frequencies (F1m(y1), . . . , FDm(yD)), m = 1, . . . , M, are consistent with the theoretical probabilities
for the copula Cc(y), c = 1, 2, 3. Its statistics
n ∑ i=1 (Oi−Ei)2 Ei is asymptotically χ 2 n−r−1
dis-tributed [12], with Oiand Eithe observed and the hypothetical frequencies, respectively,
n the number of clusters and r the number of parameters for Copula-DSEM pdfs (2).
EXPERIMENTS
The developed multichannel supervised classification approach has been tested on Single-look, Fine Quad-Pol HH/HV/VH/VV, 7.5 m resolution RADARSAT-2 amplitude
(a) RS2 image, HV (b) manual GT (c) Co-DSEM-MRF (d) K-NN-MRF FIGURE 2. (a) RS2 image (500× 700 pixels) in HV pol, RADARSAT-2 Data and Products ©MacDonald, Dettwiler and Associates Ltd., 2008 - All Rights Reserved. (b) Manually created ground truth (GT) and classification maps obtained by: (c) Copula-DSEM-MRF on HH/HV/VV and (d) K-NN-MRF on HH/HV/VV. See color legend on Fig. 1. Automatically selected copulas: Gumbel for “water/wet”, Frank for “vegetation” and “urban”.
TABLE 3. Classification accuracies on the considered test images: by classes, average and overall Image Method “Water/wet” “Vegetation” “Urban” Average Overall
RS1 Copula-DSEM-MRF on HH/HV/VV 98.04% 90.33% 71.49% 86.61% 88.69% K-NN-MRF on HH/HV/VV 98.85% 89.02% 62.89% 83.59% 86.42% Copula-DSEM-MRF on HH/VV 98.97% 87.16% 58.74% 81.62% 84.78% RS2 Copula-DSEM-MRF on HH/HV/VV 97.30% 95.12% 86.12% 92.85% 94.18% K-NN-MRF on HH/HV/VV 98.10% 96.06% 81.33% 91.83% 93.51%
images of Vancouver RS1 (Fig. 1) and RS2 (Fig. 2). It is well known that HV and VH polarizations provide very similar information [1], thus, D = 3 channels HH/HV/VV without VH were employed in experiments. The experiments involved the classification into M = 3 classes: “water/wet”, “vegetation” and “urban”. In Marginal-step, DSEM was initialized with K0= 3 mixture components. For PCS test in Copula-step, n = 25
of equal-sized square clusters was selected. In Optimization-step, parameters were set to T0= 5.0,α = 0.3,τ = 0.97,γ = 10−4. The training was performed on a 100× 100 subimage endowed with a manually annotated nonexhaustive ground truth, not overlap-ping with the test areas.
Table 3 reports the accuracies of the developed Copula-DSEM-MRF approach: “by class”, “average” (i.e., the arithmetic mean of the class accuracies) and “overall” (i.e., the percentage of correctly classified test samples, irrespective of their classes). The classification results are compared visually (Fig. 1, Fig. 2) and quantitatively (Table 3) with the nonparametric K-nearest neighbors [13] classification method combined with an MRF, with K∗= 35 was estimated by cross-validation [13]. On both images the accu-racy demonstrated by our method is higher, especially for the “urban” class. On RS1 im-age, we also provide the comparison with Copula-DSEM-MRF classification based on 2 channels HH/VV to demonstrate the accuracy gain from model generalization to D> 3.
CONCLUSIONS
In this paper a generalized method for supervised multichannel SAR image classifi-cation is developed, based on a previously proposed approach [6]. It generalizes the concept of finite mixture combined with Markov random field classification approach to D-channel SAR images, D> 3, via copulas. The resulting classification technique is flexible and performs well in experiments with high resolution Quad-Pol RADARSAT-2 images, thanks to a modeling flexibility provided by copulas and a dictionary-based copula selection approach.
The directions of further research include the study of a more specific copula dictio-nary, e.g., by including non-symmetric copulas, and the specialization of the model to ur-ban area classification, e.g., by incorporating geometrical features into the MRF model.
ACKNOWLEDGMENTS
This research was carried out in collaboration between EPI Ariana of the Institut Na-tional de Recherche en Informatique et en Automatique (INRIA), France, and the Dept. of Biophysical and Electronic Engineering (DIBE) of the University of Genoa, Italy, with the financial support of INRIA. This support is gratefully acknowledged. The RADARSAT-2 images of Vancouver were taken at http://www.radarsat2.info/, RADARSAT is an official mark of the Canadian Space Agency.
REFERENCES
1. C. Oliver, and S. Quegan, Understanding Synthetic Aperture Radar Images, Artech House, Norwood, 1998.
2. J. Besag, “On the statistical analysis of dirty pictures,” Journal of the Royal Statistical Society B 48, 259–302 (1986).
3. G. Moser, S. B. Serpico, and J. Zerubia, “Dictionary-based Stochastic Expectation Maximization for SAR amplitude probability density function estimation,” IEEE Trans. Geosci. Remote Sens. 44, 188–199 (2006).
4. V. Krylov, G. Moser, S. B. Serpico, and J. Zerubia, “Dictionary-based probability density function estimation for high-resolution SAR data,” in Proc. of SPIE, San Jose, USA, 2009, 72460S.
5. R. B. Nelsen, An Introduction to Copulas, Springer, New-York, 2007, 2nd edn.
6. G. Moser, V. Krylov, S. B. Serpico, and J. Zerubia, “High resolution SAR-image classification by Markov random fields and finite mixtures,” in Proc. of SPIE, San Jose, USA, 2010, 753308. 7. S. Geman, and D. Geman, “Stochastic relaxation, Gibbs distributions, and the Bayesian restoration
of images,” IEEE Trans. Patt. Anal. Mach. Intell. 6, 721–741 (1984).
8. Z. Kato, J. Zerubia, and M. Berthod, “Satellite image classification using a modified Metropolis dynamics,” in Proc. of ICASSP, San Francisco, USA, 1992, pp. 573–576.
9. I. Sneddon, The use of integral transforms, McGraw-Hill, New-York, 1972.
10. G. Celeux, D. Chauveau, and J. Diebolt, On stochastic versions of the EM algorithm, Research Report 2514, INRIA, France (1995).
11. I. Kojadinovic, and J. Yan, “Comparison of three semiparametric methods for estimating dependence parameters in copula models,” Insurance: Mathematics and Economics 47, 52–63 (2010).
12. E. Lehmann, and J. Romano, Testing statistical hypotheses, Springer, New York, 2005, 3rd edn. 13. C. M. Bishop, Pattern Recognition and Machine Learning, Springer, New-York, 2006.