Publisher’s version / Version de l'éditeur:
Proceedings of the First International Conference on Sensor Networks and
Applications Experimentation and Logistics (SENSAPPEAL 2009), 2009-09-25
READ THESE TERMS AND CONDITIONS CAREFULLY BEFORE USING THIS WEBSITE. https://nrc-publications.canada.ca/eng/copyright
Vous avez des questions? Nous pouvons vous aider. Pour communiquer directement avec un auteur, consultez la
première page de la revue dans laquelle son article a été publié afin de trouver ses coordonnées. Si vous n’arrivez pas à les repérer, communiquez avec nous à [email protected].
Questions? Contact the NRC Publications Archive team at
[email protected]. If you wish to email the authors directly, please see the first page of the publication for their contact information.
NRC Publications Archive
Archives des publications du CNRC
This publication could be one of several versions: author’s original, accepted manuscript or the publisher’s version. / La version de cette publication peut être l’une des suivantes : la version prépublication de l’auteur, la version acceptée du manuscrit ou la version de l’éditeur.
Access and use of this website and the material on it are subject to the Terms and Conditions set forth at
Data Fusion via Nonlinear Space Transformations
Valdes, Julio J.; Létourneau, Sylvain; Yang, Chunsheng
https://publications-cnrc.canada.ca/fra/droits
L’accès à ce site Web et l’utilisation de son contenu sont assujettis aux conditions présentées dans le site LISEZ CES CONDITIONS ATTENTIVEMENT AVANT D’UTILISER CE SITE WEB.
NRC Publications Record / Notice d'Archives des publications de CNRC:
https://nrc-publications.canada.ca/eng/view/object/?id=38bd2568-322b-4f40-8504-d348abaa52b2 https://publications-cnrc.canada.ca/fra/voir/objet/?id=38bd2568-322b-4f40-8504-d348abaa52b2Data Fusion via Nonlinear Space Transformations
Julio J. Vald´
es
Sylvain L´
etourneau
Chunsheng Yang
National Research Council Canada
Institute for Information Technology
M50 1200 Montreal Road, Ottawa, K1A 0R6, Canada
[email protected]
[email protected]
[email protected]
Abstract
Advances in hardware and communication tech-nologies for distributed sensor systems and sensor net-works allow the acquisition of considerable amounts of information from systems that are being monitored. As a result, the investigation of data fusion approaches becomes both a need and a challenge. This paper ex-plores an approach to sensor fusion based on nonlin-ear transformations between the original sensor space (becoming more highly-dimensional) and lower di-mensional spaces. In particular unsupervised-implicit transformations aiming at preserving the similarity structure of the observed multivariate data are used. The approach is applied to real world data recorded from Auxiliary Power Units (APU) in aircraft, where a large amount of variables are observed/derived for characterizing different stages of the functioning of the unit along time. Two example units chosen at random from a collection are used as experiment cases. The results indicate that the nonlinear transformation is a useful and effective approach to reducing data space while preserving the structure of the original data and relevant information as expressed by the original sen-sor variables. The transformed spaces also help in understanding the characteristics of the sensor data. Meaningful relationships can be established between the nonlinear variables of the transformed spaces with the time to failure of the APUs, suggesting the possi-bility of developing accurate models for time to failure predictions.
1
Introduction
Significant advances have been achieved in hard-ware and communication technologies for distributed sensor systems and sensor networks, but the data fu-sion aspect remains a key challenge [1]. Generic and robust data fusion algorithms that can efficiently com-bine data from several sensor nodes are greatly needed. This is particularly true for large-scale sensor systems where data fusion nodes are required to minimize data
transmission and data storage requirements. In order to avoid reducing the reasoning ability of the over-all network, it is clear that the data fusion must pre-serve relevant information. Accordingly, the challenge is to develop algorithms that can efficiently reduce the quantity of data without compromising key informa-tion. This challenge is also known as the dimension reduction problem [2].
Dimension reduction techniques are data re-representation methods that transform an initial dataset into a new dataset having a smaller number of variables. Such a reduction in the number of variables may bring several benefits: allows the application of modeling techniques that are practical only when there is a small number of variables, simplifies the visual-ization and interpretation of the data, and can help reduce noise in the data, which in turns can lead to improvements in the overall the overall performance of the models produced. In sensor systems, each sensor is a variable and dimension reduction techniques are applied within the data fusion nodes to combine the data from the various sensor nodes into a new smaller representation. This transformation helps minimize communications and facilitates the data analysis and reasoning tasks.
Techniques to reduce the number of variables can be divided in two categories: linear and non-linear. Two classical examples of linear techniques are princi-pal component analysis and factor analysis [3]. Non-linear techniques have the ability to capture relation-ships not taken into account by linear models and are therefore often considered more powerful but they are also more complex and computationally expensive. In this paper, we introduce a generic unsupervised non-linear dimension reduction technique that we perceive as practical for distributed sensor systems and sensor networks. Given examples of sensor measurements, the proposed method automatically learns data fusion models that can be easily implemented into data fusion nodes. Although the the learning of the data fusion models is computationally expensive, the run-time ex-ecution of the models requires minimal computational
resources.
We investigate the usefulness of the proposed technique using real-world complex data. The data consists of sensor measurements collected from aircraft engines during operation as well as derived measure-ments that are automatically added to the initial mea-surements to characterized the functioning of the sys-tems monitored. Using the technique proposed, all of these measurements are combined into a very smaller number of dimensions that can be easily displayed. The preliminary experimental results obtained show that the dimension reduction technique has been able to maintain the relevant information present in the initial datasets.
The paper has three additional sections. Section 2 introduces the proposed data fusion method. Sec-tion 3 describes the complex real-world dataset used for experimentation and discusses the results. Finally, Section 4 concludes the paper.
2
Nonlinear Space Transformations for
Information Fusion
The construction of a smaller feature space can be performed via a nonlinear transformation that maps the original set of objects under study 𝒪 into another space ˆ𝒪 of smaller dimension, with an intuitive metric. A feature generation approach of this kind implies in-formation loss as it usually involves a non-linear trans-formation (𝜑 : 𝒪 → ˆ𝒪). This approach has been used for data representation and visual knowledge explo-ration [4]. There are essentially three kinds of spaces generally sought [5]: i) spaces preserving the structure of the objects as determined by the original set of at-tributes or other properties (unsupervised approach), ii ) spaces preserving the distribution of an existing class or partition defined over the set of objects (su-pervised approach), and iii ) hybrid spaces.
Data structure is one of the most important ele-ments to consider and it can be approached by looking at similarity relationships [6, 7] between the objects, as given by the set of original attributes [4]. From this point of view, transformations 𝜑 can be constructed that minimize error measures of information loss [8], based on similarities or distances.
If 𝛿(⃗𝑥⃗𝑦) is a dissimilarity measure between any two objects ⃗𝑥⃗𝑦 ∈ 𝒪 , and 𝜁(ˆ⃗𝑥, ˆ⃗𝑦) is another dissimilar-ity measure defined on objects ˆ⃗𝑥, ˆ⃗𝑦∈ ˆ𝒪 (ˆ⃗𝑥= 𝜑(⃗𝑥), ˆ⃗𝑦= 𝜑(⃗𝑦)), a frequently used error measure associated to the mapping 𝜑 is:
𝒮𝑒= 1 ∑ ⃗ 𝑥∕=⃗𝑦 𝛿(⃗𝑥⃗𝑦) ∑ ⃗ 𝑥∕=⃗𝑦 ( 𝛿(⃗𝑥⃗𝑦) − 𝜁(ˆ⃗𝑥, ˆ⃗𝑦)) 2 𝛿(⃗𝑥⃗𝑦) (1)
In order to optimize the Sammon error measure, the classical Fletcher-Reeves algorithm is used. The Fletcher-Reeves method is a well known technique used in deterministic optimization [9]. It assumes that the function 𝑓 is roughly approximated as a quadratic form in the neighborhood of a 𝑁 dimensional point P. 𝑓(⃗𝑥) ≈ 𝑐−⃗𝑏⋅⃗𝑥+1 2⃗𝑥⋅A⋅⃗𝑥, where 𝑐 ≡ 𝑓 (P), 𝑏 ≡ −∇𝑓 ∣P and [A]𝑖𝑗 ≡ ∂ 2 𝑓 ∂𝑥𝑖∂𝑥𝑗∣P.
The matrix A whose components are the second partial derivatives of the function is called the Hessian matrix of the function at P. Starting with an arbitrary initial vector ⃗𝑔0 and letting ⃗ℎ0 = ⃗𝑔0, the conjugate gradient method constructs two sequences of vectors from the recurrence ⃗𝑔𝑖+1 = ⃗𝑔𝑖− 𝜆𝑖 A⋅ ⃗ℎ𝑖, ⃗ℎ𝑖+1 = ⃗𝑔𝑖+1− 𝛾𝑖A⋅ ⃗ℎ𝑖, where 𝑖 = 0, 1, 2, . . .
The vectors satisfy the orthogonality and con-jugacy conditions ⃗𝑔𝑖 ⋅ ⃗𝑔𝑗 = 0, ⃗ℎ𝑖 ⋅ A ⋅ ⃗ℎ𝑗 = 0, ⃗𝑔𝑖⋅⃗ℎ𝑗 = 0, 𝑗 < 𝑖and 𝜆𝑖, 𝛾𝑖 are given by 𝜆𝑖=⃗ℎ𝑖⃗𝑔⋅A⋅⃗ℎ𝑖⋅⃗𝑔𝑗𝑖, 𝛾𝑖=⃗𝑔𝑖+1⃗𝑔𝑖⋅⃗⋅⃗𝑔𝑔𝑖+1𝑖 .
It can be proven [9] that if ⃗ℎ𝑖 is the direction from point P𝑖 to the minimum of 𝑓 located at P𝑖+1, then ⃗𝑔𝑖+1 = −∇𝑓 (P𝑖+1), therefore, not requiring the Hessian matrix.
This kind of optimization is prone to local ex-trema entrapment (local minima in this case), there-fore it is recommended to try different solutions using different random initial parameter vectors.
The 𝜑 mappings obtained using the previously described approach are implicit, as the images of the transformed objects are computed directly and the al-gorithm does not provide a function representation. Hence, the accuracy of the mapping depends on the final error obtained in the optimization process. Ex-plicit mappings can however be obtained from these solutions using neural networks, genetic programming, and other techniques.
In general 𝜑 is a nonlinear function and in or-der to compare results from transformations obtained with different algorithms or different initializations, a canonical representation is preferred. It can be ob-tained by performing a principal component transfor-mation 𝒫 after 𝜑, so that the overall transfortransfor-mation is given by the composition
ˆ
𝜑= (𝜑▪ 𝒫 ) (2) referred to as the canonical mapping.
Since 𝒫 does not change the dimension of the new space, an advantage of the canonical mapping is to make easier the comparison of different solutions. It also contributes to the interpretability of the new variables, as they have a monotonic distribution of the variance.
3
A Case Study: APU Sensor Data
Fu-sion
This section demonstrates how the proposed non-linear space transformation method works on a real-world data fusion application involving APU sensor data. A description of the application domain is given, followed by the experimental results and their discus-sion.
3.1
The Application Domain
The Auxiliary Power Unit(APU) engines on com-mercial aircraft are mostly used at the gates. They provide electrical power and air conditioning in the cabin prior to the starting of the main engines and also supply the compressed air required to start the main engines when the aircraft is ready to leave the gate. APUs are highly reliable but they occasionally fail to start due to failures of the APU starter motor. When this happens, additional equipment such as generators and compressors must used to deliver the functionali-ties that are otherwise provided by the APU. The used of such external devices incur significant costs and may even lead to a delay or a flight cancellation. Accord-ingly, airlines are very much interested in monitoring the health of the APU starter motors and try to pro-ceed with preventive maintenance whenever a failure is suspected. The data comes from sensors installed at strategic locations in the APU which collect data at various phases of operation (e.g., starting of the APU, enabling of the air-conditioning, and starting of the main engines). The ultimate objective is to de-velop predictive models that can accurately determine the remaining useful life of the starter motors. We al-ready proposed a generic methodology to tackle this problem [10] but, as explained in the introduction, we believe that non-linear data fusion could help further improve the results obtained and could also facilitate the visualization and interpretation of the data.
For this study, we considered the data produced by a fleet of 35 commercial aircraft over a period of 10 years. Only ACARS (Aircraft Communications Ad-dressing and Reporting System) APU starting reports were made available. The dataset created from these reports consists of 18 original attributes (5 symbolic, 11 numeric, and 2 for date and time of the event).
More than 161000 observations are available for this task. Only a subset of these observations are rele-vant for learning the predictive models. These are the ones collected around each occurrence of component failures. In this particular task, we use engine oper-ating hours as the time unit. We based our analysis on data generated between 250 operating hours prior to the failure. A comprehensive search in the mainte-nance database revealed information on 83 occurrences of APU starter motor replacements. Each occurrence is associated with a time series. Moreover, each time series is distinguished with a unique pbmID and has the varied numbers of instances. To help characterize the functioning of the APU starter motors, we applied a number of statistical, time-series, and signal process-ing filters on the initial 11 numerical sensor measure-ments which produced an additional 188 new variables for a total of 198 numerical variables.
For completeness, we notice to other challenges in addition to the high dimension problem: irregular sampling rate and large variance due to contextual ef-fects.
Irregular sampling rateMost traditional time-series analytical techniques require a fixed interval be-tween measurements (e.g., every hour, every day, or every month). In this particular application, the data is systematically collected at every start of the APU. On the other hand, the data is not sent to the cen-tral system unless the on-board system decides to do so. Due to different configurations across the fleet and over time, we ended up having APU data at every start for some of the aircraft, at every other start for other aircraft and so on up to every 8 starts. Unequal sam-pling rate means that the time-series corresponding to the different failures have different lengths.
Large variance due to contextual effects Equipment such as aircraft operates in a very dynamic environment. Changes in this environment affect the behavior of the system. In some cases, these changes also affect the measurements taken. For instance, all measurements related to temperature, flow, and pres-sure are likely to be affected by the altitude of the aircraft. The mode of operation and the status of in-ternal sub-systems and components are also likely to affect the behavior of the performance parameters. All of these contextual effects need to be accounted for in order to understand the behavior of the key parame-ters.
With such a high dimension data space, it is im-possible to visualize the characteristics of the APU sensor data without data space transformation. Re-ducing the data space also helps address the challenges of irregular sampling rate and large variance. The fol-lowing subsections present the experimental settings and discuss results obtained from the application of
the proposed nonlinear data fusion technique on the APU data.
3.2
Experimental Settings
Two examples of Auxiliary Power Units were used for experimentation and for each of them Eq. 2 was used for computing new 3-D spaces by nonlinear trans-formation of the original 198-D space. For each case, 10 initial random configurations in the target space were tried when computing ˆ𝜑 and the solution with the best mapping error was kept (in order to cope with local minima).
If ⃗𝑥, ⃗𝑦 are any two vectors in the original p-dimensional space of sensor information, the dissim-ilarity measure used has the form
𝛿(⃗𝑥, ⃗𝑦) = 1
𝑆(⃗𝑥, ⃗𝑦)− 1 (3) where 𝑆(⃗𝑥, ⃗𝑦) is Gower’s similarity coefficient [11]. For numeric variables (the present case) it is given by
𝑆(⃗𝑥, ⃗𝑦) = 𝑝 ∑ 𝑖=1 1 − ∣ 𝑥𝑖− 𝑦𝑖∣ 𝑅𝑎𝑛𝑔𝑒(𝑖) (4) where 𝑥𝑖, 𝑦𝑖 are the corresponding i-th components of the vectors. A priori, there is no univocal indication about how many new dimensions are required in or-der to achieve a good similarity preservation between the original sensor space and the reduced target space for an arbitrary dataet. That is, how many dimen-sions would ensure an acceptable low mapping error (in many cases this is not achievable). In the present case two and three dimensional target spaces were tried in the first place because, if appropriate from the point of view of the mapping error values, they would allow a visual inspection of the transformed sensor data.
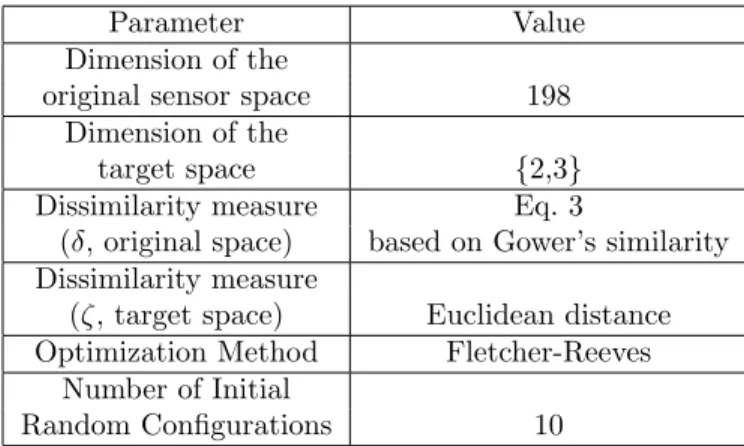
The experimental settings for the experiments are summarized in Table 1.
Parameter Value
Dimension of the
original sensor space 198 Dimension of the
target space {2,3} Dissimilarity measure Eq. 3
(𝛿, original space) based on Gower’s similarity Dissimilarity measure
(𝜁, target space) Euclidean distance Optimization Method Fletcher-Reeves
Number of Initial
Random Configurations 10
Table 1: Experimental settings for the computation of the reduced dimension spaces using canonical unsu-pervised nonlinear mapping.
3.3
Results and Discussion
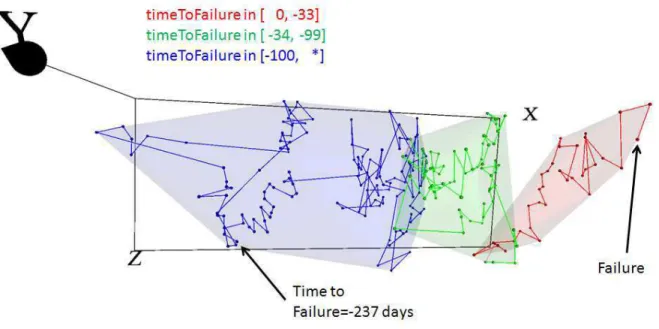
The implicit canonical 3-D mapping of the 198-D vectors (238 in total), corresponding to the APU-1 unit data is shown in Fig. 1. The small mapping error ob-tained (0.0131488), indicates that despite of the large amount of sensor space compression due to nonlinear dimensionality reduction, the amount of information lost is small. Therefore, the new 3-D space provides a reasonable representation of the overall data struc-ture from the point of view of the preservation of the similarity relationships defined by the original sensor variables.
For comparison purposes, the vectors have been classified into three categories (1: timeToFailure ∈ (−∞, −100] days, 2: timeToFailure ∈ [−99, −34] days, 3: timeToFailure ∈ [33, 0] days) and transparent closed surfaces wrap the vectors corresponding to the given classes in Fig. 1. It is important to note that the com-puted mappings are unsupervised, therefore this class information was not used in the process. However, the similarity preservation space recognizes well the time evolution of the APU-1 unit status from a far-from-failure states to close-to-far-from-failure situations.
From the point of view of the time evolution, a more detailed view is provided by a 3-D poluline join-ing consecutive observations startjoin-ing from the initial vector (237 days before failure), to the final one at failure time. This polyline represents the trajectory of the 198 individual time series from the original sensor space and enables a better understanding of the sys-tem’s evolution as failure contributing factors cumu-late and grow in influence on the process. The X-axis in the canonical nonlinear 3-D space (the one with the largest variance), clearly shows the time evolution of the failure classes: timeToFailure ∈ (−∞, −100] days is located at the low values end, whereas the timeTo-Failure ∈ [−99, −34] days and timeTotimeTo-Failure ∈ [33, 0] classes follows as the X-values increase. Therefore, the nonlinear X-axis represents an ’aging factor’ of the sys-tem.
As an attempt to investigate if further compres-sion of the original sensor space was possible, a canon-ical mapping into 2-D was computed. The mapping error was 0.026291, which although larger than the one for the 3-D case (as expected), is still rather low, indicating a good similarity preservation. For com-parison purposes, the time to failure associated to the mapped 2-D vectors was incorporated and a contin-uous function was interpolated using kriging in or-der to inspect the relationship between time to fail-ure and the new two nonlinear featfail-ures. The func-tion is shown in Fig. 2. Very clearly, the surface smoothly increases from high X-values (associated to far-from-failure states), to transitional states (middle
Figure 1: ℝ198
→ ℝ3mapping of the APU data corresponding to unit 1 (Mapping Error = 0.0131488). A 3D polyline links the consecutive points along the 198-dimensional original time series from the starting point (Time to Failure = -237) to the last (Time to Failure = 0). Semi-transparent surfaces wrap the three main classes: Time to Failure within 33 days or less, within 33 and 100 days and more than 237 days. The classes are reasonably well separated in the space resulting from the nonlinear information fusion process.
Figure 2: ℝ198
→ ℝ2 mapping of the APU data corre-sponding to unit 1 (Mapping Error = 0.026291).
X-values, higher slope and higher local surface vari-ance), to low X-values associated to close-to-failure sit-uations. A low degree polynomial function represent-ing 𝑡𝑖𝑚𝑒𝑇 𝑜𝐹 𝑎𝑖𝑙𝑢𝑟𝑒 = 𝑓 (𝑋, 𝑌 ) may serve as a good predictive model for time to failure prediction for APU units similar to APU-1 from the point of view of sensor information.
As a second experiment with the presented ap-proach, another APU unit was chosen at random (APU unit 20 with 184 vectors). A 3-D canonical mapping was computed from the original sensor data with a resulting mapping error of 0.010863. This er-ror is comparable to the erer-ror obtained for the APU-1
unit (even slightly better), indicating a good similar-ity preservation and a small information structure loss. The corresponding space is shown in Fig. 3 where sim-ilar conventions for the representation of the time to failure classes and the time evolution sequence for the vectors (the polyline) were used. The overall behavior is very similar to the one observed for the APU-1 unit case. There is a clear separation between the time to failure classes with a very small overlapping between the timeToFailure ∈ (−∞, −100] and the timeToFail-ure ∈ [33, 0] classes and a larger one between the timeToFailure ∈ [33, 0] and the timeToFailure ∈ [33, 0] classes (although involving only a few vectors). As in the APU-1 case, the X-axis values (decreasing) de-fine a clear time progression towards the failure time states. Since Euclidean distance is invariant to any linear transformation, a sign reversal of the X-values would give a pattern similar to the one observed in the APU-1 case without changing in the mapping er-ror. Therefore, both results are equivalent.
4
Conclusions
In this paper, a nonlinear data transformation ap-proach to data fusion is proposed. After presenting nonlinear data transformation techniques (focusing on the unsupervised, implicit type), a case study from a real-world application, APU sensor data fusion is
re-Figure 3: ℝ198
→ ℝ3mapping of the APU data corresponding to unit 20 (Mapping Error = 0.010863). A 3D polyline links the consecutive points along the 198-dimensional original time series from the starting point (Time to Failure = -237) to the last (Time to Failure = 0). Semi-transparent surfaces wrap the three main classes: Time to Failure within 33 days or less, within 33 and 100 days and more than 237 days. Conventions are those used for (Fig. 1). ported and two particular cases of APU units are
ana-lyzed. Experiments for dimensionality reduction were conducted. The experimental results indicate that nonlinear data transformation is a useful and effective approach to reducing data space while preserving the structure of the original data and relevant information as expressed by the original sensor variables. The re-sults also demonstrated that the transformed spaces help in understanding the characteristics of the sensor data.
The results suggest that meaningful relationships can be established between the nonlinear variables of the transformed spaces with the time to failure of the APU unit. Future work would investigate the utility of the dimension-reduced data for developing accurate models for time to failure predictions for APU starter motors.
References
[1] H. Durrant-Whyte, “Data fusion in sensor net-works,” in Proc. IEEE International Conference on Video and Signal Based Surveillance AVSS ’06, pp. 39–39, 2006.
[2] I. Fodor, “A survey of dimension reduction tech-niques,” tech. rep., Lawrence Livermore National Lab., CA (US), 2002.
[3] H. H. Harman, Modern Factor Analysis. Univer-sity Of Chicago Press; 3 edition, 1976.
[4] J. Vald´es, “Virtual reality representation of infor-mation systems and decision rules: an exploratory technique for understanding data knowledge
structure,” in Lecture Notes in Artificial Intelli-gence, LNAI, vol. 2639, pp. 615–618, Springer-Verlag, 2003.
[5] J. Vald´es and A. Barton, “Virtual reality spaces for visual data mining with multiobjective evolu-tionary optimization: Implicit and explicit func-tion representafunc-tions mixing unsupervised and su-pervised properties,” in Proceedings of the IEEE Congress of Evolutionary Computation, pp. 592– 598, 2006.
[6] L. Chandon and S. Pinson, Analyse typologique. Th´eorie et applications. Masson, 1981.
[7] I. Borg, Multidimensional similarity structure analysis. New York, NY, USA: Springer-Verlag New York, Inc., 1987.
[8] J. W. Sammon, “A nonlinear mapping for data structure analysis,” IEEE Trans. Comput., vol. 18, no. 5, pp. 401–409, 1969.
[9] W. Press, S. Teukolsky, W. Vetterling, and B. Flannery, Numerical Recipes in C. Cambridge, UK: Cambridge University Press, 2nd ed., 1992. [10] S. L´etourneau, C. Yang, and Z. Liu, “Improving
preciseness of time to failure predictions: Applica-tion to APU starter,” in Proceedings of the 1st In-ternational Conference on Prognostics and Health Management, (Denver, Colorado, USA), October 2008.
[11] J. C. Gower, “A general coefficient of similarity and some of its properties,” Biometrics, vol. 1, no. 27, pp. 857–871, 1973.