Assessing Decision Inputs in Drug Development between Small, Early Stage Companies and Big Pharma: Is There a Difference?
by Daniel S. Rippy
M.B.A. Finance & Marketing Columbia Business School, 1993
B.A. cum laude
Political Science and Spanish Macalester College, 1989
Thesis Proposal Submitted to the
Harvard-M.I.T. Division of Health Science and Technology (HST) August 10, 2007
in Partial Fulfillment of the Requirements for the degree of Master's of Science in Health Science and Technology
at the Massachusetts Institute of Technology
© 2007 Massachusetts Institute of Technology. All rights reserved.
Signature of Author: _ _ _
Harvard-M.I.T. Division of Health Science and Technology
Certified by: '·( •- -. Certified by: •S
Fiona Murray, Ph.D. Class of 1922 Career Development Associate Profes, " .lSloan School of Management Thesis Co-Advisor
Certified by: Certified b:
Kimberly M. Thompson, Sc.D. Associate Professor and Director, Kids Risk Project, Harvard School of Public Health Visiting Associate Professor, M.I.T. Sloan School Thesis Co-Advisor
Accepted by:
v .
i
Martha Gray, Ph.D.OCT
0 2007
LIBRARIES
Edward Hood aplin Professor of Medical and Electrical Engineering Director, arvard-MIT Division of Health Science & Technology
ARCHIVES
Assessing Decision Inputs in Drug Development between Small, Early Stage Companies and Big Pharma: Is There a Difference?
by
Dan Rippy Abstract
The pipeline productivity challenge facing large, publicly traded pharmaceutical companies, collectively referred to as "Big Pharma," is well known. The unprecedented success Big Pharma achieved over the past few decades in commercializing blockbuster products means that it is now faced with near-term patent expirations on such products, representing billions of dollars in lost sales and profits. In order to maintain its economic momentum, Big Pharma is increasingly relying on the universe of smaller, early stage biotechnology and pharmaceutical companies as a source of new products.
Early stage companies may offer Big Pharma something beyond simply more product bets. Several recent consulting studies have shown that economic returns to Big Pharma of products sourced externally are greater than those developed internally, which raises the question: What, if anything, are early stage companies doing differently from Big Pharma in their product development programs?
The goal of this thesis is to evaluate product development programs ("projects") and compare qualitatively and quantitatively the decisions for projects at key decision points between early stage pharmaceutical and biotechnology companies and Big Pharma. Given that much of the critical discovery and R&D work on pharmaceutical products happens both before and during a product's entry into human clinical trials, this thesis focuses on those areas of the development continuum where R&D plays a central role. The key decision points are therefore: lead candidate selection/optimization, moving a project from pre-clinical trials into Phase I human clinical trials, and moving a project from Phase I to Phase II clinical trials in humans.
The thesis tests the hypothesis that small, early stage, publicly traded U.S. & Canadian biotech and pharma firms (Small Pharma) focused on 1-2 therapeutic areas who high levels of
homogeneity in their decision making process, number of decision inputs, prioritization processes, and metrics for all three key decision points in the product development process irrespective of whether a product originates inside or outside the company. In comparison, Big Pharma companies will show heterogeneity in these variables for their projects. I have obtained data from primary interviews of industry executives within Big Pharma and Small Pharma firms. The therapeutic areas selected for the early stage company data set are: (1) cancer and autoimmune disease, (2) cardiovascular disease, and (3) infectious disease. The rationale for these therapeutic areas is that there is significant drug development activity taking place in these fields, and there are significant unmet medical needs within them. Additionally, both Big
Pharma and Small Pharma companies are developing products in these fields. I compare these data sets statistically using Fisher's exact test and Yates' chi-square test.
Thesis Supervisor: Fiona Murray, Ph.D.
Class of 1922 Career Development Associate Professor, M.I.T. Sloan School Thesis Supervisor: Kimberly M. Thompson, Sc.D.
Associate Professor and Director, Kids Risk Project, Harvard School of Public Health Visiting Associate Professor, M.I.T. Sloan School
In memory of my father, David R. Rippy
Acknowledgements
My participation in the Biomedical Enterprise Program would have been impossible without the love, support, and efforts of my wife, Laura. Laura, I will never be able to thank you enough for this gift. Similarly, my three children, Nathan, Benjamin, and Alexandra have been incredibly understanding of their father's absence from many family events during the past year. I will most definitely make it up to you guys.
The past year with the Biomedical Enterprise Program at the Harvard-MIT Division of Health, Science & Technology (HST) has been enormously fun, intense, and full of incredible learning opportunities. HST is a visionary institution and within it, the Biomedical Enterprise Program capitalizes on that vision. I am grateful to all those who have helped make it possible. At the end of the day, successful enterprises are about people, and there are many who deserve recognition.
I'd like to thank Martha Gray for serving as my academic advisor, and Fiona Murray and Kimberly Thompson for serving as my thesis advisors. I would also like to extend sincere gratitude to HST, Harvard, and MIT faculty members Rox Anderson, Emie Bemdt, Ray Chung, Richard Cohen, Teo Dagi, Howard Golub, Ali Khademhosseini, Stan Lapidus, Rick Mitchell, Bobby Padera, Fred Schoen, Shiladitya Sengupta, Tony Sinskey, and Martin Carey for your passion, inspiration, and support. Thanks also to Traci Anderson and the HST administrative team for all your support as well. Finally, I would like to thank the people who allowed me to interview them and who graciously shared their experiences, insights, and perceptions that provided the much needed data that I rely on in this work.
Thanks also to my classmates in the Biomedical Enterprise Program and HST. You are a great group of people and you will go on to do great things. I have enjoyed studying and working with you immensely. Thanks also to the HST alumni network, which has aided me in this thesis, and which will no doubt continue to help me in the future. The entire HST community exemplifies what W. Edwards Deming called a "yearning for learning." May our learning adventures together last a lifetime.
Table of Contents
A bstract ... 2 Acknowledgements ... . ... ... 4 Table of Contents ... ... ... 6 Table of Figures ... 8 C hapter I: Introduction ... 11The Benefits of Looking O utside ... 12
Selected Recent Studies on R&D Productivity and Licensing Activity in the Pharmaceutical Industry... ... 13
O bjective of Thesis ... . . 20
The Pharmaceutical Industry's R&D Productivity Challenge...21
The Challenge of Assessing Pharmaceutical R&D Metrics: NMEs & "Drug Quality"... 21
Costs of Drug Development ... 26
The Perception of an Industry R&D Productivity Gap... ... 27
The Pharmaceutical R&D Environment... 28
How Did We Get Here? A Look at the Changing Dynamics of Pharmaceutical R&D...28
Big Pharma Response to Recent Pressures...43
Is Big Pharma's Loss Small Pharma's Gain? ... 43
The Looming Challenge for Big Pharma in Sustaining R&D ... 46
Welcome to Niagara Falls: The Impending Wave of Drug Patent Expirations...48
What Has Changed and What Hasn't in Global Pharmaceutical R&D...50
Towards Increased Licensing and Collaboration ... 52
Chapter 2: Hypothesis Development and Methods ... 54
T he S urvey ... ... 54
Testing the Hypothesis... ... ... 56
M etho d s ... 5 8
The Hypothesis ... 59
R e s u lts ... 5 9 Chapter 3: Findings...70
Discussion of Results ... 70
Chapter 4: Limitations and Insights... ... 79
W hat Happens in Mid-Sized Pharma Firms? ... 80
The Market's Quest for Efficiency ... 81
Implications for Future Study... ... ... 81
References ... ... ... 83
Chapter 5: Exhibits ... ... ... 86
Exhibit 1: Big Pharma Companies...87
Exhibit 2: Small, Publicly Traded U.S. and Canadian Pharma and Biotech Companies with a Majority of Programs in Cancer & Autoimmune, Cardiovascular, and/or Infectious Diseases... ... 88
Exhibit 3: Questionnaire... ... 90
Exhibit 4: Interviewees ... 94
Exhibit 5: Fisher's Exact Test and Yates' Chi-Square Test ... 95
Exhibit 6: Big Pharma Executive Interview Data...98
Exhibit 7: Small Pharma Executive Interview Data ... 99
Table of Figures
Figure 1: Clinical Approval Success Rates for NCEs by Origin and Period During Which a First IND W as Filed... ... ... 13 Figure 2: Selected Recent Studies on R&D Productivity and Licensing Activity in the
Pharmaceutical Industry and Findings... 15
Figure 3: PhRMA Member Firm FDA NME Approvals and R&D Spending by Year, 1992-2006... ... 23 Figure 4: The Decline in NME Output per R&D Dollar, 1974 -2002 ...24 Figure 5: Global Pharmaceutical & Biotech R&D Spending Compared to Commercial
Investigational New Drugs ... ... 25 Figure 6: Global Pharma & Biotech R&D Spend and IND Filings and Trends, 1993-2004....26
Figure 7: Selected Knowledge Driven Components of Drug Development in the Genomic
Age... ... ...30 Figure 8: Levels of Organism in Which Knowledge Must be Integrated in the Genomic
Age... ... ... 31
Figure 9: Growth Rates in Top Line Sales of PhRMA Member Firms, 1981-2006, and
Trend Line Plotted against 9.3% Annualized Growth Rate in R&D Labor
C osts, 1981-2000 ... 31
Figure 10: Breakdown of Global Pharmaceutical R&D Costs, 2006...33 Figure 11: Comparison of Share Price Performance of Selected Merged Big Pharma
Pharmaceutical Firms and Organic Growth Big Pharma Firms, 1995-2002...35 Figure 12: Price to Earnings Multiples of Selected Big Pharma Firms based on Projected
Earnings, 2006E-2011E ... 38 Figure 13: Valuation of Fourteen Big Pharma Firms, 2000-2005... 40 Figure 14: The Drug Development "Funnel" of Candidates Tested by Phase, Timing, and
C o sts ... . . 4 1 Figure 15: Market Capitalizations of Top U.S. Pharma Companies and all Biotechnology
Companies, 2002-2005... ... ... 45 Figure 16: Market Capitalizations of Small Pharma Firms (n=60) (fist Y axis) and Fourteen
Big Pharma Firms (second Y axis), 2002-2006... ... 46 Figure 17: Historic and Projected Sales (2001-2013) and R&D Expenditure (2001-2009)
Figure 18: FDA Generic Drug Approvals, 1999-2005 ... ...48
Figure 19: Historic and Estimated Sales of Drug Products Going off Patent in the U.S. by Year of Patent Expiration, 2006-2013E... 49
Figure 20: Business Expenditure in R&D (BERD) by Geographic Region, 1990-2004... 52
Figure 21: Roles of Big and Small Pharma Interviewees in Their Organizations ... 57
Figure 22: Number of Big and Small Pharma Interviewees by Function... 57
Figure 23: Interviewee Length of Experience with Big Pharma Firms (n=26) and Small Pharm a Firm s (n=19) ... 60
Figure 24: Estimated Number of Drug Development Projects by Firm Type [Big Pharma (n=25), Sm all Pharm a (n=19)] ... 61
Figure 25: Big Pharma Interviewee (n=25) and Small Pharma (n=19) Estimated Percentages of Company Projects Sourced Internally and Externally ...61
Figure 26: Assessing the Decision Making Process - Lead Optimization/Selection...62
Figure 27: Assessing the Decision Making Process - Transitioning a Project from Pre-Clinical to Phase 1...63
Figure 28: Assessing the Decision Making Process - Transitioning a Project from Phase 1 to Phase 2...64
Figure 29: Assessing Differences in Numbers or Types of Decision Inputs of a Drug Development Project on the Basis of Whether It Was Developed Internally o r E xte rna lly ... ... .. 65
Figure 30: Assessing Prioritization of a Drug Development Project on the Basis of Whether It Originated Inside or Outside the Company ... 66
Figure 31: Assessing the Metrics Used to Evaluate a Drug Development Project on the Basis of Whether It Originated Inside or Outside the Company ... 68
Figure 32: Summary of p Values Using Fisher's Exact Test and Yates' Chi-Square Test Comparing Big Pharma to Small Pharma Interview Responses Using Only Small Pharma Data from Those Executives Whose Firms Had In-Licensed Products ... 73
Figure 33: Hypergeometric Distribution of the Exact Probability of Observing a Table with Cells a, b, c, and d... 95
Figure 34: General Layout of Fisher's Exact Test ... 95
Figure 35: Short Computational Form for Yates Corrected Chi-Square Test for 2 x 2 Contingency Tables ... 96
Figure 36: Short Computational Form for Yates Corrected Chi-Square Test
Chapter
I:
Introduction
In recent years, pharmaceutical industry research and development (R&D) productivity has been assessed, discussed, and debated intensively. Faced with patent expirations from
2006-2013 on products that will have generated sales of over $100 billion in the U.S. alone during that
time,' 6 the pharmaceutical industry's leading companies must confront a double challenge: to replace sales and profits lost as the result of product patent expirations, and to grow profits for shareholders. Ostensibly, the most straightforward way for them to address both challenges is to continue to do what they have done historically: commercialize new products that offer improved therapeutic outcomes to patients versus existing therapies. However, the magnitude of the task is unprecedented within the industry, and it begs the question: can an industry maintain such a spectacularly successful run of innovation and productivity?
For the past few decades, large pharmaceutical companies ("Big Pharma;" see Exhibit 1 for definition) have licensed and acquired products from outside sources such as smaller, early-stage pharmaceutical and biotechnology firms (as well as universities) to augment product pipelines and enhance prospects for sales and profit growth. While the degree to which companies historically engaged in this activity has varied, virtually all now make it a strategic imperative. Merck exemplifies this trend. In 1999 the company did only 10 licensing deals, whereas it signed 50 in 2004.7 Going back further, Danzon et al found that the top 20 pharmaceutical firms did an average of 1.4 licensing deals per year with a biotechnology company from 1988-1990, but 5.7 such deals from 1997-1998." PricewaterhouseCoopers found in a 1998 report that the number of alliances per year had more than doubled in the industry from 1989 to 1998, from 248 to 635 per year.9 Certainly the number of deals does not take into account important parameters such as the potential value of a given deal. However, given the relatively low odds of success of any single early-stage drug development project, the number
of deals has a probabilistic impact on success, and is therefore a metric that is often tracked by industry analysts.
The Benefits of Looking Outside
Recent studies suggest that Big Pharma benefits economically from looking beyond its own walls for new products."1 Studies by McKinsey & Company and Mercer Management
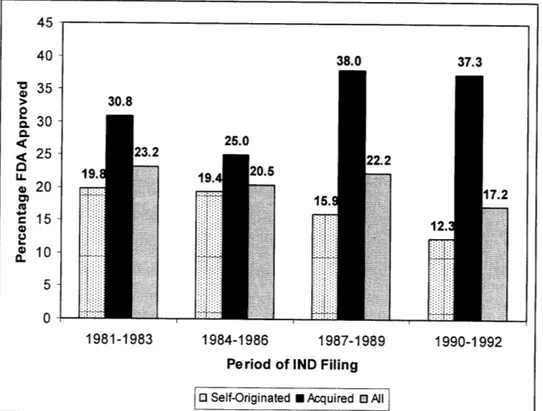
Consulting from 2004 and 2003, respectively, have found that products in-licensed by top ten Big Pharma companies have higher rates of success in obtaining marketing approval than internally developed products, and furthermore, in-licensed products generate higher rates of return.1' 1 0 DiMasi showed that by the end of 1999, the percentage of investigational new drug
applications (INDs) of externally acquired new chemical entity (NCE) products filed from 1981 to 1992 that had been approved by the FDA was 33.1%, as compared to 16.9% for all internally developed products.12Key findings from the DiMasi study are illustrated in Figure 1.
Figure 1. Clinical Approval Success Rates for NCEs by Origin and Period During Which a
First IND Was Filed. 12
38.0 37.3
30.8
25.0
1:
Period of IND Filing
[ Self-Originated U Acquired 0 All
Selected Recent Studies on R&D Productivity and Licensing Activity in the
Pharmaceutical Industry
Figure 2 below summarizes selected recent studies on pharmaceutical R&D productivity as well as success rates of externally sourced pharmaceutical products compared to those that were internally developed. Several key themes from these studies include:
* Product licensed by Big Pharma from the outside have higher success rates of approval and higher rates of return on investment compared to internally developed products. * Licensing deals and strategic alliances between Big Pharmas and Small Pharmas have
increased dramatically within the last twenty years.
* Pharmaceutical companies stand to gain economically by licensing programs from other companies - even taking into account failures.
40 -a 35 -30 a-< 25 - S20-
S15-
10-05-:2;
1984-1986 19A7-lq8q 1Q4n-1oc3 30.8 - ----r-38.0 37.3* Regulatory and economic incentives appear to motivate for the expanded development of existing chemical entities (i.e., pursuing approvals of new indications for an already approved drug) in favor of developing new chemical entities (NCEs)
* Increasing organizational bureaucracy and unprecedented Big Pharma firm size appear to adversely impact pharmaceutical R&D success.
These findings have important implications for the ways in which the pharmaceutical industry might manage its R&D efforts to enhance its prospects for success going forward.
Licensing from smaller firms is not the only way in which Big Pharma can augment its pipeline; buying smaller firms outright via mergers & acquisitions is another. Ernst & Young estimates that the top 40 pharmaceutical and biotechnology companies spent $16 billion in 2006 acquiring 20 specialty pharma and biotech companies.13 While such investment is hardly in the same economic league as the mega-mergers of Pfizer and Warner-Lambert or Glaxo Wellcome and SmithKline Beecham, both in the year 2000, it is notable in that many of these deals are for companies with early stage technologies that will require substantial further investment to commercialize the assets acquired. Mega-mergers historically gave the newly merged companies "breathing room" to grow sales and earnings through organizational synergies that often had little to do with new product development. Commonly, such synergies in Big Pharma mergers have been derived more from cost-cutting measures in administrative and sales force organizations and less from R&D productivity, though rationalizations of R&D pipelines - for the benefit of cost savings - have certainly been pursued.
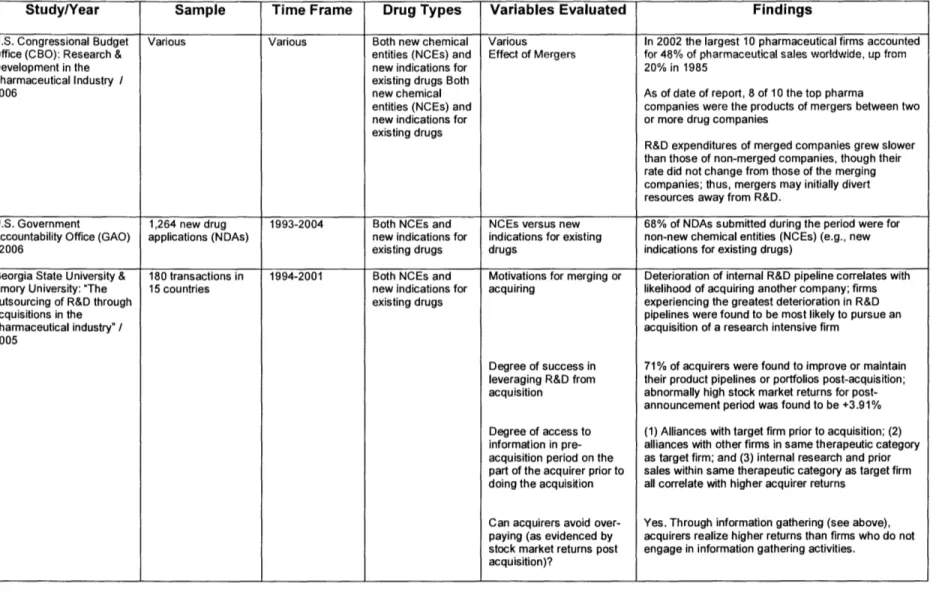
Figure 2. Selected Recent Studies on R&D Productivity and Licensing Activity in the Pharmaceutical Industry and Findings.8,9,14-25
Study/Year Sample Time Frame Drug Types Variables Evaluated Findings
U.S. Congressional Budget Various Various Both new chemical Various In 2002 the largest 10 pharmaceutical firms accounted Office (CBO): Research & entities (NCEs) and Effect of Mergers for 48% of pharmaceutical sales worldwide, up from
Development in the new indications for 20% in 1985
Pharmaceutical Industry / existing drugs Both
2006 new chemical As of date of report, 8 of 10 the top pharma
entities (NCEs) and companies were the products of mergers between two new indications for or more drug companies
existing drugs
R&D expenditures of merged companies grew slower than those of non-merged companies, though their rate did not change from those of the merging companies; thus, mergers may initially divert resources away from R&D.
U.S. Government 1,264 new drug 1993-2004 Both NCEs and NCEs versus new 68% of NDAs submitted during the period were for
Accountability Office (GAO) applications (NDAs) new indications for indications for existing non-new chemical entities (NCEs) (e.g., new
/2006 existing drugs drugs indications for existing drugs)
Georgia State University & 180 transactions in 1994-2001 Both NCEs and Motivations for merging or Deterioration of internal R&D pipeline correlates with
Emory University: "The 15 countries new indications for acquiring likelihood of acquiring another company; firms outsourcing of R&D through existing drugs experiencing the greatest deterioration in R&D
acquisitions in the pipelines were found to be most likely to pursue an
pharmaceutical industry" / acquisition of a research intensive firm 2005
Degree of success in 71% of acquirers were found to improve or maintain
leveraging R&D from their product pipelines or portfolios post-acquisition; acquisition abnormally high stock market returns for
post-announcement period was found to be +3.91% Degree of access to (1) Alliances with target firm prior to acquisition; (2) information in pre- alliances with other firms in same therapeutic category acquisition period on the as target firm; and (3) internal research and prior part of the acquirer prior to sales within same therapeutic category as target firm doing the acquisition all correlate with higher acquirer returns
Can acquirers avoid over- Yes. Through information gathering (see above), paying (as evidenced by acquirers realize higher returns than firms who do not stock market returns post engage in information gathering activities.
Study/Year Sample Time Frame Drug Types Variables Evaluated Findings
Boston Consulting Group / -Top 10 Various Both NCEs and -Dollar productivity From 1991-2001, most revenue growth for top 2004 pharmaceutical depending on new indications for biotechnology & pharmaceutical companies came
companies parameter: existing drugs from an increase in the number of blockbusters
-Top 10 biotech 1980s, 1990s,
companies 2004 The number of blockbusters is approaching
-All but top 10 "equilibrium" - i.e., the number of blockbusters going
biotech companies off patent will soon equal or exceed the number of new blockbusters being launched in a given year
Increasing complexity in terms of larger organization and size of R&D budget may bring economies of scale but also results in less organizational knowledge about each project
Scale disadvantages larger firms relative to the "intimate... dialogue and partnering enjoyed by academia and small biotechs," and thus impedes progress in highly insight-driven elements of the value chain, such as medicinal chemistry or protocol design
-Capitalization Small biotechnology companies were found to have
- Products in Pipeline less than 10% of the biopharmaceutical industry's cash yet 67% of the industry's pipeline in 2003 External sources (i.e., licensing partnerships) are cited as one of the key "remedies" to the biopharmaceutical industry's R&D product pipeline challenges.
Boston Consulting Group: 2500 compounds Point in time: Both NCEs and Status: licensed or not 1,000 of the available compounds were licensed at
"The Gentle Art of ("Worldwide Clinical 2004 new indications for time of study Licensing" / 2004 Pipeline") within existing drugs Both
small NCEs and new Compounds were being licensed at rate of 10% per
biopharmaceutical indications for year
companies existing drugs
Supply (e.g., new compounds available) were growing at 2% per year
Only 30% of remaining compounds would be
"suitable" for licensing
Thus, a shortage in available compounds for licensing was predicted.
Study/Year Sample Time Frame Drug Types Variables Evaluated Findings
McKinsey & Company / -Top 10 1995-2001 Both NCEs and Cost of development Pre-clinical development costs range from $21 to $29 2004 pharmaceutical new indications for million for internally developed compounds versus $14
companies' existing drugs - $19 million those that are in-licensed
preclinical
compounds and 77 Internal compounds fail more often in Phase 2 than
in-in-licensed licensed ones
preclinical compounds
1997- 2001 Both NCEs and Average cumulative four year Virtually no difference in average cumulative revenues - 71 internal and 73 new indications for revenues was found for first four years of commercialization
in-licensed existing drugs between internal and externally sourced compounds.
compounds Success in progressing to
1998-2000 Both NCEs and commercialization Licensed compounds were successful in 27% of
- 1,448 compounds new indications for cases (Phases 1-3) while internal candidates were existing drugs successful only 14% in these stages.
McKinsey & Company Top 10 Pharma & 1997 -2002 Both NCEs and Compounds in Development Total number of compounds in development in all Trends in R&D Productivity Other Companies new indications for phases grew from 5,015 in 1997 to 5,604 in 2002; and Implications for Japan / existing drugs during that time, Top 10 Pharma's share of these
2004 programs declined as a percentage of total from 25%
to 15% and also declined in total number
R&D Costs 1991-2001 Compounds in development R&D costs for Top 10 pharma companies and other companies were $7B and $5B, respectively in 1991 and $12B and $19B in 2001; CAGRs for R&D were
6% and 14% respectively during the time period, with
development costs far exceeding research costs. Japanese firms were found to be producing more than twice (2x) as many compounds per dollar of R&D spend; however, they were not as successful as global leaders in terms of commercial sales or in return on R&D spend; partnerships and alliances were cited as two ways for Japanese companies to close the gap.
Long Island University / Two mergers in 1981-1989 NCEs only Cost per NME of merged First wave: Cost per NME in constant dollars Koenig & Mezick / 1989 ("first wave"); 1994-1996 versus non-merged increased by 65% compared to an increase of 101% 2004 Five mergers from 1990-2000 companies for non-merged companies
1994-1996 ("second
wave"); Second wave: Cost per NME in constant dollars
Eight comparator increased by 17% compared to an increase of 93% for
non-merged non-merged companies
Study/Year Sample Time Frame Drug Types Variables Measured Findings
Danzon, Nicholson, Pereira 900 firms 1988-2000 Both NCEs and Phase-specific success rates Firm experience and experience within therapeutic
/2003 new indications for based on category do not matter for Phase I but do correlate
existing drugs Overall firm experience with success beyond Phase I Firm experience within
therapeutic category Development alliances occurs for majority of Diversification of firm compounds by Phase 2 or 3
experience
Firm alliances with large and Products developed in alliances have higher small firms probability of success in Phase 2 and 3, especially
if licensor is a large firm (a firm with > 25 _compounds in development).
Mercer Management 68 compounds 1995-1999 Both NCEs and Success in clinical In-licensed products had higher rates of clinical Consulting / across 10 leading new indications for development development success at all stages (47%, 14%, and
2003 pharmaceutical existing drugs 38% at pre-clinical, Phase 1-2, and Phase 3,
companies respectively)
Approved in-licensed compounds attained relatively lower (76%) sales than internally sourced
compounds
Internal rates of return on in-licensed compounds were higher than internally developed ones (3.1% at Pre-clinical, 4.0% at Phase 1-2, and 8.2% at
Phase 3, compared to 2.1% for all internally developed compounds). IRR of in-licensed
compounds improved with stage of licensing. DiMasi, Hansen & 68 NCEs randomly 2000 NCEs Capitalized out of pocket Capitalized out of pocket costs for an NCE to the Grabowski / selected from 10 costs of an NCE to point of point of marketing approval = $802MM in 2000
2003 pharmaceutical marketing approval dollars.
firms
McKinsey & Company / Top 12 pharma 1991-2002 Both NCEs and Simulated Monte Carlo Pharma companies could dramatically increase the 2002 company licensing new indications for analysis based on industry amounts paid for licenses in early development
deals with existing drugs Both averages to determine: (150% more in most cases at the pre-clinical stage) biotechnology firms NCEs and new - optimal time of licensing
from 1991 - 2002 indications for - value realization by firm A pharma company reaped maximum value in 85% existing drugs type by phase of of cases by licensing (where a license deal could
development. be negotiated) at the pre-clinical phase Pharma companies capture greatest expected value from pre-clinical licensing virtually 100% of the time because greater risk of failure was more than offset by low deal terms at this early development stage; biotech firms reap maximum value in Phase 2 or 3
If deal terms were economically more attractive to biotech firms, licensing at earlier stages could become more attractive due to incremental upside.
Study/Year Sample Time Frame Drug Types Variables Evaluated Findings
DiMasi / 671 NCEs 1981-1992 NCEs only Time from investigational new Out of 508 Self-originated NCEs and 163 acquired Clinical Pharmacology & drug (IND) filing to NCEs, by end of 1999:
Therapeutics / abandonment or approval
2001 20.9% of NCEs with INDs filed from 1981 to 1992
had been approved for US marketing
Success rates for types of NCEs were as follows:
NCES that were acquired: 33.1%
NCEs that were self-originated: 16.9%
NCEs that were self-originated and first tested in humans in the US: 8.6%.
Mean residence time (time to either approval or research abandonment) declined from the
1981-1983 interval to the 1990-1992 interval by 30% (1.5
years).
Median survival time decreased 12% from 4.9 years to 4.3 years for the 1981-1983 to 1990-1992 filing intervals, respectively.
PriceWaterhouseCoopers: Various 1996-1998 Both new chemical R&D spending of U.S. U.S. pharmaceutical and biotech companies spent
"Pharma 2005" / entities (NCEs) and pharmaceutical and biotech $6.5B on R&D in 1988 and an estimated $21.1
1998 new indications for companies billion in 1998
existing drugs
Number of pre-clinical From 1996-1998, the number of compounds in pre-candidates in the clinical testing were as follows:
pharmaceutical industry 1996: 2,853
pipeline 1997: 3,102 1998: 3,278
Qualitative observations "... many research scientists tell us that they do not about process of research find working in large organizations conducive to
originality, lateral thinking, and innovation." Number of strategic alliances From 1988 to 1998, the number of strategic in the pharmaceutical alliances more than doubled from 248 to 635 per
Objective of Thesis
The preponderance of evidence suggests that projects selected by Big Pharma for in-licensing are more successful than those that are developed within the firm. Such evidence raises an
important question: what is it about these extemally initiated projects that renders them more successful? On the surface, if Big Pharma firms were rational, we would expect that on the margin internal and external projects would be equally successful. There are several possible explanations for the differences observed. First, it may be that Big Pharma gives more attention to in-licensed products and they must therefore meet a higher standard for incorporation into the portfolio. The corollary to this idea is that internal projects are more difficult to "kill" or terminate. Secondly, external projects produced by smaller firms may indeed be of higher quality, supported by more thorough evidence or evaluated on different (more objective) criteria. IN order to examine this question, this thesis explores differences in decision-making processes in two different organizational settings: Big Pharma and Small Pharma.
The specific objective of this thesis is to evaluate whether there is a difference in the ways in which Big Pharma companies and smaller pharmaceutical and biotechnology companies make decisions around and prioritize drug development projects on the basis of whether a project was sourced internally or externally (see Exhibits 1 and 2 for definitions of "Big Pharma" and "Small Pharma," respectively. Specifically, I seek to evaluate selected decision points at both Big Pharma and Small Pharma companies to see if there are discernible differences - either quantitatively or qualitatively - in how which each approaches the drug development process based on the origination of the project (internal or external). Given the results of numerous studies over the past few years, one would hypothesize that there is something different about the way in which the two types of firms manage drug development based on whether a project originates externally or intemally.
The Pharmaceutical Industry's R&D Productivity Challenge
In purely economic terms, the pharmaceutical industry, like any other, is challenged to exceed its past performance in the form of earnings growth. Thus, the industry is tasked by investors and shareholders with the challenge of becoming more productive over time. From an investor perspective, gauging the productivity of a business is fairly straightforward. Return on investment (ROI) should increase over time. Other metrics, such as return on capital employed (ROCE) and return on equity (ROE), also help gauge economic productivity. In the pharmaceutical industry, though, where a drug typically takes twelve years or more to be developed, capital can be employed for extended periods of time before generating a return, thus adding to the complexity of assessing industry performance. Nonetheless, the economic metrics of the pharmaceutical industry are perhaps the easiest to assess when one can consider a long period of time historically, such as ten years or more. However, in trying to evaluate shorter-term industry performance and productivity through various other metrics, the challenge becomes far greater.
The Challenge of Assessing Pharmaceutical R&D Metrics: NMEs and "Drug
Quality"
Numerous metrics have been used to assess the productivity of R&D spending within the pharmaceutical industry. The Pharmaceutical Research and Manufacturers of America (PhRMA) tracks annual R&D spending as well as FDA approvals of new medical entities (NMEs) of its member companies, and while PhRMA member firms' R&D spending constitutes only a portion of that for the industry as a whole, it is often used in literature as a barometer for the industry. Sales and total number of new products launched, two other closely monitored metrics, are often measured against R&D spending in a given year. However, it has been noted
that in attempting to assess pharmaceutical R&D productivity, one needs to look ahead in future years to determine the impact of R&D spending in a given year, since the results of such R&D expenditures in terms of products approved, sales, and profits are realized in the future on a rolling basis (i.e., they do not all accrue in one year).
The use of NMEs as a metric of R&D productivity has its challenges and can be misleading. Berndt et al have pointed out that innovation within the pharmaceutical industry can take different forms, such as expanded indications for existing drugs that are supported by new clinical studies, new dosage forms, and new formulations.26 Such expanded efforts for existing
products require significant investment in R&D and often have highly positive economic returns.
Nonetheless, industry observers and participants alike, including the FDA and other government entities, continue to assess pharmaceutical R&D spending and NME approvals as two important industry metrics. In utilizing data from the U.S. Pharmaceutical Research Manufacturers Association (PhRMA), such metrics generally yield a picture of escalating R&D spend with a concurrent declining trend in the number of NMEs approved since the 1998-1999 time frame, as
Figure 3. PhRMA Member Firm FDA NME Approvals and R&D Spending by Year, 1992-2006. $50.0 $45.0 $40.0 $35.0 g $30.0 $25.0 5 $20.0 m $15.0 o $10.0 $5.0 1992 1993 1994 1995 1996 1997 1998 1999 2000 2001 2002 2003 2004 2005 2006
Source: Pharmaceutical Research Manufacturers of America (PhRMA). Years 1996-2006 include both FDA Center for Drug Evaluation and Research (CDER) reviewed products as well as those transferred into CDER from the Center for Biologics Evaluation and Research (CBER).
Figure 4 represents another look at the situation. Booth and Zemmel looked at NME output per R&D dollar in 2004.27 As can be seen, NME output per dollar, normalized to 1970-1975 average dollar values, has declined on a prolonged basis.
Figure 4. The Decline in NME Output per R&D Dollar, 1974-2002.
Sources: PhRMA, Parexel Pharmaceutical R&D Statistical Sourcebook, McKinsey & Company.
The rationale for using NME output as a metric to evaluate the industry is that an NME is essentially by definition a newly-patented product and is therefore the purest form of product innovation. While companies can extend market exclusivity on existing products by developing new indications (in the U.S., for example, three-year extended exclusivity is permitted through new use/new clinical studies by an applicant for new indications for an already approved drug), doing so does not provide the same period of market exclusivity that might be realized by a newly issued patent on an approved NME.
However, as a 2006 U.S. Congressional Budget Office (CBO) report observes, the metric of
NME approvals does not take into account "drug quality," which can have also have a significant
120 , 100
80
80 0 40 CL 20 o 20 Z 0Year Ending five-year frame
impact upon productivity.14 Unfortunately, defining and measuring quality can be difficult. Few studies have attempted to define drug quality, and it remains a debated term.
Figure 5. Global Pharmaceutical & Biotech R&D Spending Compared to Commercial Investigational New Drugs.
590 $80 $70 $60 $50 $40 $30 $20 $10 $-BUU 700 600 500 400 300 200 100 0 1993 1994 1995 1996 1997 1998 1999 2000 2001 2002 2003 2004
am= Pharmaceutical R&D egaga Biotech R&D -*- NDA+BLA - -NME -- IND
Sources: CDER, CMR, Ernst & Young, Goldman Sachs, Pharmaceutical Product Development (PPDI).
When taking into account not only NMEs but also new drug applications (NDAs) on a global level, the picture is similar in terms of flat to declining numbers of NDAs and NMEs in the pipeline compared to growing R&D spending both within pharmaceutical and biotechnology companies (Note: please refer to Chapter . Figure 5 shows industry output compared to R&D expenditure from 1993-2004. A look at the trend lines shows that global R&D spending has
increased at the rate of 7.9% per year since 1993, whereas the number of INDs filed has grown at 1.1% per year since that time. These figures, as well as their trend lines, are plotted against each other in Figure 6 below.
Figure 6. Global Pharma & Biotech R&D Spend and IND Filings and Trends, 1993-2004. $90 $80 $70 $60 $50 $40 $30 $20 $10 $-800 700 600 500 400 z 300 200 100 0 1993 1994 1995 1996 1997 1998 1999 2000 2001 2002 2003 2004 --- Total R&D - -- - INDs
Sources: CDER, CMR, Ernst & Yong, Goldman Sachs, Pharmaceutical Product Development (PPDI).
Costs of Drug Development
On a pure cost basis, costs of drug development per NDA have risen steadily over time. Cost estimates for developing an NDA drug candidate range from $802 million23 from DiMasi et al to a Bain & Company estimate of $1.7 billion.28 While in the past, increases in R&D costs could be absorbed due to top line sales growth in Big Pharma firms, the question of whether such expenditures can be sustained in the wake of declining sales and fewer NDA/BLA filings per R&D dollar becomes relevant due to future patent expirations on large-selling Big Pharma products. We will look at this question in more detail later.
The Perception of an Industry R&D Productivity Decline
While various metrics pose challenges in assessing whether there is a productivity decline in pharmaceutical R&D, a cursory view of industry and academic literature reveals a broadly held perception that a productivity gap exists. Indeed, the CBO 2006 report states that:
"In the absence of comprehensive, statistical measures, the drug industry's performance can be considered qualitatively. Even if drug quality has been increasing, the industry's performance may still have declined, for several reasons."14
The CBO report cites several factors that suggest pharmaceutical R&D productivity has declined, such as a decline in number of drugs approved per dollar of R&D and a growing share of industry R&D investment expended on "incremental" improvements to drugs.14 The report
cites several possible causes for a decline in pharmaceutical industry R&D productivity. They include: the ebb and flow of scientific innovations and discoveries (as opposed to linear progression); increasing technological complexity; rising real wages without an accompanying increase in R&D output; and increased current R&D spending as investment in higher future productivity.14 To these factors, we can add several proposed by Cuatrecasas, such as: the sheer mass and complexity of today's large pharmaceutical organizations (e.g., Big Pharma) which perpetuate bureaucracy and discourage innovation; the lack of understanding among Big Pharma management, Wall Street, and investors regarding the drug development process and timeline; and the decline of the role of the "champion" in drug development.29 We explore these factors and how they may be impacting pharmaceutical R&D in the next section.
The Pharmaceutical R&D Environment
Significant debate has ensued recently as to whether the "blockbuster" model of Big Pharma, that of commercializing products that realize a billion dollars (often multiple billions of dollars) in sales, is viable or sustainable.30 Rather than targeting cost saving synergies from blockbuster
selling organizations, the smaller acquisitions described above have focused more on specific types of technology and expertise than on cost savings synergies. While creating big-selling, blockbuster products will likely always be a consideration in Big Pharma's strategic approach to drug development, a number of questions arise as to the ways in which it might seek to produce new products going forward - blockbuster or not. How should Big Pharma develop new products? What strategies should it employ to produce products that can enjoy longer life cycles? How can licensing products from the outside augment the process? An examination of the pharmaceutical R&D environment in general may explain some of the strategies by which both Big Pharma and Small Pharma are approaching the development of next-generation therapies and why they are evolving. Factors that may impede productivity could be driving changes in the way the pharmaceutical industry performs R&D as it attempts to become more efficient.
How Did We Get Here? A Look at the Changing Dynamics of Pharma R&D
To gain some appreciation for the pharmaceutical R&D environment as it exists today, it is worth elaborating upon the factors cited above as possible contributors to a decline in pharmaceutical R&D productivity. There are no doubt other potential factors to be explored, although Cuatrecasas notes that some of these, such as inadequate staffing and budgetary allocation of regulatory bodies such as the FDA, are merely symptomatic of more fundamental
challenges relating to factors such as pharmaceutical company corporate culture, understanding of science, management, and organizational structure, to name a few.29 Certain key trends within the industry, such as the explosive growth of partnerships, as well as unprecedented levels of venture capital going into the life sciences, are being driven by, and in response to, these factors. (Note: $2.58 billion of venture capital was invested in U.S. based biotechnology and medical device start-up companies in the first quarter of 2007, all time highs for both categories.31 In this context, the term "biotechnology" is all encompassing for companies focused on any type of drug development research, including that of traditional pharmaceuticals).
The Ebb and Flow of Scientific Discoveries. With respect to ebb and flow of scientific discoveries, a new scientific finding may lead to a series of quick, new innovations - the "easy" discoveries.16 Following these, the next discoveries or innovations may be much harder to
achieve, require greater R&D expense, and could actually result in lower retums. In essence, the process of discovery is not straightforward or linear. I propose that the dynamic of the ebb and flow of scientific drug discovery, inclusive of both the "easy" and "harder" discoveries, hasn't really changed over time; rather, the expectations of investors and the commitments of management teams of publicly traded Big Pharmas have ratcheted up in recent years, to the point that they have surpassed what is possible in terms of discovery output and capabilities.
Drug discovery has always been a costly, highly risky process. As Figure 7 illustrates, historic experience within the industry has shown that 10,000 compounds must be assessed at the discovery stage, the earliest stage of drug development, for every one drug that is approved. Moreover, the time line for commercializing a drug can often run from 10-14 years in length.
Figure 7. The Drug Development "Funnel" of Candidates Tested by Phase, Timing, and Costs.
Discovery Preclinical Clinical Trials FDA Review Launch
250 Compounds 1.5 YEARS 0-ii-, 'Ui-·i~
:·I·
0rr·: 3lfi PHASE I PHASE 1 20-1 00 1,000-5,000 Patients Patients 5 Compounds PHASE I 100-500 Patients 6 YEARS $467 MM 'U z 1-2 YEARS Source: PhRMA, 2006.Increasing Technological Complexity. There is little doubt that technological complexity within drug discovery and development is increasing dramatically. While on the one hand the mapping of the human genome has brought about new scientific tools, such as DNA microarrays and other technologies that theoretically should enhance our understanding of life and disease, it has not translated into an anticipated plethora of new drug filings.32 Complexity creates enormous challenges in a genomic era of drug discovery in that the vast majority of biological functions occur through the interaction of multiple genes. Furthermore, most biological interactions are non-linear. So, while we have more data than ever before, at the genomic, proteomic, and imaging levels (both systems and anatomical), we are actually now "awash" in it.33 Figure 8 illustrates the complex feedback loop that exists in drug development programs which requires mastery in the genomic era. Figure 9 illustrates the various levels of organism for which knowledge of each must be integrated in developing and targeting therapeutics in this
new age. 5 YEARS
$ii35 MMi
: : : : : : : : : : ' : ' : : :Figure 8. Selected Knowledge Driven Components of Drug Development in the Genomic Age.33
Figure 9. Levels of Organism in Which Knowledge Must be Integrated in the Genomic Age.33
Pisano points out that the theoretical promise that biotechnology would revolutionize pharmaceutical R&D productivity has not occurred. Indeed, echoing the point made above about data, he argues that biotechnology has actually increased the uncertainties in pharmaceutical R&D.34 Considering the complexity illustrated in Figures 8 and 9 above, one can appreciate how it has proliferated in the genomic age.
Rising R&D Costs. The U.S. CBO report cites the possibility of rising real R&D wages without an accompanying increase in R&D output as a possible contributor to a productivity gap. However, it appears that a greater potential contributor to pharmaceutical R&D labor costs may be the growth in R&D staffing within the industry. In the U.S., the number of R&D scientists and
- --- --·
engineers in the pharmaceutical industry grew from an estimated 34,300 in 1990 to roughly
50,000 in 1999, an increase of 45.8%.35 On an annualized basis, then, staffing levels of R&D scientists and engineers in the U.S. grew over 3.8% per year. If this growing labor pool has realized real wage growth for the past twenty years, which it has, then there is a compounding effect on R&D labor expense based on the expansion of the labor pool.
However, Big Pharma company sales and profits increased steadily over that time period, and thus have grown despite increases in R&D scientist headcount and wages and other increasing costs, such as selling, general, and administrative expenses. PhRMA member R&D spending as a percentage of sales nearly doubled from 9.3% in 1970 to 17.5% in 2006.36 R&D expense
for PhRMA members has grown at 12.5% per year from 1970 to 2006, whereas member firm sales growth has increased at 10.6% per year since 1970. So while overall R&D expenses have risen faster than sales, they have not risen so rapidly as to cause profits to decline.
DiMasi et al evaluated growth in industry R&D employment costs and reached similar conclusions.23 They found a 7.4% annual growth rate in total R&D employment from 1980 to 2000. They found a 1.75% increase in real wages for full-time employed biological scientists from 1993 to 1999 using median annual salary data from the National Science Foundation
(NSF) and adjusting for inflation (using the GDP Implicit Price Deflator). Salary data for every
two years from the U.S. Office of Technology Assessment (OTA) showed similar growth in real wages; from 1981 to 1989 for biological scientists with doctorates employed business or industry was 1.77%. Thus, DiMasi et al applied the average of the two real wage growth figures,
1.76%, across the 7.4% total R&D employment growth, the result of which is a 9.3% annual
increase in R&D labor costs for the period 1980 to 2000.23 They conclude, as I have, that most of the growth in labor costs has come from labor force expansion within R&D as opposed to real wage increases. PhRMA member firm sales varied greatly over the time period but grew at a
rate exceeding 9.3% annually in eleven years and less than 9.3% annually for nine years (See Figure 10).
Figure 10. Growth Rates in Top Line Sales of PhRMA Member Firms, 1981-2006, Plotted against 9.3% Annualized Growth Rate in R&D Labor Costs, 1981-2000.
Sources: PhRMA Industry Profile 2007, DiMasi et al.23
Rising Clinical Costs. Clinical costs certainly warrant assessment as a driver of
pharmaceutical R&D costs, since, at 28% of global pharmaceutical R&D spending (Phases I, II,
and III), they represent the single biggest cost factor, as Figure 11 illustrates. While R&D labor costs have contributed to the increasing costs of drug development, clinical trial costs have been growing more rapidly. DiMasi et al found that for the period from 1984 to 1997, clinical trial costs grew at a compound annual growth rate of 11.4%.23 Furthermore, DiMasi et al cite data that indicate a 4.8% increase in complexity of clinical trials for Phases I through III from 1992 to
2000.23 (Complexity in this case is an index based on the mean number of medical procedures to be conducted on patients per the protocol of the clinical trial.) This added complexity translates directly into higher costs.
The costs of clinical trials have escalated over time for various reasons. Many of them pertain to inclusion of larger populations in clinical studies. In the U.S., the FDA has pushed for larger safety subject databases, a broader range of dosing studies during phase 3, more diverse populations in phase 3, inclusion of comparative safety trials, and large simple safety studies (LSSS) as an element of pre-market development.37 The number of patients required by the FDA for clinical studies nearly doubled from 1995-2005.37 While there has been some question as to whether longer regulatory approval times have contributed to higher clinical costs, evidence from Booth and Zemmel and others does not appear to support this hypothesis.27
Figure 11. Breakdown of Global Pharmaceutical R&D Costs, 2006.
Sources: PhRMA; Pharmaceutical Product Development (PPDI), 2006.
Increased R&D Spending as an Investment in Higher Future Productivity. Investment is made in R&D by businesses routinely when there is an anticipated opportunity for higher productivity at a future point in time. As we have already seen, increasing technological complexity and the advent of biotechnology have not demonstrably led to reduced R&D costs in drug development. Certain technologies, such as high throughput screening and biomarkers, offer the potential to reduce costs by enabling earlier stage, more precise identification of desired targets, thus preventing expenditures of large sums of money downstream in clinical development on candidates that may ultimately fail in clinical trials. Drug companies are buying and using these technologies aggressively. However, they have yet to demonstrate benefit in simplifying or reducing costs in the drug development process.
Other, 8% Biovallability, Synthesis/ 2% . "-Regulatory Process Developmen 10%2 Phase IV, 60) Biology/ Pharm acology, 15% roxicologyl Safety, 5% nulation/ )ilIty, 9% r2namw I, It, ill,
In the case of biomarkers, which are in the early stages of development as a technology, they are viewed currently as somewhat unreliable. The initial investment for a biomarker program is substantial, and additional challenges with biomarker technology include: the lack of standardized methods, equipment evaluation, appropriate sensitivity and specificity for selected markers, and qualification of the markers themselves. It is clear that until the pharmaceutical industry and its constituents overcome these obstacles, such technologies cannot provide maximum value to the drug development process.
Unprecedented Big Pharma Firm Size. Big Pharma has never been bigger in terms of firm sales. Indeed, many of the Big Pharma companies, Aventis, Bristol-Myers Squibb, GlaxoSmithKline, Novartis, Pfizer, and Wyeth, are the products of mega-mergers. For a time period, it is certainly possible to wring profits out of combining organizations. Eliminating duplicative functions or organizations, rationalizing drug development portfolios, and consolidating manufacturing operations are a few of the ways in which merging companies seek to reduce operating costs of a newly merged entity. While the costs savings can climb into the billions of dollars per year, the downside of large mergers is that the new, larger company must find even more products and generate even more sales to deliver long-term profit growth to
investors.
The blockbuster model, commercializing products with sales in excess of $1 billion annually, has become necessary for such enormous firms to sustain sales and profit growth and satisfy investors. Thus, products with smaller market potential are often ignored by Big Pharma firms, a development which has given rise to a class of mid-sized pharmaceutical companies. Cuatrescasas, with over twenty-five years of R&D operational and company board level experience at Glaxo Wellcome (and predecessor firm Burroughs Wellcome) and
Wamer-Lambert, refers to the merger and blockbuster phenomena of Big Pharma as "merger mania" and "blockbuster mania" respectively.29
As to whether mergers of large pharmaceutical firms actually provide long-term benefits over companies who seek to grow organically, the consulting firm Wood Mackenzie has done some work in the area to evaluate this question. The firm looked at a basket of selected merger events as compared to companies that have grown without doing a "megamerger" (e.g., merger with a company approximately equivalent in size). The merger events were Novartis (a merger between Ciba-Geigy and Sandoz) in 1996, the Astra AB merger with Zeneca in 1998 to create AstraZeneca (the deal closed in 1999), the merger of Sanofi and Rhone Poulenc to create Aventis in 1998 (the deal closed in 1999), the Pfizer merger with Warner Lambert in 2000, and the merger of Glaxo Wellcome and SmithKline Beecham to create GlaxoSmithKline in 2000. The organic growth companies used in the comparison set were Johnson & Johnson, Eli Lilly, and Merck. Figure 12 depicts the experiences of both sets of companies.
Figure 12. Comparison of Share Price Performance of Selected Merged Big Pharma Pharmaceutical Firms and Organic Growth Big Pharma Firms, 1995-2002.
Source: Wood Mackenzie. M& A companies: Novartis, AstraZeneca, Aventis, Pfizer/Warner Lambert, and GlaxoSmithKline. Organic companies: Eli Lilly, Johnson & Johnson, and Merck.
The same analysis by Wood Mackenzie found that the combined worldwide market shares of companies heading into a merger were actually higher before the merger, and declined in the two years following a merger event. This finding suggests that mergers were undertaken to "solve a growth problem."39 While investors may have come out ahead in the near-term with respect to cost savings and organizational synergies, the merged company lost market share and was actually positioned for longer-term challenges of having to develop more blockbuster products to sustain sales and profit growth once the initial cost savings were realized.
Priorities around drug development programs within a Big Pharma firm can change every few years, often to the detriment of the firm. For example, given the fairly typical career progression of pharmaceutical executives, who may be in a role for three years before being promoted or moved elsewhere, there can be a continuous re-shifting of priorities, such that a program that
was attractive to one executive may be unattractive or undesirable to another, and the new executive in charge decides to cut the program. In a merger integration environment, pharmaceutical business leaders may seek to eliminate programs of either entity - the target firm or the acquiring firm - for a variety of reasons. Anecdotally, numerous executives I interviewed with Big Pharma backgrounds and who had worked at numerous different Big Pharma firms suggested that this dynamic of shifting priorities exists within Big Pharma. Changing priorities every three years or so obviously can have disruptive effects on drug development activities, especially given that a drug can easily require ten to twelve years of
R&D effort prior to commercialization.
The Investor Outlook on Pharmaceutical Discovery and Drug Development. Investors have
become painfully aware of the challenges facing Big Pharma as well. Indeed, the price-earnings trading multiples of many Big Pharma firms have declined in recent years and currently reflect relatively flat to declining expected eamings growth over the next several years, as Figure 13 illustrates. A convergence in price-earnings (PE) multiples in roughly 2011 suggests that expected growth rates of these Big Pharma firms will converge as well. PEs of the following firms are charted: Bristol-Myers Squibb (BMY), Eli Lilly (LLY), Merck (MRK), Pfizer (PFE), Schering-Plough (SGP), and Wyeth (WYE).
Figure 13. Price to Earnings Multiples of Selected Big Pharma Firms based on Projected Earnings, 2006E-2011E. :i.-S 30.0 25.0 (U 20.0 , 15.0-CU 10.0 5.0 0.0 --- BMY -a--- LLY --- MRK -- +--- PFE ---- -SGP --o-- WYE 2007E 20.7 15.9 17.8 12.1 23.4 14.4 2008E 17.8 14.2 18.8 11.5 20.0 13.0 2009E 15.1 12.8 16.2 10.5 17.5 11.8 2010E 12.6 11.7 15.0 10.1 14.5 13.2 2011E 11.9 12.5 14.8 12.1 12.1 14.0
- BMY --- LLY --- MRK - PFE ---x--- -SGP - -o-- WYE
Source: Goldman Sachs Equity Research.
Historic valuation analysis of fourteen Big Pharma firms by Accenture shows clearly that investors have shifted valuation emphasis to a company's cash flow from ongoing operations and away from its expected future value from operations.40 As Figure 14 shows, since 2000, investors have become much less risk tolerant as they try to decipher Big Pharma's prospects for growth based on future product launches. Given increasingly less visibility to firms' future earnings, investors voted with their feet. Over $500 billion of market value was lost from
2000-2005 by the fourteen Big Pharma firms in the Accenture study. In addition, we see compound
annual growth in firm current value of 9.9% for the 2000-2005 period, but a decline of 21.0% in future firm value for this basket of companies during the period. Recent events unrelated to
2006E 25.5 16.7 17.4 12.9 29.0 15.8 srn
product patent expirations, such as Merck's 2004 withdrawal of Vioxx due to increased health risks to patients, have no doubt had some effect on the outlook for Big Pharma as well.
Figure 14. Valuation of Fourteen Big Pharma Firms, 2000-2005.
2,500 2,000 1,500 1,000 500 2000 2001 2002 2003 2004 2005
M Current Firm Value O Future Firm Value I
Current Firm Value CAGR: 9.9% Future Firm Value CAGR: -21.0% Expected Firm Value CAGR: -7.0%
Firms included: * Abbott Laboratories * Amgen * Astra Zeneca * Aventis * Bristol-Myers Squibb * Eli Lilly * GlaxoSmithKline Sources: Accenture,40 S&P 500.
* Johnson & Johnson * Merck * Novartis * Pfizer * Roche * Schering-Plough * Wyeth
Clearly, then, investors have become attuned to the challenging growth environment facing Big Pharma. As we have seen, investors are clearly expecting that this environment will intensify over the next few years. The recent shifts in market valuations of Big Pharma companies demonstrates that investors have developed greater understanding of the reduced eamings
PUR