Publisher’s version / Version de l'éditeur:
Vous avez des questions? Nous pouvons vous aider. Pour communiquer directement avec un auteur, consultez la première page de la revue dans laquelle son article a été publié afin de trouver ses coordonnées. Si vous n’arrivez pas à les repérer, communiquez avec nous à [email protected].
Questions? Contact the NRC Publications Archive team at
[email protected]. If you wish to email the authors directly, please see the first page of the publication for their contact information.
https://publications-cnrc.canada.ca/fra/droits
L’accès à ce site Web et l’utilisation de son contenu sont assujettis aux conditions présentées dans le site LISEZ CES CONDITIONS ATTENTIVEMENT AVANT D’UTILISER CE SITE WEB.
Transportation Research Board 86th Annual Meeting [Proceedings], pp. 1-25, 2007-01-21
READ THESE TERMS AND CONDITIONS CAREFULLY BEFORE USING THIS WEBSITE.
https://nrc-publications.canada.ca/eng/copyright
NRC Publications Archive Record / Notice des Archives des publications du CNRC : https://nrc-publications.canada.ca/eng/view/object/?id=6c3581f7-c59d-4b34-931c-16044e9bef45 https://publications-cnrc.canada.ca/fra/voir/objet/?id=6c3581f7-c59d-4b34-931c-16044e9bef45
Archives des publications du CNRC
This publication could be one of several versions: author’s original, accepted manuscript or the publisher’s version. / La version de cette publication peut être l’une des suivantes : la version prépublication de l’auteur, la version acceptée du manuscrit ou la version de l’éditeur.
Access and use of this website and the material on it are subject to the Terms and Conditions set forth at Control over strain in the dynamic modulus test
C o n t r o l o v e r s t r a i n i n t h e d y n a m i c m o d u l u s
t e s t
N R C C - 4 8 7 0 6
A l i , O . ; E l H u s s e i n H . M o h a m e d ; A d a m , Y . ;
Z e g h a l , M . ; M a a d a n i , O .
A v e r s i o n o f t h i s d o c u m e n t i s p u b l i s h e d i n
/ U n e v e r s i o n d e c e d o c u m e n t s e t r o u v e
d a n s : T r a n s p o r t a t i o n R e s e a r c h B o a r d 8 6
t hA n n u a l M e e t i n g , W a s h i n g t o n , D . C . , J a n .
2 1 - 2 5 , 2 0 0 7 , p p . 1 - 2 5
CONTROL OVER STRAIN IN THE DYNAMIC MODULUS TEST Submission Date: November 15th 2006
Abstract: 258; word Count: 7200 (Text: 3950; Tables and Figures: 13) By
Osman Ali (Corresponding author)
Institute for Research in Construction, National Research Council Canada 1200 Montreal Road, M-20
Ottawa, Ontario K1A 0R6 Canada Phone: (613) 993-0127
Fax: (613) 954-5984
Email: [email protected] ElHussein H. Mohamed
Institute for Research in Construction, National Research Council Canada 1200 Montreal Road, M-20
Ottawa, Ontario K1A 0R6 Canada Phone: (613) 993-3817
Fax: (613) 954-5984
Email: [email protected] Yassin Adam
Graduate Student, Civil Engineering Department 1125 Colonel By Drive Carleton University Ottawa, Ontario K1S 5B6 Phone: (613) 520-7400 Canada Morched Zeghal
Institute for Research in Construction, National Research Council Canada 1200 Montreal Road, M-20
Ottawa, Ontario K1A 0R6 Canada Phone: (613) 991-6237
Fax: (613) 954-5984
Email: [email protected]
Paper Prepared for Presentation at the 2007 Annual Meeting of the Transportation Research Board
CONTROL OVER STRAIN IN THE DYNAMIC MODULUS TEST ABSTRACT
Bituminous mixtures exhibit complex visco-plasto-elastic behavior. However, implementation of purely linear viscoelastic properties at this early stage in the implementation of mechanistic-based models used in the analysis of flexible pavements is a reasonable starting point. This simplifying assumption requires that testing of asphalt concrete be performed at low strain amplitudes where the material response remains linear visco-elastic. The material testing system included in the NCHRP 1- 37A project adopted the dynamic modulus as the input to the M-E model that accounts for HMA stiffness, a property necessary for performing structural analysis to determine the state of stresses and strains in the asphalt concrete layer. The model uses the established state of stresses and strains to predict rutting and fatigue and other distress types using performance models incorporated in the software.
The current dynamic modulus testing approach is based on AASHTO standard test
specifications designated TP62-03. This paper examined the response of a variety of HMA mixes using an alternative dynamic modulus testing technique based on controlling the strain in order to make sure that the linear viscoelastic assumption is truly being respected under the proposed stress-controlled testing technique. Results obtained using the strain-controlled testing technique suggest that the levels of stress proposed under TP62-03 are relatively high and may expose the material to a critical condition exceeding the viscoelastic response and leading to accumulation of permanent deformations. The strain-controlled testing approach seems to offer a more
practical and reliable technique for determining the dynamic modulus of asphalt concrete mixes needed as input to the new M-E design model.
BACKGROUND
Effective characterization of construction materials is a key requirement for successful pavement analysis and design. Characterization should be based on material properties that accurately capture the material response to external stimuli associated with traffic loading as influenced by construction quality and environmental conditions. At this early stage in the implementation of mechanistic-based models, the dynamic modulus is gaining popularity because of its ability to quantify the stiffness of asphalt concrete as affected by mix type, temperature condition and rate of loading. In the M-E pavement design guide developed under NCHRP project 1-37A, the process of obtaining a value for the dynamic modulus differs from one input level to another (1). At input level 1, the dynamic modulus is determined directly in the laboratory at different temperatures and loading frequencies according to AASHTO provisional standard testing procedure designated TP62-03 (2). At input level 3, the complex modulus test is not required and the modulus could be estimated using a predictive equation.
Early attempts to capture the viscoelastic response of HMA involved the use of the complex modulus testing approach with traffic loading simulated in the laboratory with a sinusoidal load. The obtained material response is also sinusoidal in nature but with a phase lag (3, 4, 5, 6). Sinusoidal loading is performed at different frequencies within the linear viscoelastic range. According to the theoretical construct of the complex modulus approach, loading could be performed under either a stress or strain-controlled mode. In the first case, a specific stress value is applied and the corresponding strain is obtained, while in the other case, specific strain amplitude is applied and the
corresponding stress is recorded. Stress-Controlled Test
The dynamic modulus is the only component of the complex modulus that has been implemented in the new M-E pavement design guide. The structural response model is based on linear elasticity, and hence, the phase angle is not being considered in the analysis. Future development in mechanics may make it possible to incorporate the effect of the phase angle in the structural response model. The AASHTO provisional test standard TP62-03 is performed at temperatures of -10, 4.4, 21.1, 37.8 and 54.4 0C. Frequencies of 25, 10, 5, 1, 0.5 and 0.1 Hz are specified for loading the sample at each temperature. The recommended protocol is a stress-controlled version of the complex modulus test in which the sinusoidal (haversine) cyclic load applied to the specimen is adjusted so that the specimen is subjected to axial strains between 50 and 150 microstrain (µε). This constraint is in place to guarantee that testing is being performed within the linear viscoelastic zone. According to the current test protocol, the stress level should be selected from a certain range set for each test temperature. Recommended stresses are included in Table 4 of AASHTO test specifications TP62-03 (2), which range from 35 to 2800 kPa (5 to 400 psi). However, the dynamic loads that achieve the targeted strain magnitude depend on the HMA mix stiffness. Accordingly, experience with the dynamic modulus test procedure and the HMA mixes being tested is critical for proper selection of the stress level that complies with the strain limitation (7). Relatively high loads are needed at colder temperatures and smaller loads at warmer temperatures to keep axial strain within the linear zone. Additional measures are proposed to manage the strain level during the test. It is recommended to observe the strain at the end of any testing series at
each test temperature and to act by reducing the maximum loading stress level by half if the cumulative un-recoverable permanent strain is found to be greater than 1500 micro units of strain. As a result of this precaution, it is expected that many specimens will be discarded and new ones used for the rest of testing periods under the reduced load
condition. This paper discusses a practical alternative testing approach for controlling the strain in order to guard against violating the assumption that the material is within the linear viscoelastic state when the dynamic modulus is determined.
Strain-Controlled Test
In a pavement structure, traffic induces stresses within the HMA layer and as a result, strains develop suggesting that the laboratory test should follow a stress-controlled mode to mimic this field-loading pattern. However, previous work performed under the stress-controlled mode has experienced difficulties in limiting displacements within the desired range, i.e., below what may cause permanent strain. In the literature, a strain magnitude of 1500 µε has been reported at test temperatures between 40 and 50oC (8). Practicality of the strain-controlled testing approach motivated European researchers to experiment with this technique. Heck et al. (3) performed successfully the classical French alternate flexural test on trapezoidal specimens under sinusoidal strain for the crossed frequency-temperature conditions: [1, 3, 10, 30, 40 Hz] × [-10, 0, 10, 20, 30, 40oC]. Bonnaure et al. (9) determined the complex modulus of asphalt mixtures from bending tests using a trapezoidal specimen fixed at one end and subjected to a sinusoidal load at the free end. Witczak and Root indicated that a tension-compression test might be more representative of field loading conditions(10). After performing the complex modulus tests under five different modes of loading, Khanal and Mamlouk confirmed the findings of Witczak and Root (11). Accordingly, cyclic loading in this study was performed using
tension-compression to produce the data necessary for calculating the dynamic modulus. EXPERIMENTAL INVESTIGATION
The laboratory investigation designed to investigate the effectiveness of the strain-controlled alternative proposed in this study included some features of the
stress-controlled approach for determining the modulus needed as input to the NCHRP 1-37A model. Loading of the specimen was conducted at the frequencies of 20, 10, 5, 1, 0.3 and 0.1 Hz at each test temperature (–10, 0, 10, 20, 30, and 40oC). Samples that represent three types of conventional hot mix asphalt (HMA 1, 2 and 3) designed using the Marshall approach and two according to Superpave volumetric mix design (SP1, SP2) using AASHTO provisional specifications (MP2-02), were prepared as shown in Table 1. The function of these five mixes conforms to a wide range of applications; mainly binder and surface courses. A gyratory compactor was used to prepare the specimens with a tolerance for air voids set at 0.5 %. Mechanical tests were performed on samples after an age of six days and a minimum of two replicates were used in each test.
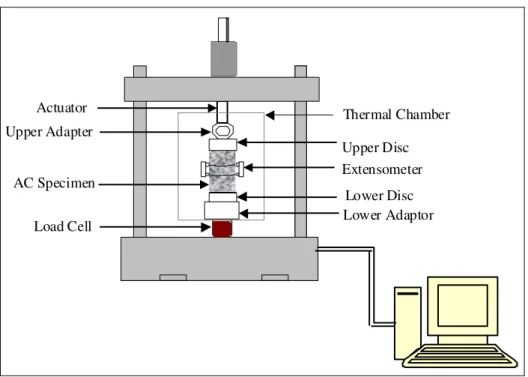
Tension-compression complex modulus tests were performed on the two mix types under the strain-controlled approach using the National Research Council Canada (NRCC) standard specification WI # 440500-9328-4.9I-UIR85 (12). A servo-hydraulic testing system (MTS810, Teststar II frame) furnished with MultiPurpose Testware was used to control the cyclic load applied to HMA samples as shown in Figure 1. An environmental chamber capable of controlling the temperature over the desired range
within +/-0.5 oC was used for conditioning samples. Axial deformations were measured using extensometers with high accuracy (MTS product Model 632.11F-90). The
extensometers were mounted on the side of the specimen at 180o apart and attached to the specimen by springs and their knife-edges were glued using a drop of five-minute epoxy. Platens used to transmit the load to the specimen were glued to the two ends of the specimens. In loading the specimen, a short rest period of two minutes was assigned after 20 and 10 Hz for testing at temperatures of –10, 0, and 10 oC. A rest period of one minute was assigned after 5, 1, 0.3, and 0.1 Hz for tests performed at –10, 0, and 10 oC. Also a rest period of one minute was assigned after all frequencies for testing at temperatures of 20, 30, and 40 oC. The adopted sampling rate was 100 points per cycle, which was found to be adequate for accurately plotting sinusoidal signals capturing effectively peak stress and strain values (13). The commercial statistical package entitled TableCurve was used to reduce data and fit it to a waveform equation (sinusoidal) to assist in determining amplitudes of the stress and strain signals and the phase angle. The software
HUSAROAD, a module of the VEROAD Program (14), was used to construct master curves that depict variations in the stiffness with temperature for mixes tested in this study.
RESULTS AND ANALYSIS
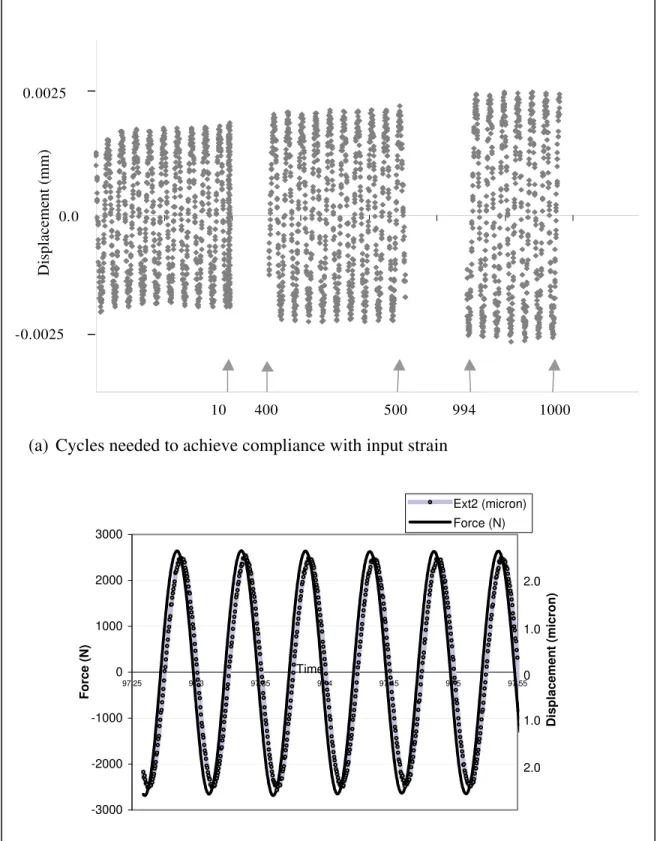
Results from preliminary strain-controlled tests performed in this study were instrumental in the test procedure refinement task. One such exercise involved determination of the number of loading cycles in the strain-controlled test. The objective was to achieve a strain output signal equivalent to the input value. The number of cycles recommended in the AASHTO test protocol was used initially in the strain-controlled test only to discover that the output signal of the strain at the end of the recommended number of load cycles remained lower than the input value. The number of cycles differed according to loading frequency and test temperature for each of the tested HMA type. Higher numbers were needed for the output strain value to reach the input value as shown in Figure 2.a. Initially the testing system attempts to comply with the displacement control requirement issued by a signal from the extensometers attached to the sample. These initial attempts are usually not adequate for compliance of the system which seems to be influenced by the nature of the material being tested, loading frequency, temperature and stiffness of the loading frame The system continues attempts to produce the actuator movement that will push the specimen up to the targeted displacement value and the load cell captures the corresponding load signal. The extensometer then records the actual displacement of the sample corresponding to the recorded load (see Figure 2.b). This process continues until the output strain is equivalent to the input. When compliance is achieved, after the
adequate conditioning cycles, an Excel macro records data corresponding to the last three cycles. This number is also different from what has been recommended in the TP62-03 protocol which calls for recording data from the last five cycles. It is worth noting that regardless of the number cycles used to collect test data, it is important to make sure that the system achieves compliance with the specified strain magnitude after which other corresponding outputs (stress and phase angle) could be accurately determined. Using data from the last five cycles that follows conditioning cycles specified in the current TP62-03 protocol will not necessarily yield accurate data output for effective
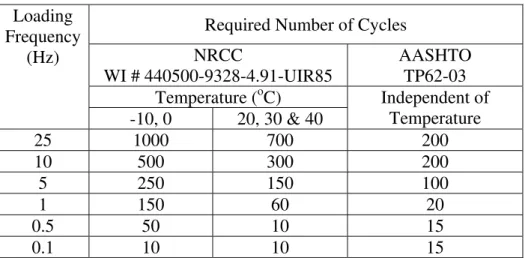
At a temperature of -10oC and a loading frequency of 20 Hz, 1000 cycleswere needed to reach the targeted strain value used to control the loading. The number of cycles required to achieve compliance of the system at cold temperatures was greater than the number of cycles required at warm temperatures. Moreover, more cycles were required to reach the stabilization state at high loading frequencies than at low frequencies. Table 2 shows the number of cycles used in the stress-controlled test specified in AASHTO TP62-03 (2) together with those obtained in the strain-controlled test specified in the NRCC test protocol produced by this study.
Strain Magnitude
The displacement magnitude that could be used effectively in the strain-controlled test was investigated using a linearity check. The objective of the linearity check was to select a maximum displacement to apply without violating the linear viscoelastic state.
Considering the possibility of energy loss at different joints and connections within the test setup, small displacements may lead to smaller signals that are hard to process
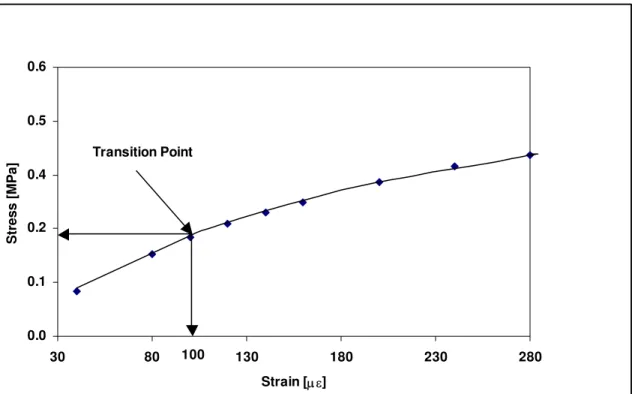
making it difficult to properly and accurately measure the targeted response. The linearity checks were initially performed on the SP 2 mix (Superpave mix, binder PG 52-34) using nine different strains in conducting the complex modulus test. Results from the nine tests, collected at a temperature of 25oC and a loading frequency of 20 Hz, are shown in Figure 3. Stresses corresponding to each of the nine strain values were plotted in Figure 3 to facilitate identification of the transition zone from linear to non-linear response. It is clear from Figure 3 that beyond a stress level of 200 kPa the material acquired permanent deformation and consequently, a strain magnitude of about 100 µε has been considered as the proper value to use in conducting the strain-controlled tests.
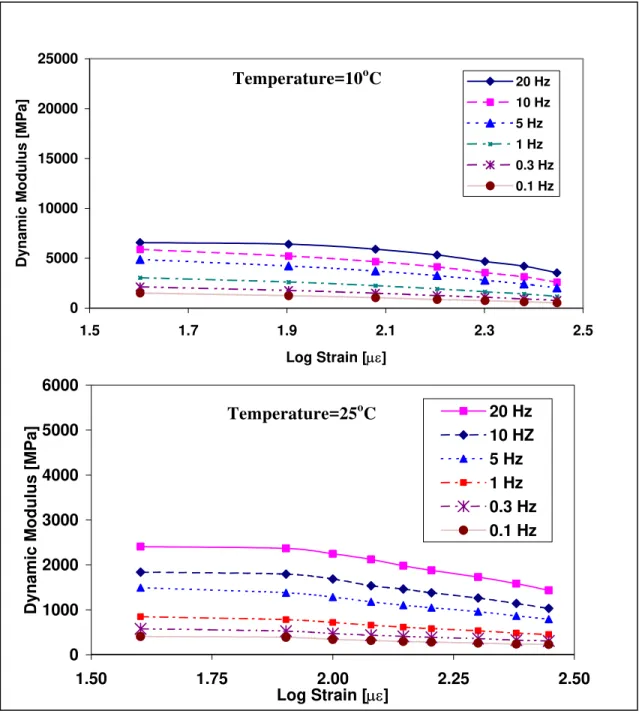
The choice of a strain value for conducting the test was reevaluated by performing the linearity check on the HMA 2 mix prepared with a PG 64-34 binder. Results of seven tests performed at different strain values, obtained at +10 and +25oC covering all six frequencies (20, 10, 5, 1, 0.3 and 0.1 Hz), are shown in Figure 4. Results obtained at +10oC, shown in Figure 4, suggest that the dynamic modulus at each frequency remained unchanged up to a strain level of 100 µε supporting the choice made using the SP 2 mix. Figure 4 also shows results of the linearity checks performed at a relatively warmer temperature (+25oC). Linearity was adequately maintained until the strain exceeded 100 µε. The strain limit determined in this study is in agreement with earlier findings by Charif (15) but still ten fold higher than that determined by Doubbaneh (16). Based on the above analysis, strain amplitude of 100 µε was selected for conducting all complex modulus tests in this study designed for determining the dynamic modulus.
Stress vs. Strain-Controlled
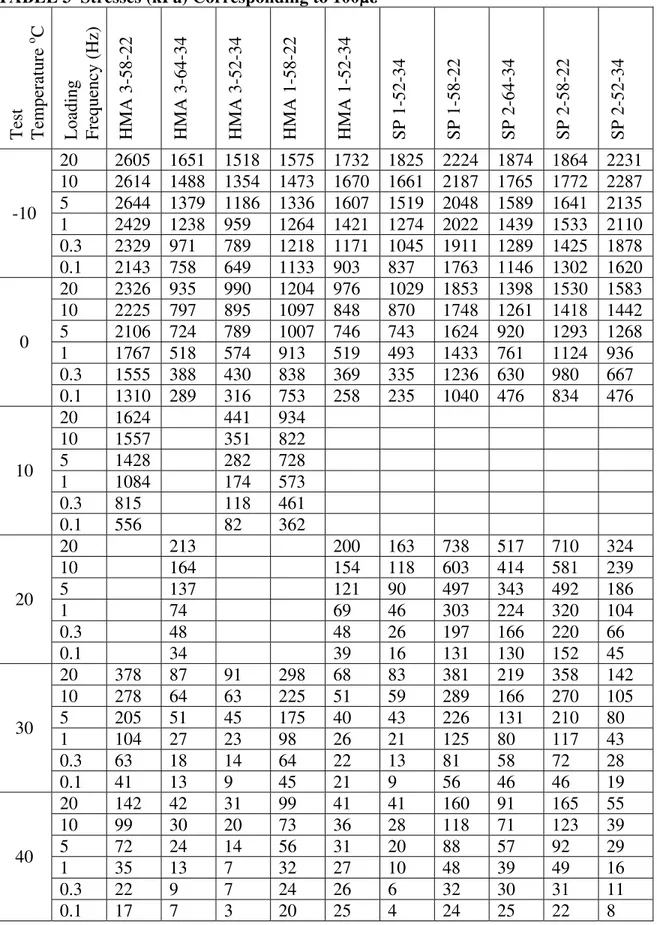
Results of the complex modulus tests performed using the strain-controlled mode were used to evaluate corresponding stresses associated with the application of 100µε. These stresses were then compared with the levels recommended in the AASHTO TP62-03. The stresses obtained from all the strain-controlled experiments are shown in Table 3 covering ten mixes. In general, the lower stress value proposed in the AASHTO TP62-03 seems reasonable especially at low-test temperatures. Analysis also indicates that at relatively warm temperatures and for some mixes prepared with soft binders, the lower stress value is high. Even with the provision included in the AASHTO TP62-03 that
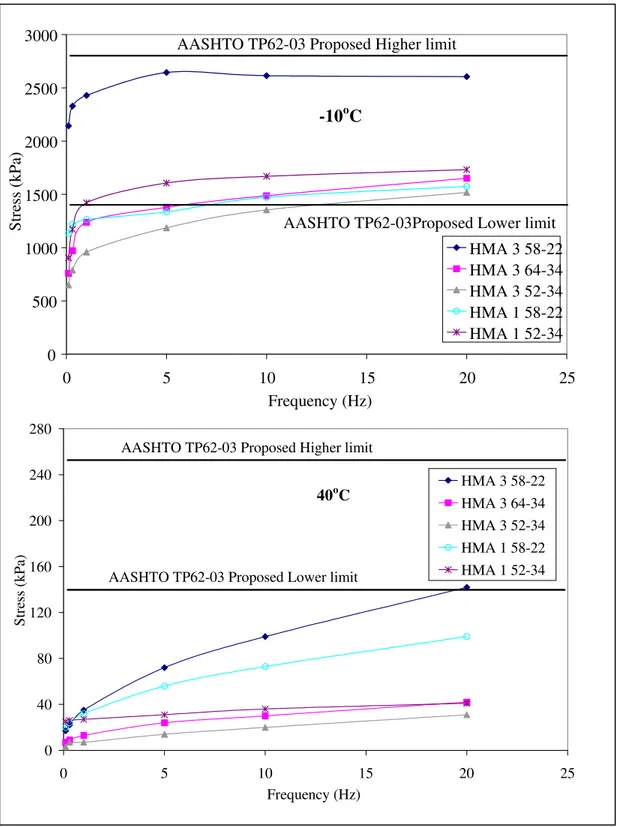
recommends the use of half the proposed stress in the event that permanent deformation starts to accumulate, the linear viscoelasticity assumption would have been violated as a result of applying such high stresses. Data collected at -10 and 40oC was plotted in Figure 5. At –10oC, the AASHTO TP62-03 proposed stresses are high for four of the mixes evaluated in this study. The stress determined using the train-controlled approach for the fine mix prepared with a neat binder (HMA 3, PG 58-22) is in agreement with the proposed AASHTO limits. However, for the two mixes prepared using modified binders as well as the coarse mixes (HMA 1), the 1400 kPa stress level proposed in AASHTO TP62-03 will be high for tests performed at low loading frequencies (lower than 5 Hz). The proposed lower stress limit was 2.5 times higher than what is needed to produce 100µε; the safe limit set for maintaining the response within the viscoelastic zone. It is worth noticing that the stress level required to achieve 100µε in the case of the fine mix (HMA 3) prepared with modified binders (PG 64-34 or 52-34) was half that required in the mix prepared with a neat binder (HMA 3, PG 58-22).
Figure 5 also compares stresses produced in the controlled-strain test with AASHTO proposed limits at 40oC. It is clear that applying the proposed limits will lead to violation of the viscoelastic assumption in all tested mixes. The proposed lower stress limit was three to six times higher than the stress magnitude required for producing 100µε, especially at low loading frequencies. Further analysis was performed using the Superpave mix (SP 1) and the results were consistent with observation made in the case of Marshall mixes. These results suggest that caution should be exercised when testing mixes with modified binders since the stress required for maintaining the 100µε is much lower than that needed for testing mixes prepared with neat binders as shown in Figure 6. Considering the fact that the proposed stress was 6 times higher than that required to produce 100µε (350 kPa compared with 50 kPa determined in the strain-controlled test), using half the lower limit will not serve as an adequate measure.
Dynamic Modulus
Concerns discussed in this paper associated with uncertainties about the appropriate stress level to use in the stress-controlled testing technique, motivated authors to recommend the use of the strain-controlled approach. Complex modulus data collected from tests performed in this study using the strain-controlled approach was processed to determine the dynamic modulus │E*│and phase angle φ according to Equations 1 and 4 respectively. Raw data recorded during the complex modulus test included records of forces detected by the load cell following a real time sequence (seconds). These are the forces associated with applied displacements controlled by the extensometer. The tests performed at each temperature and loading frequency involves more than 5000 data points needed to draw the full stress-strain profile. The data was processed in the first stage using an Excel-based macro, which involved calculating the stress (Equation 2) and the strain (Equation 3) from the last three cycles of each frequency.
* 0 0 E σ ε = ...1 0 P = A σ ...2
where A is the cross-sectional area (mm2) of a specimen with 100-mm diameter, and
P is the recorded axial force, (Newton). 0=
L
ε ∆ ...3 where ∆ is the measured displacement in mm, and L is the gauge length of the
extensometer used to control the test
φ = (φ1-φ2) *180/π ...4
where φ1 and φ2 are individual phase angles of the stress and strain wave functions respectively.
The statistical package “TableCurve” was used to obtain amplitudes of stresses and strains in addition to the phase angle of each stress and strain signal for the entire sweep of test temperatures and loading frequencies. The “TableCurve” quantifies the amplitudes of stresses and strains in addition to the phase angle of each stress and strain signal mathematically in terms of the coefficients shown in Equations 5 and 6:
1 1 1 1 2 sin( t ) a b c d π σ = + + ...5 2 2 2 2 2 sin( t ) a b c d π ε = + + ...6 where: σ and ε are the stress and strain respectively at time t,
b1 and b2 represent the amplitude of stress and strain σο and εο respectively,
a1 and a2 are regression constants,
c1 and c2 represent individual phase angles of stress and strain wave functions φ1 and φ2 respectively.
The statistical output of the TableCurve for a typical strain computation is shown in Table 4reflecting accuracy associated with fitting the data to a sinusoidal waveform function that reflects the material response to applied loading.
In the last stage, processing of data involves using the output of the previous stage to calculate the dynamic modulus │E*│ using Equation 1 and the phase lag φ using Equation 4. The phase lag between applied stress and corresponding strain signals was calculated as the difference between φ1 and φ2 in radians. The phase lag in radians
was then converted into phase angle in degrees according to Equation 2.
Typical dynamic modulus and phase angle data calculated using results of the strain-controlled testing technique and reduced according to the above procedure for the HMA 1 mix prepared with a PG 58-22, are shown in Table 5. These results reflect a consistent picture and the sensitivity of the determined dynamic modulus to variations in temperature and load frequency. Further analysis was performed using the obtained dynamic modulus to reflect its sensitivity to binder types used in the HMA mix. The dynamic modulus profile shown in Figure 7 discriminates effectively between the two HMA 3 mixes prepared with uniquely different binder types (PG 64-34 and PG 58-22). The response associated with the engineered binder (PG 64-34) compared with the neat one (PG58-22) suggests that the objectives of the binder designer aimed at reducing HMA brittleness at low temperatures to minimize cracking, are fulfilled. The measured
dynamic modulus of the HMA 3 mix prepared with a PG 64-34 binder was half that prepared with a PG 58-22 binder. However, both binders produced relatively close
dynamic modulus values at relatively high temperatures reinforcing the role played by the aggregate skeleton at such a condition.
Since the new M-E pavement model rely on a master curve produced by
manipulating the dynamic modulus test data, the master curves for 13 mixes tested in this study were constructed using the principle of time-temperature superposition. The master curves for these different mixes are shown in Figure 8.
CONCLUSIONS AND RECOMMENDATIONS
• This study investigated stress levels recommended in AASHTO TP62-03, the stress-controlled testing procedure used for the determination of the dynamic modulus of HMA. The recommended ranges were found to be high for tests performed at relatively warm temperatures and low loading frequencies. Using these levels may result in violating the adopted linear viscoelastic assumption.
• Controlling the strain proved to be a more practical approach and eliminates
uncertainties associated with the selection of an appropriate stress level. Accordingly, a strain-controlled testing technique was developed using a compression-tension loading mode. The strain-control test offers a reliable process for determining the dynamic modulus.
• Thirteen mixes were tested in this study using the strain-controlled approach and results were successfully used to determine the dynamic modulus. The process is consistent and the determined modulus proven sensitive to factors such mix type, temperature and loading frequency. The determined modulus discriminates
effectively between responses of different mix types prepared with different binders. REFERENCES
1. NCHRP project 1-37A. Development of the 2002 Guide for the Design of New and Rehabilitated Pavement Structures: Phase II. TRB, National Research Council, Washington, D.C. www.trb.org/mepdg/. Accessed January 2005. 2. AASHTO. Standard Method of Test For Determining Dynamic Modulus of
Hot-Mix Asphalt Concrete Hot-Mixtures. TP62-03.
3. Heck, J. V., Piau, J. m., Gramsammer, J. C., Kerzreho, J. P. and Odeon, H. Thermo- Visco- Elastic Modelling of Pavements Behaviour and comparison with Experimental Data from LCPC Test Track. 5th International Conference on the Bearing capacity of Roads and Airfields, 1998.
4. Kim, Y. R., Seo, Y., King, M., Momen, M. Dynamic Modulus Testing of Asphalt Concrete in Indirect Tension Mode. Transportation Research Record No. 1891, TRB, National Research Council, Washington, D.C., 2004, pp.163-173.
5. Ferry, J. D. Visco-elastic properties of polymers. 3rd Edition. Wiley, N.Y., 1980. 6. Sayegh, G. Viscoelastic properties of bituminous mixtures. Proceedings of the
2nd International conference on structural design of asphalt pavement, pp. 743-755. 7. Dougan, C. E., Stephens, J. E., Mahoney, J., Hansen, G. E*- Dynamic Modulus
Test Protocol – Problems and Solutions. Connecticut Department of Transportation. Report Number CT-SPR-0003084-F-03-3, 2003.
8. Timothy R. C., Xingjun L., Mihai O. M., Eugene L. S. Dynamic and Resilient Modulus of Mn/DOT Asphalt Mixtures. Department of Civil Engineering – University of Minnesota. Report submitted to Minnesota Department of Transportation. 2003.
9. Bonnaure, F., Gest, G., Gravios, A., and Uge, P. A New Method of Predicting the Stiffness of Asphalt Paving Mixtures. Proceedings of Association of Asphalt Paving technologists, Vol. 46, 1977, pp. 64-100.
10. Witczak M.W., and Root. R. E. Summary of Complex Modulus Laboratory Test Procedures and Results. American Society for Testing Materials, ASTM Special Technical Publication, Vol. 561, 1974, pp. 67- 94.
11. Khanal, P. P. and Mamlouk M. S. Tensile Versus Compressive Moduli of Asphalt Concrete. Transportation Research Record 1492, 1995, pp.144-150.
12. National Research Council Canada. Complex Modulus Test Protocol And Procedure for Determining Huet–Sayegh Model Parameters. WI # 440500-9328-4.91-UIR85, 2004.
13. Yassin E. A. Asphalt Concrete Characterization Using the Complex Modulus Technique. Thesis submitted in partial fulfillment of the requirements for the degree of Masters of Applied Science in Civil Engineering, Carleton University, 2005.
14. Hopman, P.C. VEROAD. A. Viscoelastic Multilayer Program. 75th TRB meeting, Transportation Research Record 1539, Washington D.C. USA, 1996, pp. 72-80.
15. Charif, K. Contribution à l’étude du comportement mécanique du béton
bitumineux en petites et grandes déformations. Thèse de Doctorat: Ecole Centrale Paris, Janvier 1991. 277 p.
16. Doubbaneh, E. Comportement mécanique des enrobés bitumineux des petites aux grandes déformations. Thèse de Doctorat: Institut National des Sciences
TABLES & FIGURES LIST OF TABLES
TABLE 1 Mix Design Information TABLE 2 Number of Loading Cycles
TABLE 3 Stresses (kPa) Corresponding to 100µε
TABLE 4 Typical Strain Amplitude Produced by “TableCurve”
TABLE 5 Dynamic Modulus (MPa) and Phase Angle (o) Determined at Different Loading Frequencies and Test Temperatures for HMA1 Mix (PG 58-22)
LIST OF FIGURES
FIGURE 1 Strain-controlled test setup.
FIGURE 2 Output of the strain-controlled test.
FIGURE 3 Typical stress-strain relationship at a temperature of 25oC and loading frequency of 20 Hz for SP 2 (PG 52-34).
FIGURE 4 Results of a typical linearity check for tests performed at 10oC and 25oC on HMA 2 (PG 64-34).
FIGURE 5 Stresses corresponding to 100µε for tests performed at –10 oC and 40 oC. FIGURE 6 Stresses corresponding to 100µε for tests performed at 20 oC.
FIGURE 7 Dynamic modulus determined for HMA 3 reflecting the impact of binder type. FIGURE 8 Master curves established for all mixes investigated in this study.
TABLE 1 Mix Design Information
Test Results
Mix Type Mix Design Parameter Local
Specifications
PG 58-22 PG 52-34 PG 64-34
Asphalt Content % 4.5 - 7.0 4.5 4.5
Air Voids % 3 - 5 4.2 4.0
Marshall Stability (N) 8000 (min) 11550 9220
Marshall Flow (0.25 mm)
@ 3.5% Air Voids 8.0 (min) 10.2 8.4
HMA 1 Stabilized Base Course VMA % 12.5 (min) 13.85 13.6 Asphalt Content % 5.0 - 7.0 5.0 5.0 5.1 % Air Voids 3 - 5 4.6 4.4 4.5
Marshall Stability (N) 8900 (min) 19200 11800 19000
Marshall Flow (0.25 mm)
@ 3.5% Air Voids 8.0 (min) 11.5 11 11.75
HMA 2 Binder Course VMA % 13.0 (min) 13.38 13.04 13.2 Asphalt Content % 5.0 - 7.0 5.0 5.0 5.0 % Air Voids 3 - 5 4.5 4.5 4.4
Marshall Stability (N) 8900 (min) 12800 11450 11600
Marshall Flow (0.25 mm)
@ 3.5% Air Voids 8.0 (min) 8.3 8.9 9.6
HMA 3 Surface Course VMA % 13.5 12.8 13.57 13.3 SuperPave Specifications % of binder content @ 4.0% air voids 3 - 5 4.4 4.4 VMA % 14 (min) 15.7 15.5 VFA % 65 - 75 74.6 74.5 %Gmm @ Nini < 90.0 89.5 89.5 SP 1 Binder Course %Gmm @ Ndes < 98.0 95.5 95.0 P0.075 / Pbe Ratio 0.6 - 1.4 1.11 1.11 % of binder content @ 4.0% air voids 3 - 5 4.4 4.5 4.5 VMA % 14 (min) 14.7 12.8 14.5 VFA % 65 - 75 73.8 70.0 73.7 %Gmm @ Nini < 90.0 89.0 89.0 90.5 %Gmm @ Ndes < 98.0 96.7 96.5 97.0 SP 2 Surface Course P0.075 / Pbe Ratio 0.6 - 1.4 1.11 1.11 1.11
TABLE 2 Number of Loading Cycles
Required Number of Cycles NRCC WI # 440500-9328-4.91-UIR85 AASHTO TP62-03 Temperature (oC) Loading Frequency (Hz) -10, 0 20, 30 & 40 Independent of Temperature 25 1000 700 200 10 500 300 200 5 250 150 100 1 150 60 20 0.5 50 10 15 0.1 10 10 15
TABLE 3 Stresses (kPa) Corresponding to 100µε Test Tem p er at ur e o C
Loading Frequency (Hz) HMA 3-58-22 HMA 3-64-34 HMA 3-52-34 HMA 1-58-22 HMA 1-52-34 SP 1-52-34 SP 1-58-22 SP 2-64-34 SP 2-58-22 SP 2-52-34
20 2605 1651 1518 1575 1732 1825 2224 1874 1864 2231 10 2614 1488 1354 1473 1670 1661 2187 1765 1772 2287 5 2644 1379 1186 1336 1607 1519 2048 1589 1641 2135 1 2429 1238 959 1264 1421 1274 2022 1439 1533 2110 0.3 2329 971 789 1218 1171 1045 1911 1289 1425 1878 -10 0.1 2143 758 649 1133 903 837 1763 1146 1302 1620 20 2326 935 990 1204 976 1029 1853 1398 1530 1583 10 2225 797 895 1097 848 870 1748 1261 1418 1442 5 2106 724 789 1007 746 743 1624 920 1293 1268 1 1767 518 574 913 519 493 1433 761 1124 936 0.3 1555 388 430 838 369 335 1236 630 980 667 0 0.1 1310 289 316 753 258 235 1040 476 834 476 20 1624 441 934 10 1557 351 822 5 1428 282 728 1 1084 174 573 0.3 815 118 461 10 0.1 556 82 362 20 213 200 163 738 517 710 324 10 164 154 118 603 414 581 239 5 137 121 90 497 343 492 186 1 74 69 46 303 224 320 104 0.3 48 48 26 197 166 220 66 20 0.1 34 39 16 131 130 152 45 20 378 87 91 298 68 83 381 219 358 142 10 278 64 63 225 51 59 289 166 270 105 5 205 51 45 175 40 43 226 131 210 80 1 104 27 23 98 26 21 125 80 117 43 0.3 63 18 14 64 22 13 81 58 72 28 30 0.1 41 13 9 45 21 9 56 46 46 19 20 142 42 31 99 41 41 160 91 165 55 10 99 30 20 73 36 28 118 71 123 39 5 72 24 14 56 31 20 88 57 92 29 1 35 13 7 32 27 10 48 39 49 16 0.3 22 9 7 24 26 6 32 30 31 11 40 0.1 17 7 3 20 25 4 24 25 22 8
TABLE 4 Typical Strain Amplitude Produced by “TableCurve”
Parameters Values
Equation [Sine] y = a+bsin (2πx/d+c) a2 1.91E-06
Eqn # 8014 b2 9.87E-05 (strain amplitude, mm/mm)
R2 0.999 c2 3.66 (phase lag, radians)
DF Adj R2 0.999 d2 0.05 Fit Std Err 2.17E-06 F-stat 105573 Date Dec 8, 2004 Time 12:53:47 PM
TABLE 5 Dynamic Modulus (MPa) and Phase Angle (o) Determined at Different Loading Frequencies and Test Temperatures for HMA1 Mix (PG 58-22)
Temperature [oC] Frequency
[Hz] -10 0 20 30 40
|E*| φ |E*| φ |E*| φ |E*| φ |E*| φ
20 13300 3.3 10000 7.6 7850 12.3 2480 34.0 825 43.0 10 12900 3.5 9540 7.7 6970 13.5 1890 36.8 608 42.6 5 11900 4.3 8830 8.7 6220 15.6 1460 38.3 467 40.7 1 11000 5.8 7940 10.1 4820 20.1 817 40.4 269 36.4 0.3 10300 6.6 7040 13.1 3840 23.8 533 40.8 200 31.4 0.1 9600 9.5 6280 16.2 3070 27.5 375 37.6 167 26.5
Thermal Chamber Lower Disc Load Cell Actuator AC Specimen Upper Adapter Lower Adaptor Extensometer Upper Disc
(a) Cycles needed to achieve compliance with input strain
(b) Typical real-time record of force and displacement signals
FIGURE 2 Output of the strain-controlled test.
Displacement (mm) 0.0025 -0.0025 10 400 500 994 1000 0.0 -3000 -2000 -1000 0 1000 2000 3000 97.25 97.3 97.35 97.4 97.45 97.5 97.55 Ext2 (micron) Force (N) 2.0 1.0 0 1.0 2.0 Time Displacement (micron ) Force (N)
FIGURE 3 Typical stress-strain relationship at a temperature of 25oC and loading frequency of 20 Hz for SP 2 (PG 52-34). Stress-Strain Relationship 0.0 0.1 0.2 0.4 0.5 0.6 30 80 130 180 230 280 Strain [µε] Stress [MPa] Transition Point 100
FIGURE 4 Results of a typical linearity check for tests performed at 10oC and 25oC on HMA 2 (PG 64-34). 0 1000 2000 3000 4000 5000 6000 1.50 1.75 2.00 2.25 2.50 Log Strain [µε]
Dynamic Modulus [MPa]
20 Hz 10 HZ 5 Hz 1 Hz 0.3 Hz 0.1 Hz 0 5000 10000 15000 20000 25000 1.5 1.7 1.9 2.1 2.3 2.5 Log Strain [µε]
Dynamic Modulus [MPa]
20 Hz 10 Hz 5 Hz 1 Hz 0.3 Hz 0.1 Hz Temperature=10oC Temperature=25oC
FIGURE 5 Stresses corresponding to 100µε for tests performed at –10 oC and 40 oC. 0 500 1000 1500 2000 2500 3000 0 5 10 15 20 25 Frequency (Hz) Stress (kPa) HMA 3 58-22 HMA 3 64-34 HMA 3 52-34 HMA 1 58-22 HMA 1 52-34 AASHTO TP62-03 Proposed Higher limit
AASHTO TP62-03Proposed Lower limit -10oC 0 40 80 120 160 200 240 280 0 5 10 15 20 25 Frequency (Hz) St re ss (kPa) HMA 3 58-22 HMA 3 64-34 HMA 3 52-34 HMA 1 58-22 HMA 1 52-34 AASHTO TP62-03 Proposed Higher limit
AASHTO TP62-03 Proposed Lower limit
FIGURE 6 Stresses corresponding to 100µε for tests performed at 20 oC. 0 100 200 300 400 500 600 700 800 0 5 10 15 20 25 Frequency (Hz) Stress (kPa) SP 1 52-34 SP 1 58-22 AASHTO TP62-03 Proposed Higher limit
AASHTO TP62-03 Proposed Lower limit
FIGURE 7 Dynamic modulus determined for HMA 3 reflecting the impact of binder type. 0 5000 10000 15000 20000 25000 30000 -20 -10 0 10 20 30 40 50 Temperature 0C
Dynamic Modulus (MPa)
HMA 3-PG 58-22
FIGURE 8 Master curves established for all mixes investigated in this study. 0 5000 10000 15000 20000 25000 30000 35000 40000 0.01 1 100 10000 1000000 100000000 1E+10 HMA1-52-34 HMA1-58-22 HMA2-52-34 HMA2-58-22 HMA2-64-34 HMA3-52-34 HMA3-58-22 HMA3-64-34 SP1-52-34 SP1-58-22 SP2-52-34 SP2-58-22 SP2-64-34 Reduced Frequency (Hz) Dy nam ic Mod u lu s ( M P a )