Publisher’s version / Version de l'éditeur:
Journal of Infrastructure Systems, 13, March 1, pp. 1-11, 2007-03-01
READ THESE TERMS AND CONDITIONS CAREFULLY BEFORE USING THIS WEBSITE.
https://nrc-publications.canada.ca/eng/copyright
Vous avez des questions? Nous pouvons vous aider. Pour communiquer directement avec un auteur, consultez la première page de la revue dans laquelle son article a été publié afin de trouver ses coordonnées. Si vous n’arrivez pas à les repérer, communiquez avec nous à [email protected].
Questions? Contact the NRC Publications Archive team at
[email protected]. If you wish to email the authors directly, please see the first page of the publication for their contact information.
NRC Publications Archive
Archives des publications du CNRC
This publication could be one of several versions: author’s original, accepted manuscript or the publisher’s version. / La version de cette publication peut être l’une des suivantes : la version prépublication de l’auteur, la version acceptée du manuscrit ou la version de l’éditeur.
For the publisher’s version, please access the DOI link below./ Pour consulter la version de l’éditeur, utilisez le lien DOI ci-dessous.
https://doi.org/10.1061/(ASCE)1076-0342(2007)13:1(1)
Access and use of this website and the material on it are subject to the Terms and Conditions set forth at
Quantifying effectiveness of cathodic protection in water mains: case studies
Rajani, B. B.; Kleiner, Y.
https://publications-cnrc.canada.ca/fra/droits
L’accès à ce site Web et l’utilisation de son contenu sont assujettis aux conditions présentées dans le site LISEZ CES CONDITIONS ATTENTIVEMENT AVANT D’UTILISER CE SITE WEB.
NRC Publications Record / Notice d'Archives des publications de CNRC: https://nrc-publications.canada.ca/eng/view/object/?id=b347fc74-4ad4-4a4f-9cb7-b0d3168034eb https://publications-cnrc.canada.ca/fra/voir/objet/?id=b347fc74-4ad4-4a4f-9cb7-b0d3168034eb
http://irc.nrc-cnrc.gc.ca
Q u a n t i f y i n g e f f e c t i v e n e s s o f c a t h o d i c
p r o t e c t i o n i n w a t e r m a i n s : c a s e s t u d i e s
N R C C - 4 7 7 3 9
R a j a n i , B . ; K l e i n e r , Y .
A version of this document is published in / Une version de ce document se trouve dans: Journal of Infrastructure Systems, v. 13, no. 1, March 2007, pp. 1-11
Doi: 10.1061/(ASCE)1076-0342(2007)13:1(1)
QUANTIFYING EFFECTIVENESS OF CATHODIC
PROTECTION IN WATER MAINS: CASE STUDIES
Balvant Rajani and Yehuda Kleiner
Institute for Research in Construction, National Research Council Canada, Ottawa, Ontario Canada K1A 0R6
Tel: (613)-993-3810, fax: (613)-954-5984 E-mail: [email protected]
Accepted for publication to the ASCE Infrastructure Systems
Submitted: May 2, 2005
QUANTIFYING EFFECTIVENESS OF CATHODIC PROTECTION
IN WATER MAINS: CASE STUDIES
Balvant Rajani and Yehuda Kleiner
Abstract: Cathodic protection is a viable measure to extend the residual life of water
mains and thus defer capital investments in their rehabilitation and renewal. The
effectiveness of cathodic protection varies with the unique set of conditions under which it is applied and it is therefore difficult to quantify. Consequently, reported case histories have been largely anecdotal and most often based on the observed reduction of water main breaks following the application of cathodic protection.
Models to assess the impact of cathodic protection programs were proposed in a previous companion paper “Quantifying the Effectiveness of Cathodic Protection in Water Mains: Theory”. This paper describes the application of these models to five groups of water mains from two water utilities that have had on-going programs of hot spot and retrofit cathodic protection.
The case histories show that cathodic protection programs (hot spot and retrofit strategies) have had a significant effect on reducing breakage rates, however, in some cases it appears that the much cheaper hot spot strategy is sufficiently effective and there is no need to retrofit as well. The proposed analytical methods should assist water utilities to optimize the implementation and scheduling of future cathodic protection programs.
Key words: water main deterioration, hot spot, retrofit, cathodic protection, water main
INTRODUCTION
Metallic water mains constitute more than two thirds of all existing water pipes in most North American cities. From the 1880s to the early 1930s grey cast iron (CI) pipes were manufactured by pouring molten cast iron in upright sand moulds placed in a pit. These pipes were known as pit cast iron. In 1920s/1930s a new manufacturing process was introduced, in which pipes were horizontally cast in moulds made of sand or metal. These moulds spun as they were cooled externally with water. The pipes were known as spun cast iron, which had better material uniformity than their predecessors, with
corresponding improvements in material properties. In 1948 the composition of the iron was changed to produce what is known as ductile iron (DI) pipe, which was more ductile and less prone to graphitization (graphitization is a term used to describe the network of graphite flakes that remain behind after the iron in the pipe has been leached away by corrosion). However, the industrial production of ductile iron pipe did not begin until the late 1960s. By 1982 virtually all new installations of iron pipes were of ductile iron. Cast and ductile iron pipes deteriorate as a consequence of aggressive soil conditions, use of dissimilar metals in appurtenances and service connections and stray electric (direct) currents (from subways, electrical grounding, etc.). These conditions encourage external corrosion pits in ductile iron or the formation of graphitized zones in cast iron. Cathodic protection (CP) is a mitigative measure that has been implemented in many cities in recent years to slow down corrosion rates and reduce premature breaks and leaks in cast and ductile iron mains of water distribution networks. There are two types of corrosion protection in pipes, impressed current and sacrificial anodes. In this paper the discussion is limited to the latter because these are the only ones investigated in this research. Typically, cathodic protection (with sacrificial anodes) can be applied in two forms, namely, hot spot and retrofit. Hot spot cathodic protection (HS CP) is the practice of opportunistically installing a protective (sacrificial) anode at the location of a pipe repair. These anodes are typically installed without any monitoring and stay in the ground until total depletion, usually without replacement. Retrofit cathodic protection refers to the practice of systematically protecting existing pipes with sacrificial anodes. If an existing water main is electrically discontinuous (e.g., bell and spigot with elastomeric gaskets
and no bridging) then an anode is attached to each pipe segment (typically 6 m or 20’ in length for distribution mains of up to 300 mm or 12” in diameter). If a water main is electrically continuous then usually a bank of anodes (or an impressed current source) in a single anode bed can protect a long stretch of pipe. However, if the water main is not electrically continuous, continuity straps can be installed across pipe joints prior to the implementation of cathodic protection. Continuity straps are usually only applied on large diameter pipes. Cathodic protection applied to new pipes upon installation can be viewed as a special case of retrofit.
Theoretical models to quantifying the effectiveness of hot spot and retrofit (galvanic only) cathodic protection to reduce breakage rates of water mains were presented and discussed in a previous companion paper (Kleiner and Rajani 2004). The justification and the merits of developing these models were discussed there and will not be repeated here. A software application named D-WARP (Distribution Mains -Water Renewal Planner) was developed based on these models (Kleiner and Rajani, 2003; Rajani and Kleiner 2001). The intent of this paper is demonstrate/illustrate the use of these models to analyze field data and show how they can be used effectively to plan the renewal of municipal water networks. The paper describes in detail two typical case studies, including the analyses of their historical breakage patterns and the consequent life cycle costs as well as the generation of planning scenarios (“what if” type analysis) to examine and select effective renewal strategies.
Temptation always exists to select field case histories where the outcome highlights the ‘success’ of the underlying model. The outcome for the majority of the case histories we have conducted has been ‘successful’ or at least acceptable in terms of standard statistical tests. However, a few case histories have been encountered where the results have been inexplicable from the engineering judgment point of view (at least as we best understand it) and a few case histories where results of the analyses have been unsatisfactory. The data selected for the case histories discussed in this paper came from two water Ontario utilities, the City of Ottawa, (henceforth referred to as Ottawa) and Scarborough (now a part of the City of Toronto). Both utilities have had cathodic protection (hot spot and retrofit) programs in place on cast and ductile iron mains for some time.
The remainder of this paper is organized as follows. The next section outlines the steps taken to conduct the analysis of each case history. The third section describes the case histories for five groups of relatively homogeneous pipes. These five groups were deemed to be sufficiently diverse to succinctly illustrate the suitability and versatility of the proposed models. The application of the breakage-forecasting model, life cycle cost analyses and planning scenarios are discussed as appropriate for each of these groups. Summary and conclusions are provided in the final section.
DEVELOPMENT OF CASE HISTORIES
Four key steps were followed to prepare the case histories: (a) create homogenous groups of pipes, (b) conduct analyses of historical breakage patterns and use the results to
forecast future patterns, (c) conduct life cycle analysis, and (d) outline planning scenarios (“what if” analysis) to identify the appropriate cost effective replacement/rehabilitation strategies.
Breakage patterns in water mains can be affected by many factors. Pipe material and size, soil type, installation practices, etc. are considered static factors because they do not vary with time. Climatic conditions (temperatures, precipitation) as well as operational practices (CP, pressure regimes) are considered dynamic, or
time-dependent, factors because they change (or can change) over time. Kleiner and Rajani (2000, 2002) proposed a generalized form of an exponential model that included multiple time-dependent covariates. This model is based on the assumption that water mains experience ‘background ageing’, which is represented by a gradual (assumed exponential) increase in breakage frequency. In addition to the background ageing, the model assumes that there are time-dependent factors that influence the observed breakage frequency. Mathematically, these factors, which may include climate, cathodic protection, etc., influence modelled breakage frequency in the exponent. This model did not deal directly with static factors, rather it pre-supposed that the data could be partitioned into groups of pipes that were homogeneous with respect to their static conditions, i.e., the multi-covariate exponential model should be applied to a population comprising water mains of a certain material, size, vintage, etc. It is worth
noting that some data may not exhibit exponential growth and alternative functions may have to be used, e.g., polynomials, power function or bath-tub function where breaks are random and breakage rate is constant before visible ageing starts. It also important to note that all the models that endeavour to predict pipe breakage frequency of groups of pipes have an implicit assumption that breaks are uniformly distributed along the pipes in the group. This assumption is not always accurate, as breaks have often been observed to form clusters. However, these clusters may be uniformly distributed along the pipes, although the data in this research were not detailed enough to test the
uniformity of distribution.
The partitioning of data into homogeneous populations or ‘groups’ warrants careful attention because two conflicting objectives are involved. On one hand the groups have to be small enough to be uniform but at the same time, the groups have to be large enough to provide results that are statistically significant. Pipe characteristics that are most likely to significantly affect water main breakage patterns need to be identified, and
subsequently used as grouping criteria. Ideally, candidate characteristics for grouping criteria include pipe material, vintage, and diameter, soil type, operating pressures (if static), road type, road surface condition, material and density of service connections, etc. The typical utility however, will rarely have all these data available in a useable form.
Models to evaluate the impact of hot spot and retrofit CP on pipe breakage patterns have been described in detail in Kleiner and Rajani (2004). The covariate for the hot spot CP in the exponential model relates to the ‘density’ of effective hot spot anodes (or number of ‘live’ anodes per unit length of pipe) at any given year. The retrofit CP model assumes three phases in the breakage pattern. The first phase is the pre-retrofit period with an exponential growth of breakage rate. The second is a transition period, immediately after retrofit, through which the pipe breakage rate is assumed to decrease exponentially. This is because the pipe is likely to have some deteriorated parts with imminent breakage, which CP can delay but not altogether prevent. Once the protected pipe is ‘purged’ of these imminent breaks, the third phase begins, in which the pipe continues to age (exponential growth of breakage rate) albeit at a lower rate than before protection was implemented. It should also be noted that when both strategies are applied simultaneously, the model assumes that only the retrofit CP has an effect because the
density of anodes is much higher. Therefore, it is difficult to distinguish which strategy has the most effect when a utility starts to install hot spot anodes and begins retrofit program a few years later.
Ottawa has been a strong proponent of the use of cathodic protection (CP) as part of its water main rehabilitation program since 1990, when it initiated a hot spot CP program. Ottawa started a retrofit CP program in 1994, initially targeting older and undersized water mains but over time expanding to include water mains with lead services as well as mains with elevated breakage frequency.
Scarborough has been one of earliest water utilities in Canada to recognize hot spot and retrofit cathodic protection as a means to reduce the breakage rate of its metallic water mains. The hot spot program started between 1983 and 1986 (for the analysis presented here, 1984 was taken as the starting year) while the retrofit program effectively started in 1986, and increased substantially in 1990.
Water main data and pipe group definitions
The Ottawa pipe inventory data included 16,383 individual pipe records (2,200 km total length) each with material type, diameter, installation year and the year retrofit CP was applied. Soil data and service connection data were not available for each pipe. Break history data included the year and month of each breakage (repair) event from 1972 to 2001. Data on break types, e.g., circular, longitudinal split, blow out, etc, were not available.
Several groups of pipes were established from the Ottawa data but only one, Group OT-1, is discussed here. Group OT-1 consisted of lined cast iron (CI) pipes, 150 mm in
diameter, installed between 1954 and 1974. The total length of the water mains in Group OT-1 was 227 km and the total number of breaks recorded was 1,324. In Group OT-1, 19 km of water mains have been CP-retrofitted through the period 1994-2000. These retrofitted mains were denoted Sub-Group OT-1b. The water mains in Group OT-1 that have not been retrofitted (208 km) were denoted Sub-Group OT-1a. Pipes in Group OT-1 have been protected with hot spot CP (HS CP) since 1990. Figure 1 shows the all the CI
pipes in Group OT-1 and the portion of those retrofitted between 1994 and 2000. Table 1 gives key characteristics for pipes within each sub-group of Group OT-1.
The Scarborough pipe inventory data included 6,879 individual pipe records (a total of 1,155 km), each with material type, diameter, installation year and the year retrofit CP was applied. Nearly all the pipes had been installed in silty clays and therefore soil type could not be used as a pipe grouping criterion. Consequently, groups were largely established based on pipe material, diameter, vintage and whether they had cathodic protection retrofit or not. Break history data included year and month of each breakage (repair) event from 1962 to 2003. Data on break types were only available for some breaks and therefore were not be suitable as a grouping criterion.
Several homogeneous groups of pipes were established from the Scarborough data but only two groups, Groups SC-1 and SC-3, are discussed here. Group SC-1 consisted of 150 mm cast iron mains installed between 1921 and 1940, which corresponded to the period when pit cast iron mains with thick wall thickness were produced. Group SC-3 consisted of 150 mm ductile iron mains installed between 1960 and 1996 as shown in Figure 2 and subsequently retrofitted between 1986 and 2003. Group SC-3 was divided into sub-groups ‘a’ and ‘b’ representing pipes without and with retrofit, respectively. Table 1 gives key characteristics for pipes within each sub-group of Group SC-3.
Climatic data for Ottawa and Scarborough were obtained from Environment Canada and included average monthly precipitation and average daily temperatures for the period 1960 to 2003. The daily temperatures were converted to freezing index (FI) in units of degree-days per year, which is a surrogate measure of the severity of a winter in a given year. The temperature and the precipitation data were converted to rain deficit (RD) in units of length (mm or inch) per year, which is a surrogate measure of soil moisture. Two forms for RD values were used. One form for RD was cumulative, which represents the average soil moisture during any given year. The other form for RD was a snapshot, which depicts the rain deficit at the beginning of the freezing season. Detailed
explanations on how FI and RD were calculated, along with the rationale for their usage is provided in Kleiner and Rajani (2002).
Breakage analysis - Ottawa
As noted earlier, Sub-Group OT-1a consisted of 208 km of pipes with the same material, size and vintage. In this type of statistical analysis there were two implicit assumptions; (1) the group of pipes was more or less homogeneous with respect to its breakage pattern response to the climatic and operational conditions, and (2) breakages were more or less uniformly distributed along the water mains in the group. One should be aware that despite these assumptions, in a large group of 208 km, some significant deviations from the average values represented by the coefficients of the model are likely to exist. It is reasonable to assume that given more data, e.g., soil type and/or service connection type and densities, grouping could be refined to achieve a higher degree of homogeneity in any group. However, as mentioned earlier, this would result in smaller groups, and correspondingly results with possibly lower statistical significance. It is very important to perform this type of analysis while applying sound engineering judgment. If there are significant deviations from the average pattern, these should be analyzed separately, while recognizing the limitations of small statistical samples.
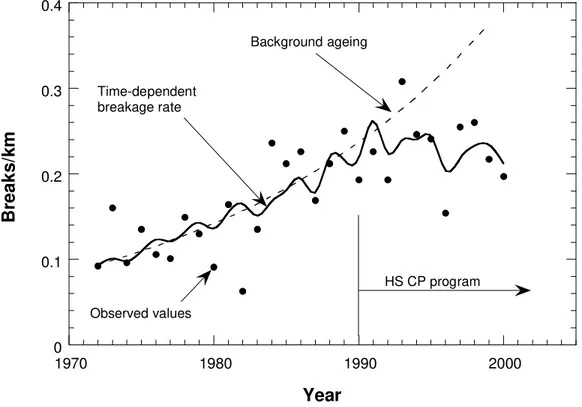
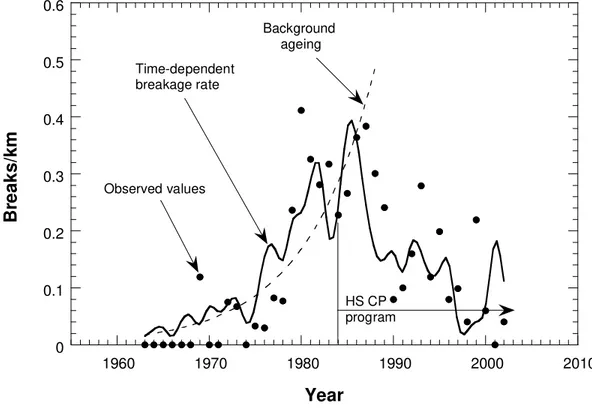
Figure 3 illustrates the breakage rate pattern between 1970 and 2001 identified for the sub-group OT-1a with a hot spot cathodic protection (HS CP) program that started in 1990. The covariates used for the regression included the (mandatory) background ageing as well as freezing index (FI), rain deficit (RD) (both cumulative and snapshot), and (HS CP). For the HS anodes, the life expectancy and time lag were assumed tLF = 15 years, tLG = 1 year, respectively (life expectancy is defined as the duration through which the anode functions effectively in the ground, time lag is defined as the average time between anode installation and full cathodic protection – see Kleiner and Rajani, 2004).
The coefficients (Table 2) corresponding to each of the covariates applied in this analysis indicate the influence of each covariate on the historical breakage pattern. The ageing rate of 0.053 of sub-group OT-1a indicates that the breakage rate (breaks/km) increased about 5.3% annually. This ‘background ageing’ is depicted by the dashed curve in Figure 3. The quality of the model ‘fit’ in the break history analysis of sub-group OT-1a (adjusted coefficient of determination r2 = 0.558) could be considered as quite high for this type of analysis.
The freezing index (FI) at a value of -0.058 had a rather small influence on the breakage pattern. The rainfall deficit (RD) coefficients with values as small as 0.016 and 0.04, seemed to play an insignificant role. A plausible reason for FI having such a minor influence on the breakage rate in Ottawa is that the typical depth of water mains is 2.4 m (8 feet), which is below much of the frost penetration depth. Further, Ottawa receives a high precipitation rate throughout the year and therefore the soil moisture is rarely depleted, which might explain why RD had no influence on the breakage pattern of sub-group OT-1a. The hot spot CP had a notable influence in decreasing break rates
(coefficient value of -0.135), as is evident from the downturn of the breakage rate starting in the early 1990s.
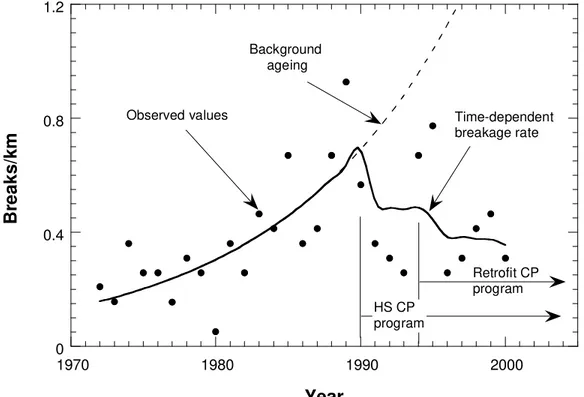
Figure 4 illustrates the historical breakage pattern established for the sub-group OT-1b, with 19 km of CI pipes that have been ‘hot spotted’ since 1990 and gradually retrofitted with CP since 1994. Similar to sub-group OT-1a (and arguably for the same reasons described earlier), the climate covariates did not have a significant influence on the quality of the model ‘fit’. In fact, omitting the FI and RD covariates from the analysis increased the value of the adjusted coefficient of variation (r2) because of the ‘gain’ of three degrees of freedom in the regression. The ageing rate, however, was almost 50% greater than that of OT-1a, at 0.082, which probably explains why this group of pipes was first selected for retrofit.
Figure 4 clearly shows the sharp downturn in the breakage rate in the early 1990s
following the start of the HS CP program. There seemed to be a continuing decline in the breakage rate from the mid 1990s, when the retrofit program started. It should be noted that the mathematical model assumes that once a pipe is retrofitted, the HS CP effect is completely overwhelmed by the retrofit effect because of the sheer density of the retrofit anodes and because it is assumed that retrofit CP is renewed in perpetuity. Consequently, the model attributes the decline in breakage rate after 1994 to the retrofit program; however, it is plausible that the breakage rate in this group might have continued to decline with the HS CP only, even without the retrofit CP program.
The relatively low adjusted coefficient of determination (r2 = 0.316) indicates a moderately poor fit of the model to the data. This could be partially explained by the
small sample size. Additionally, the breakage rates observed in 1994 and 1995 seemed to be the largest contributors to this poor fit. There was, however, no compelling reason to treat these two observations as outliers.
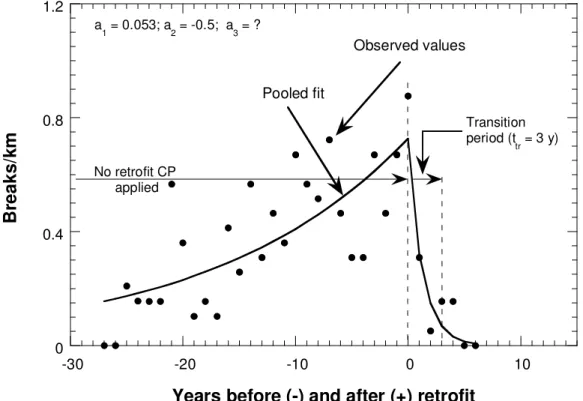
For situations where few data exist on breakage rates before and after retrofit CP, Kleiner and Rajani (2004) proposed an alternative method to establish model coefficients, where the breakage data are pooled so as to reflect breakage rates at years relative to the year of retrofit, rather than along an actual time line. Figure 5 shows the breakage pattern before and after retrofit CP for sub-group OT-1b. Two of the three phases of the retrofit model, pre-retrofit breakage increase and post-retrofit transition period are clearly shown. There were insufficient post-retrofit breakage data to establish the post-retrofit (third phase) breakage pattern.
The ageing rate prior to retrofit CP (phase 1) is a1 = 0.053, which is smaller than 0.082 obtained through the true ‘time-line’ break history analysis. This apparent incongruity could be explained by the fact that in the last 5 years prior to the beginning of the retrofit program the pipes had been protected by HS CP, which reduced the observed pre-retrofit breakage rate. The transition period (ttr) was found to be 3 years with a breakage rate reduction coefficient a2 = -0.5. The adjusted coefficient of determination was a relatively high 0.605. The pooled analysis shows that corrosion is essentially arrested within a period of 3 years after anode installation. The post retrofit ageing parameter, a3, could not be reliably established because of insufficient post retrofit data.
Breakage analysis - Scarborough
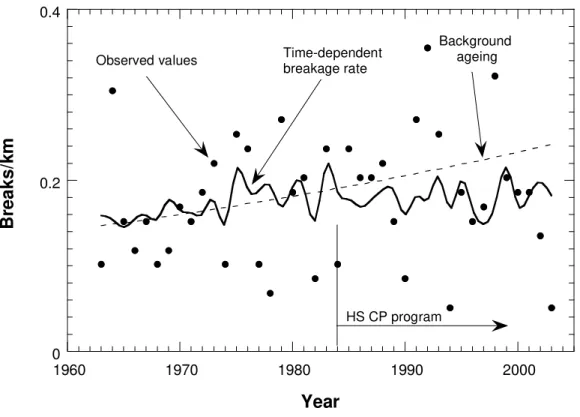
Figure 6 illustrates the pattern of the historical breakage rates established for Group SC-1, with a hot spot CP program that commenced in 1984. The adjusted coefficient of
determination (r2 = -0.099) is very low, indicating a poor ‘fit’ of the model to observed data. The ageing rate is estimated at 0.012 (breaks/km). The hot spot CP program did not seem to have had minor (if any) influence on the observed break rates.
A coherent ageing pattern was not detected and the climatic as well as the CP covariates did not seem to contribute much to the model’s ‘explanatory’ ability. A possible
explanation for this phenomenon could be that the pipes within this group belonged to a class of pipes that were manufactured prior to 1957 and had a wall thickness of 10.9 mm (0.43 in), which is high in comparison with pipes that were manufactured and installed in later years. It is possible that the high wall thickness for this vintage of pipes was
responsible for the lack of visible ageing. This phenomenon may correspond to the bathtub theory (Kleiner and Rajani 2001), where this group could be in the ‘in-usage’ phase (where breaks are random and breakage rate is constant before visible ageing starts). It should however be noted that the exponential models used in the current analysis cannot mathematically accommodate the bathtub theory. It might therefore be beneficial to dedicate future research to developing an alternative model that could address pipe groups whose breakage pattern resembles the ‘in-usage phase’.
It can be seen that in this group, this ‘constant’ breakage rate (0.1 – 0.3 breaks/km/yr) is relatively low compared to the other groups, which is another indicator that Group SC-1 is in the ‘in-usage’ phase of a typical bathtub curve of the life cycle of a buried pipe. It should be noted that this specific group was selected as a case history to illustrate that it is not always possible to identify ageing (deterioration) where observed data indicate that it does not exist.
The break history analysis for sub-group SC-3a is shown in Figure 7 and the values for the corresponding coefficients are in Table 2. Sub-group SC-3a consisted of ductile iron (DI) pipes with hot spot CP anodes installed since 1984. The quality of the model “fit” in the break history analysis of sub-group SC-3a (adjusted coefficient of determination r2 = 0.524) is moderately high. It appears that the hot spot CP program has had a dramatic influence (coefficient value of -0.503) in reducing the breakage rate of these ductile iron pipes for the past 20 years. The background ageing rate of 0.133 indicated an annual breakage rate increase (breaks/km) of about 13.3%, which is extremely high compared to the groups of mains discussed earlier.
All climatic covariates except freezing index (FI) turned out to have a significant effect on the breakage pattern of sub-group SC-3a. It should be noted, however, that the influence of snapshot rainfall deficit is significant and the value for the cumulative
rainfall deficit is contrary to expectation according to the rationale provided by Kleiner and Rajani (2004). This contradiction could not be explained at the time of analysis. Further research is certainly warranted on possible pipe failure mechanisms that could explain this observation, or alternatively, improve the underlying model.
The break history analysis for sub-group SC-3b is shown in Figure 8. Sub-group SC-3b consisted of DI pipes that had been gradually retrofitted with anodes since and had, as well, CP hot spot anodes installed since 1984. The combined effect of retrofit and hot spot strategies for the past 18 years has had a dramatic influence to arrest water main breaks to insignificant levels. The background ageing rate of 0.172 indicated an annual breakage rate increase of about 17.2%, which is about 25% higher (Table 2) that for the ductile iron mains in sub-group SC-3a. The overall breakage rate of sub-group SC-3b was an order of magnitude higher than that of Group SC-3. This difference probably explains why this particular group was targeted by the utility for the retrofit cathodic protection. Two concurrent CP programs between 1994 and 2003 protected sub-group SC-3b. The hot spot CP had a notable influence in reducing break rates although the corresponding coefficient (value of -0.24) seemed low relative to sub-group SC-3a. The reason for this low coefficient value is that the HS CP covariate expresses the density of effective anodes along the pipe. In fact the factor that actually influences the model is the product of this density and the corresponding coefficient. Since the average number of breaks/km in sub-group SC-3b was much higher than that in sub-group SC-3a, the corresponding HS CP coefficient was much lower (the respective products are similar) resulting in a similar influence of HS CP on the breakage rates of the two sub-groups. This suggests that one should be judicious when attempting to apply HS CP coefficients across sub-groups. Nearly 66% of the 96 km of DI pipes in sub-group SC-3b were retrofitted between 1995 and 2003 (the last 8 years of the analysis period), which indicates that the hot spot
program initiated in 1984 was significantly responsible for the decrease in breakage rates. It is therefore possible that the hot spot retrofit program alone might have been sufficient to affect most of the observed decline in breakage rate of sub-group SC-3b.
Both rainfall deficit covariates, RD snapshot and RD cumulative, turned out to have a significant effect on the breakage pattern of Group SC-3b. Omitting the freezing index (FI) from the analysis increased the adjusted coefficient of determination, r2, from 0.763 to 0.78 because of a gain of one degree of freedom. Once again the coefficients of the RD covariates were negative, which is contrary to expectation.
Figure 9 illustrates the results of the alternative method of analyzing breakage data for retrofitted pipes by pooling the breakage data so as to reflect breakage rates in years relative to the year of retrofit, rather than along a time line. Three phases, including a pre-retrofit breakage increase, post-pre-retrofit transition period and post pre-retrofit breakage
increase are clearly identified. The ageing rate obtained (0.172) through ‘conventional’ break history analysis was significantly higher than that estimated (0.063) from pooled analysis. This apparent incongruity in estimates of ageing rates prior to the application of CP has been explained earlier for sub-group OT-1b, except that the difference here is much higher, probably because the HS CP covariate coefficient in sub-group SC-3b is much higher than that of sub-group OT-1b.
Discounted life cycle costs and planning analysis - Ottawa
Subsequent economic analyses were based on the unit costs for breakage repair, replacement pipe and cathodic protection, shown in Table 3. Estimates of direct costs were obtained from the respective water utilities, while indirect costs related to third party damage and intangible social costs were estimated using our best judgment and experience. The choice of an appropriate discount rate for public investment is a much debated issue that has been researched extensively. The magnitude of the discounting factor directly influences the cost of any strategy. A high discount factor diminishes the impact of future costs and thus encourages the deferral of investments. Conversely, a lower discount factor will tend to favour a strategy that includes an earlier
replacement/rehabilitation/ retrofit. Steiner (1969) noted two major approaches to this issue: (a) the discount rate should reflect some kind of marginal cost of capital, and (2) the discount rate should reflect some kind of explicit measure of social time preference (hence the term ‘social discount rate’). Swartzman (1982) perceived the discount rate as a means of distributing available resources over time, or in his words “...discounting acts to
distribute benefits today, paid for tomorrow”. Consequently, he concluded that the selection of the discount rate reflected the political and ethical attitudes of the decision-maker. It is the view of the authors that for public projects, such as water main
replacement, a social discount rate in the range of 2.5% to 3.5% (in constant dollars – net of inflation) is appropriate. The discount factor was therefore taken as 3%.
Generally, the explicit minimization of life cycle costs requires the comparison of the present value of all the costs that are associated with a decision strategy. As pipes age, their breakage rates increase and therefore the present value of breakage repair costs increase as well. At the same time, as one defers pipe replacement, the present value of replacement costs is reduced due to discounting. The sum of all these costs typically form a convex cost curve, whose minimum point is the optimal time for replacement, as is illustrated in Figure 10. Kleiner and Rajani (2004) showed how the costs of hot spot and retrofit cathodic protection could be considered in the life cycle cost analysis for water mains. They demonstrated that an effective cathodic protection program could shift this total cost curve so as to delay the optimal time of replacement as well as reduce the total cost.
Figures 11 and 12 show the life cycle costs of Ottawa’s CI pipe sub-group OT-1a with HS CP or with retrofit CP, respectively. The convex curve depicting the total cost is clearly visible. The figures show also how this convex curve varies depending on the time at which the cathodic protection program commences. The cost curves comprise the total life cycle (excluding pipe installation), including breakage repair and breakage-related costs, cathodic protection measures, pipe replacement as well as breakage costs that are associated with replacement (new) pipe when deterioration advances.
Figure 11 shows that for sub-group OT-1a, hot spot CP has a significant impact on the life cycle cost of the water mains, as it can shift the bottom of the total cost curve down and right (reducing total cost as well as deferring the optimal time of replacement or thus in fact extending the economic life of the pipe). Without cathodic protection, the
economic life of the pipes in this group is about 75 years, with a life cycle cost of about $151,000/km. The HS CP implementation can extend the life to beyond 200 years and reduce the life cycle cost significantly, depending on when the HS CP program
commences. Figure 11 further shows that for sub-group OT-1a there is little cost saving when HS CP is implemented very early in the life of a pipe, compared to a later time. This is expected because at an early deterioration stage the number of breaks is relatively small and the number of HS anodes will thus be small, resulting in a very small
difference in breakage rates with or without HS CP. As the pipe ages and deteriorates further, the cost savings in implementing HS CP become increasingly more significant. Consequently, the total discounted life cycle costs are not much different whether HS CP commences at a pipe age of 0, 25 or 50 years. Having said that, it appears that early implementation of HS CP is prudent because cost is minimal. At the same time, late implementation can also be quite beneficial. Ottawa had initiated the hot spot CP program in 1990 (the group vintage is 1954 to 1974), which appeared to be a robust strategy for sub-group OT-1a.
Figure 12 shows the life cycle costs of the pipes in the same sub-group OT-1a, assuming they would be retrofitted rather than hot spotted. Retrofit CP appears to have a substantial impact on the life cycle cost. The optimal time of commencing a retrofit program is at age 24, however, even if the pipes were retrofitted as late as age 80, the optimal time for replacement would still be deferred to beyond 200 years of age and the total discounted life cycle cost would be reduced to about $60,000/km. Figure 12 also shows that retrofit CP would be beneficial (deferring replacement and reducing life cycle costs) even if implemented at a pipe age as late as 100 years. Figures 11 and 12 show that the life cycle costs of HS CP is somewhat lower than that of retrofit. This is attributed to the relatively early and large cash outlay that the retrofit strategy entails. Ottawa had initiated its retrofit CP program in 1994 (the group vintage is 1954 to 1974), which appeared to be a good strategy for Group OT-1b. It should be remembered, however, that this life cycle cost analysis treats each strategy (hot spot or retrofit) as if it was the only one
implemented. In sub-group OT-1b, if both strategies were used simultaneously, one must apply engineering judgment to choose the more appropriate cost curve.
The life cycle cost analyses presented above reflect the average behavior of the respective groups of water mains, and as such were useful to obtain a general indication of the windows of opportunities to cathodically protect or to replace pipes in those groups. In
reality, large groups of pipes cannot be protected, let alone replaced, at once, due to budgetary constraints. A viable way to establish an effective, yet realistic strategy is to generate and compare reasonable scenarios, based on engineering judgment. These scenarios can be compared on two criteria, cost and customer service, where breakage rate (breaks per 100 km per year) serves as a surrogate measure of customer service level. Assumptions regarding the replacement pipe are discussed in detail by Kleiner and Rajani (2004) and will not be repeated here except to emphasize that it was assumed that the replacement (new) pipe would also experience eventual breakage. In the analysis discussed here, the replacement pipe was assumed to have an initial breakage rate of 5 breaks/100 km and a breakage growth rate of 1 breaks/100 km/yr.
Six scenarios were examined for the planning exercise for sub group OT-1a with a planning horizon of 30 years as shown in Table 4. Scenario OT-1a/S1 depicts the de-facto 2003 Ottawa strategy, in which an average of 2 km of pipe are replaced and an average of 4 km of pipe retrofitted annually (Raymond 2003, 2004) while hot spot CP is on-going. Scenario OT-1a/S2 depicts a ‘do nothing’ strategy. Scenario OT-1a/S3 depicts a ‘continue hot spot CP only’ strategy with no retrofit and no replacements. Scenario OT-1a/S4 approximates Ottawa’s current (2003) strategy, except with zero replacement. Scenario OT-1a/S5 depicts Ottawa’s current (2003) strategy, except with zero retrofit. Scenario OT-1a/S6 depicts an ‘aggressive retrofit’ strategy with no replacement. The discounted costs with the average expected breakage rates over the planning horizon of 30 years for the six scenarios are shown in Table 4.
The scenario analyses shows that whenever HS CP is effective in reducing breakage rate, retrofit would be at least as effective because it introduces a higher density of anodes. This can be clearly seen in scenarios OT-1a/S4 and OT-1a/S6, where aggressive retrofitting will reduce breakage rate significantly, compared to HS CP alone. The difference in the economic comparison becomes one of cost, and more importantly discounted cost. Retrofitting a pipe early in its life introduces a high, up-front cost, which increases the discounted life cycle costs because of its timing in comparison to HS CP. Another practical difference is that while HS CP is usually implemented simultaneously
across the network, while retrofit will be usually implemented gradually due to funding limitations.
A common approach to identify the best strategy among a set of competing strategies with multiple objectives is to plot the outcome for each strategy in the form of a scatter plot, e.g., present value of costs vs. expected average breakage rate. This approach simplifies the consideration of a large number of possible strategies. This form of the scatter plot is also known as Pareto optimality, which measures efficiency in multi-criteria and multi-party situations and is found to have wide applicability in economics, game theory, multi-criteria decision-making, and the social sciences. In the current example, the two conflicting objectives are costs and breakage rate. If strategy A is both more expensive and results in a higher breakage rate than strategy B, it is said that
strategy A is inferior. A collection of all non-inferior strategies forms a ‘Pareto optimality front’. The results of the six scenarios were plotted on a chart to define an approximate Pareto optimality front, as illustrated in Figure 13. It can clearly be seen that scenarios OT-1a/S1, OT-1a/S2, OT-1a/S3, OT-1a/S4, and OT-1a/S5 were inferior and scenario OT-1a/S6 was non-inferior. Scenario OT-1a/S6 can be considered to be on the optimality front, in view of the precision levels involved in these analyses. A rigorous analysis might include more scenarios to define a more robust Pareto efficiency front. The decision maker could then select the preferred scenario along this front. This preference would reflect the implicit monetary value that the decision maker placed on the average breakage rate as a surrogate for customer service level.
Discounted life cycle costs and planning analysis - Scarborough
The discounted life cycle cost analyses for Group SC-3a are illustrated in Figure 14 and Figure 15. Unit cost data for the life cycle analysis are shown in Table 3. Figure 14 and Figure 15 show that without CP the optimal time for replacing the pipes was estimated at the age of 38, and their total discounted life cycle cost if replaced at that age was
approximately $277,000/km, which was the result of a very high ageing rate. Figure 14 shows that applying HS CP (alone) at any time before the age of about 20 years, could reduce the life cycle cost to $65,000/km and extend the economic life of the
pipe to beyond 100 years. The ‘jumps’ present in the life cycle cost curve for HS CP starting at the age of 50 are related to the oscillations of the breakage rate curve presented in Kleiner and Rajani (2004). These occur when the HS CP coefficient is relatively high and HS CP is initiated on pipes that already have a high breakage rate. A possible remedy to ‘smooth out’ these jumps is to make the realistic assumption that HS CP anodes do not all ‘die’ at the same time when they reach their expected life (15 years in our case
studies), but rather their deaths span a number of years. It is to be noted that this behavior of the model was only revealed through the development of the case study for
Scarborough sub-group SC-3a, which has the specific characteristics outlined earlier. This emphasizes the importance of validating models with data from realistic case studies. The authors plan to implement this assumption in the model and update future versions of D-WARP accordingly.
Figure 15 shows if the pipe were retrofitted with CP upon installation (no hot spot
protection), the optimal time for replacement would be deferred to beyond the age of 100 years and its total discounted life cycle cost would be reduced to below $113,000/km. Figure 15 also shows that retrofit CP could be beneficial (deferring replacement and reducing life cycle costs) even if implemented at a pipe age as late as 25 years. The retrofit program that effectively began in 1990 for Group SC-3b has resulted in a
significant reduction in breakage and replacement costs. It is to be noted that doubling of the ageing rate between Groups OT-1a and SC-3a, i.e., 0.053 to 0.133, had the dramatic effect of reducing the optimal renewal time from 75 to 38 years. Therefore, control of the ageing rate through the mitigative application of cathodic protection on cast and ductile iron mains has important economic (life cycle costs) implications.
Six planning scenarios (Table 5) were generated for Group SC-3a, with a planning horizon of 30 years. Scenario 3a/S1 depicted a ‘do nothing’ strategy. Scenario SC-3a/S2 depicted a ‘hot spot CP only’ strategy with no retrofit and no replacements. Scenario SC-3a/S3 depicted the ‘minimum’ option, in which an average of 4 km of pipe would be retrofitted annually and hot spot CP would continue. Over 30 years of planning horizon, all 50 km of pipes would thus be retrofitted over the first 12.5 years at the rate of 4 km/year. Scenario SC-3a/S4 depicted Scarborough’s current (2004) strategy of
retrofitting about 12 km of pipe in 2003, but without pipe replacement. Scenario SC-3a/S5 depicted an ‘aggressive’ strategy, where 20 km of pipe would be retrofitted. Scenario SC-3a/S6 depicted a ‘half and half’ strategy, where 10 km of pipe would be retrofitted and an equal amount would be replaced annually.
Figure 16 clearly shows the Pareto front of the non-inferior scenarios, which include SC-3a/S4 and SC-3a/S5. Scenario SC-3a/S6 (SC-3a/S1 is plotted out of scale) is clearly inferior. Scarborough is currently (2004) operating according to scenario SC-3a/S4, but scenarios SC-3a/S3 could be considered to be very near the efficiency front, given the precision level of this type of analysis.
SUMMARY AND CONCLUSIONS
Several case histories have been explored to establish the effectiveness of hot spot CP and retrofit CP to reduce breakage rates of cast and ductile iron water mains. The
analyses used the previously developed time-dependent multi-covariate break prediction approach (Kleiner and Rajani, 2004). The analyses were done on groups of pipes that were relatively homogeneous with respect to their historical breakage patterns. The underlying model assumed that these breakage patterns were influenced by static factors (e.g., pipe material, diameter, vintage soil) accounted for in the grouping criteria, and by dynamic factors (climate, CP) accounted for in the model covariates.
Once the historical breakage patterns were established, the background ageing was used to predict the future breakage patterns of these groups, with or without cathodic
protection. These predictions enabled the determination of life cycle costs for each pipe group, as well as establish the impact of CP programs on these costs. Subsequently, various scenarios were created and examined for total costs and impact on breakage reduction.
The case histories showed that cathodic protection programs (hot spot and retrofit strategies) have had a significant effect on reducing breakage rates on at least four of the five groups that were analyzed. The proposed tools and methods should assist water utilities to better understand the implication of cathodic protection on the performance of distribution networks and optimize the implementation and scheduling of future cathodic
protection programs. Where water utilities do not have specific data on ‘before and after’ cathodic protection breakage rates, they may attempt to use data from other water utilities that have similar pipe inventories and operate under similar environments and conditions. All the case histories were developed using a decision support tool that incorporated the concepts and models discussed in a previous paper (Kleiner and Rajani 2004). The case histories were judiciously selected to demonstrate the strengths and limitations of the method and the models. It is therefore important to understand that engineering judgment is imperative in order to obtain credible results independent of the use of simple or complex models to conduct breakage analyses. It cannot be over emphasized that although the analyses presented is quantitative, the numbers should be treated as broad tendencies rather than precise solutions given the precision and accuracy of the type of analyses.
References
Kleiner, Y. and Rajani, B. (2000). “Considering time-dependent factors in the statistical prediction of water main breaks”, Proc. American Water Works Association
Infrastructure Conference, Baltimore, Maryland, 1-12.
Kleiner, Y. and Rajani, B. (2002).“Forecasting variations and trends in water main breaks”, Journal of Infrastructure Systems, ASCE, 8(4), 122-131.
Kleiner, Y. and Rajani, B. (2004). “Quantifying Effectiveness of Cathodic Protection in Water Mains: Theory”, Journal of Infrastructure Systems, ASCE, 10(2), 43-51. Kleiner, Y. and Rajani, B. (2003). “Water main assets: from deterioration to renewal”,
Proc. AWWA Annual Conference, Anaheim, California, 1-12.
Kleiner, Y. and Rajani, B. (2001). “Comprehensive review of structural deterioration of water mains: statistical models”, Urban Water, 3(3), 157-176.
Raymond, D. (2004). “Cathodic Protection and Life Cycle Issues, City of Ottawa – Drinking Water Services Cathodic Protection and Life Cycle Issues”, Proc. NACE Northern Area Western Conference, Victoria, British Columbia, 1-13.
Steiner, P.O. (1969). “Public Expenditure Budgeting”, Brookings Institution, Washington, 48-54.
Swartzman, D. (1982). “Cost-Benefit Analysis and Environmental Regulations”, (D. Swartzman editor), The Conservation Foundation, Washington, 64-65.
Table 1. Principal characteristics of homogenous data groups for breaks on water mains from Ottawa and Scarborough.
Ottawa Scarborough
Group OT-1 Groups SC-1 and SC-3
Sub-groups OT-1a OT-1b SC-1 SC-3a SC-3b
Pipe material cast iron
(spun)
cast iron (spun)
cast iron
(pit) ductile iron ductile iron
Pipe diameter (mm) 150 150 150 150 150
Vintage 1954-1974 1954-1974 1921-1940 1960-1996 1960-1996
Hot spot year 1990 1990 1984 1984 1984
Retrofitted No Yes§ No No Yes†
Pipe length (km) 208 19 59 50 96
No of breaks 1,083 241 435 247 1,201
Average break rate
(/100 km/year) 18 44 17 11 28
§ retrofit CP started gradually in 1994 in Ottawa † retrofit CP started in 1986 in Scarborough.
Table 2. Summary of covariate coefficients for breakage analysis using D-WARP. Sub-group Ageing Freezing index (FI) Rainfall deficit (RD) -cumulative Rainfall deficit (RD) -snapshot Hot spot Adjusted Coefficient of determination (r2) Group OT-1a 0.053 -0.058 0.016 0.040 -0.135 0.558 Group OT-1b 0.082 - - - -0.485 0.316 Group SC-1 0.012 0.097 0.142 -0.117 -0.038 -0.099 Group SC-3a 0.133 - -0.424 -0.107 -0.503 0.524 Group SC-3b 0.172 - -0.285 -0.165 -0.240 0.780
Table 3. Economic data for life cycle costs and planning analyses.
Ottawa
Scarborough
Group OT-1a SC-3a
Break repair $5,000 $4,500
Direct breakage cost
($/event) Water loss $100 $100
Damage $2,000 $3,000
Indirect breakage cost ($/event)
Social $500 $500
Break repair ($/event) $2,000 $3,000
Replacement pipe
cost Construction cost ($/m) $500 $500
Hot spot anode ($/unit) $100 $300
Retrofit existing pipe ($/km) $30,000 $50,000
Cathodic protection
Retrofit at pipe installation ($/km) $15,000 $20,000
Hot spot and retrofit anode life 15 years 15 years
Table 4. Planning scenarios for Group OT-1a (208 km) from Ottawa.
Discounted Costs ($1,000)
Replace-ment
Retrofit
Scenario length / year
(km) Breaks HS CP anodes Retrofit CP Replace m ent Total Average Breakage rate / 100 k m / year OT-1a/S1 2 4 4,930 56 2,410 20,079 27,474 15.4
OT-1a/S2 nil nil 25,613 0 0 0 25,613 90.8
OT-1a/S3 nil nil 9,409 120 0 0 9,528 31.6
OT-1a/S4 nil 4 7,131 85 2,410 0 9,625 22.6
OT-1a/S5 2 nil 7,240 92 0 20,079 27,411 24.3
OT-1a/S6 nil 20 2,500 19 5,410 0 7,929 6.2
Table 5. Planning scenarios for Group SC-3a (50 km) from Scarborough.
Discounted Costs ($1,000)
Replace-ment
Retrofit
Scenario length / year (km)
Breaks HS CP anodes Retrofit CP Replace m ent Total Average Breakage rate / 100 k m / year
SC-3a/S1 nil nil 218,773 0 0 0 218,773 > 3500
SC-3a/S2 nil nil 3,093 107 0 0 3,200 38
SC-3a/S3 nil 4 1,034 29 2,125 0 3,188 9.3
SC-3a/S4 nil 12 565 11 2,397 0 2,973 4.6
SC-3a/S5 nil 20 446 6 2,454 0 2,906 3.5
0 10 20 30 1954 1964 1974 1984 1994 2004 Year P ipe l e ngt h
Figure 1. Lengths of 150 mm diameter CI pipes installed (between 1954 and 1974) and retrofitted (between 1994 and 2000) in Ottawa.
in s ta lle d /r e tr o fit te , k 0 100 200 300 C um ul a ti v e pi pe l e ngt h in s ta lle d /r e tr o fit te d , k m Cumulative (installed) Cumulative (retrofitted) d m
0 5 10 15 20 25 1960 1970 1980 1990 2001 Year P ipe l e ngt h in s ta lle d /r e tr o fit te d , k m 0 40 80 120 160 200 C um ul a ti v e pi pe l e ngt h in s ta lle d /r e tr o fit te d , k m Cumulative (installed) Cumulative (retrofitted)
Figure 2. Lengths of 150 mm diameter DI pipes installed (between 1960 and 1994) and retrofitted (between 1994 and 2003) in Scarborough.
0 0.1 0.2 0.3 0.4 1970 1980 1990 2000 Br
Figure 3. Breakage analysis for pipe sub-group OT-1a.
eaks/ k Year m HS CP program Observed values Background ageing Time-dependent breakage rate
0 0.4 0.8 1.2
1970 1980 1990 2000
Figure 4. Breakage analysis for pipe group OT-1b.
Br e k Year aks/ m HS CP program Observed values Background ageing Time-dependent breakage rate Retrofit CP program
0 0.4 0.8 1.2 -30 -20 -10 0 10 a 1 = 0.053; a2 = -0.5; a3 = ? Observed values
Figure 5. Breakage analysis for pooled data of pipe group OT-1b.
Br
eaks/
k
Years before (-) and after (+) retrofit
m No retrofit CP applied Transition period (t tr = 3 y) Pooled fit
0 0.2 0.4 1960 1970 1980 1990 2000 Br eaks/
Figure 6. Breakage analysis for Group SC-1.
k m Year HS CP program Observed values Background ageing Time-dependent breakage rate
0 0.1 0.2 0.3 0.4 0.5 0.6 1960 1970 1980 1990 2000 2010 Br e
Figure 7. Breakage analysis for sub-group SC-3a
aks/ k m HS CP program Observed values Background ageing Time-dependent breakage rate Year
0 0.5 1 1.5 2 1960 1970 1980 1990 2000 2010
Figure 8. Breakage analysis for Group SC-3b
Br e k Year aks/ m HS CP program Observed values Background ageing Time-dependent breakage rate Retrofit CP program
0 0.5 1 1.5 -30 -20 -10 0 10 20 Br e a 1 = 0.063; a2 = -1.976; a3 = 0.008 No retrofit CP applied Transition period (t tr = 3 y) k m
Figure 9. Pooled break analysis for retrofitted pipes in Group SC-3b
aks/
u
e
)
esent val
Total expected cost
Figure 10. Life cycle cost curve
C
o
s
P
Time of renewal (years)
Cost of replacement ts ( r Cost of breakage t* (optimal time)
$0 $200 $400 $600 $800 0 50 100 150 200 250
Figure 11. Life cycle cost for hot spot cathodic protection of pipes in Group OT-1a.
T o ta l scou te fe st $
Age at replacement (years)
Start HS CP on installation Start HS CP at age 50 No HS CP K) s ( T* = 75 years (No HS CP) d i n d li -cycl e co Start HS CP
$0 $200 $400 $600 $800 0 50 100 150 200 250 T o ta l d iscou nt ed li fe -cycl e co sts ( $ K)
Age at replacement (years)
Retrofit on installation No retrofit Start retrofit at age 100 Start retrofit at age 24 (optimal)
T* = 75 years (No retrofit)
a r) 0 25 50 75 100 $0 $10 $20 $30 $40 OT-1a/S1 OT-1a/S2 OT-1a/S3 OT-1a/S4 OT-1a/S5 OT-1a/S6
Figure 13. Pareto graph for planning scenarios for pipe group OT-1a from Ottawa.
Ave
rag
e
y
e
Present value of costs ($ M)
Approximate Pareto front m / (100 k a te eakage r ? b r ?
$0 $500 $1000 0 25 50 75 100 a l scou te fe st $
Age at replacement (years)
Start HS CP on installation
No HS CP
K)
s (
Figure 14. Life cycle cost for hot spot cathodic protection of pipes in Group SC-3a.
T o t d i n d li -cycl e co Start HS CP at age 50 T* = 38 years (No HS CP) Start HS CP at age 25
$0 $500 $1000 0 25 50 75 K) 100 a l scou te fe st $
Age at replacement (years)
Start retrofit on installation
No retrofit
s (
Figure 15. Life cycle cost for retrofit cathodic protection of pipes in Group SC-3a.
T o t d i n d li -cycl e co T* = 38 years (No retrofit) Start retrofit at age 50 Start retrofit at age 25
a r) 0 10 20 30 40 0 5 10 15 20 SC-3a/S2 SC-3a/S3 SC-3a/S4 SC-3a/S5 SC-3a/S6
Figure 16. Pareto graph for planning scenarios for pipe group SC-3a from Scarborough.
Ave
r
b
k
e
Present value of costs ($ M)
SC-3a/S1 (out of range) m / y ? Approximate Pareto front ag e reakage r a te (100 ?
Figure 1. Lengths of 150 mm diameter CI pipes installed (between 1954
and 1974) and retrofitted (between 1994 and 2000) in Ottawa... 26
Figure 2. Lengths of 150 mm diameter DI pipes installed (between 1960 and 1994) and retrofitted (between 1994 and 2003) in Scarborough... 27
Figure 3. Breakage analysis for pipe sub-group OT-1a... 28
Figure 4. Breakage analysis for pipe group OT-1b. ... 29
Figure 5. Breakage analysis for pooled data of pipe group OT-1b... 30
Figure 6. Breakage analysis for Group SC-1... 31
Figure 7. Breakage analysis for sub-group SC-3a ... 32
Figure 8. Breakage analysis for Group SC-3b... 33
Figure 9. Pooled break analysis for retrofitted pipes in Group SC-3b ... 34
Figure 10. Life cycle cost curve... 35
Figure 11. Life cycle cost for hot spot cathodic protection of pipes in Group OT-1a. ... 36
Figure 12. Life cycle cost for retrofit cathodic protection of pipes in Group OT-1b. ... 38
Figure 13. Pareto graph for planning scenarios for pipe group OT-1a from Ottawa. ... 40
Figure 14. Life cycle cost for hot spot cathodic protection of pipes in Group SC-3a... 41
Figure 15. Life cycle cost for retrofit cathodic protection of pipes in Group SC-3a. ... 42
Figure 16. Pareto graph for planning scenarios for pipe group SC-3a from Scarborough... 43
Table 1. Principal characteristics of homogenous data groups for breaks
on water mains from Ottawa and Scarborough. ... 23
Table 2. Summary of covariate coefficients for breakage analysis using WARP. ... 24
Table 3. Economic data for life cycle costs and planning analyses. ... 24
Table 4. Planning scenarios for Group OT-1a (208 km) from Ottawa. ... 25