Arsenic Contamination Study of
-Drinking Water in Nepal
by
Patricia M. Halsey
B.S. Agricultural and Biological Engineering
Cornell University, 1996
SUBMITTED TO THE DEPARTMENT OF CIVIL AND ENVIRONMENTAL
ENGINEERING IN PARTIAL FULFILLMENT OF THE REQUIREMENTS
FOR THE DEGREE OF
MASTER OF ENGINEERING
IN CIVIL AND ENVIRONMENTAL ENGINEERING
at the
MASSACHUSETTS INSTITUTE OF TECHNOLOGY
June 2000
© 2000 Patricia M. Halsey. All rights reserved.
The author hearby grants to MI T. permission to reproduce and distribute publicly paper and electronic copies of this thesis document in whole or in part.
Signature of the Author __________________
Patricia4v. Halsey Department of Civil and Environmental Engineering May 5, 2000 Certified by______________________________ Susan Murcott Lecturer Thesis Supervisor Accepted by Daniele Veneziano MASSACHUSETTS INSTITUTE Chairman, Departmental Committee on Graduate Studies
OF TECHNOLOGY
MAY 3 0 2000
- I . dAArsenic Contamination Study of Drinking Water in Nepal by
Patricia M. Halsey
Submitted to the Department of Civil and Environmental Engineering on May 5, 2000 In Partial Fulfillment of the Requirements for the Degree of
Master of Engineering in Civil and Environmental Engineering ABSTRACT
A study of arsenic contamination of drinking water in Nepal was conducted. Samples were collected in Nepal in January 2000 from tube wells, hand dug wells, natural springs, municipal systems and surface water bodies. Samples were analyzed in Nepal using EM Quant@ test strips and Affiniti Concentration kits. Samples were also preserved and brought back to the U.S. for analysis using Graphite Furnace Atomic Absorption Spectrometry. Combined results from these tests indicate that no arsenic contamination was found above the World Health Organization (WHO) maximum contaminant level of 10ppb in the Kathmandu Valley. However, 18% of samples taken from the Terai region of Nepal were above the WHO limit. Detectable levels of arsenic were found in tube wells ranging from approximately 30 to 300 feet deep. Forty-eight percent of samples taken from wells aged 9 to 12 years had detectable levels of arsenic. This study concludes that, although not as extensive as in neighboring West Bengal, India and Bangladesh, arsenic contamination does exist in the Terai region of Nepal. A comparison of analytical methods indicates that field kits provide a general indication of high levels of arsenic, but should be used in conjunction with more accurate methods if detailed results are required. Further testing is recommended in the Terai region of Nepal. A detailed study of the geology of the Terai region and potential anthropogenic sources is recommended to further characterize the area.
Thesis Supervisor: Susan Murcott Title: Lecturer
Acknowledgements
I would like to thank my advisor, Ms. Susan Murcott, for her support throughout this project. Her undying enthusiasm and vision culminated in the amazing experience of this project. I would also like to thank Dr. Eric Adams and the Department of Civil and Environmental Engineering for making this project and the entire school year so rewarding. Thanks to the Nepal Water Project team, including Andy Bittner, Amer Khayyat, Kim Luu, Benoit Maag, Junko Sagara, and Andrea Wolfe, for making the trip to Nepal and execution of this project an unforgettable experience. You all have unique and important gifts to offer the world, and I wish you all the luck in making your mark.
Special thanks go to several members of the Nepal community whose help made our stay most enjoyable. In particular, I would like to thank Mr. Ram Mani Sharma of the DWSS for his help in sample collection and keeping us safe in Parsa District. I would also like to thank Mangala Karanjit for making all of our arrangements, including our stay in Patan, possible.
I would like to thank Professor Harry Hemond for the use of his laboratory and GFAAS unit. This thesis would not have been completed without the guidance of several graduate students at the Ralph M. Parsons Laboratory at MIT. Nicole Keon, Dave Senn and Chris Swartz were a great help in teaching me about arsenic and GFAAS.
Finally, I would like to thank my family and friends for their unrelenting support throughout this year. I would like to dedicate this thesis to my loving parents, Ron and Mary Ann Halsey, whose love and encouragement have made me who I am today. To my siblings, Kathy, Brett and Kristin, thanks for cheering me on and making me laugh. I would like to express a final note of thanks to Jon. Your support and love have made this year amazing and I owe all of this to you. Oh yeah, and thanks for the fruit.
Arsenic Contamination Study ofDrinking Water in Nepal Table of Contents
Table of Contents
C H A PTER 1 - IN TR O D U CTIO N ... 10
1.1 N epal W ater Project ... 10
1.1.1 Project M otivation... 10
1.1.2 Project Purpose... 11
1.2 A rsenic Contam ination Study ... 12
1.2.1 Study M otivation... 13
1.2.2 Study Purpose... 13
C H A PTER 2 - BA C K G R O UN D ... 15
2.1 Arsenic in the Environm ent... 15
2.1.1 General Chem istry ... 15
2.1.2 Com m on Sources... 17
2.2 Arsenic Contam ination in Other Countries ... 19
2.2.1 Crisis in Bangladesh ... 20
2.2.2 Crisis in India... 23
2.2.3 Contam ination in the United States... 24
2.3 Overview of H ydrology and Geology of N epal ... 25
2.3.1 Geography and Geology ... 25
2.3.2 Typical W ater Sources... 27
CH A PTER 3 - H EA LTH EFFECTS ... 32
3.1 Toxicology of A rsenic Com pounds ... 32
3.1.1 Arsine... 32
3.1.2 Inorganic Arsenic ... 33
3.2 Exposure Lim its and H ealth Guidelines... 34
3.3 Sym ptom s of A rsenic Poisoning ... 35
3.3.1 Acute H ealth Effects ... 35
3.3.2 Chronic H ealth Effects ... 35
Arsenic Contamination Study ofDrinking Water in Nepal Table of Contents
CHAPTER 4 - ANALYTICAL M ETHODS ... 38
4.1 Possible Test M ethods... 38
4.2 EM Quant@ Test Strips ... 46
4.2.1 Theoretical Principles ... 46
4.2.2 Description ofProcedure Used... 47
4.3 Affiniti Concentration Kits... 50
4.3.1 Theoretical Principles ... 50
4.3.2 Description of Procedure Used ... 52
4.4 Graphite Furnace Atomic Absorption Spectrometry... 54
4.4.1 Theoretical Principles ... 54
4.4.2 Description of Procedure Used... 55
4.5 NIPSOM Field Test Kits ... 57
4.5.1 Theoretical Principles ... 57
4.5.2 Description of Procedure Used ... 58
CHAPTER 5 - RESULTS ... 59
5.1 Analytical Results Obtained by the Author... 60
5.1.1 EM Quant @ Test Kit Results ... 60
5.1.2 Affiniti Concentration Kit Results ... 61
5.1.3 Graphite Furnace Atomic Absorption Spectrometry Results ... 63
5.2 Analytical Results Obtained by DW SS... 64
5.3 Discussion of Results ... 66
5.4 Comparison of Analytical M ethods ... 69
CHAPTER 6 - CONCLUSIONS AND RECOMMENDATIONS... 71
6.1 Study Conclusions... 71
6.2 Recommendations ... 72
REFERENCES ... 73
APPENDIX A -TRIP REPORT ... 77
APPENDIX C -LIST OF ACRONYMS ... 123
Arsenic Contamination Study ofDrinking Water in Nepal List qf Tables
List of Tables
Table 3-1: Incidence Rates for Male Adults in Various Countries... Table 4-1: Possible Analytical Methods for Measurement of Arsenic in Potable Water... Table 4-2: Possible Chemical Interferences for EM Quant@ Test Kits ... Table 4-3: Procedure for using EM Quant@ Test Strips ... Table 4-4: Procedure for Using Stage II Affiniti Concentration Kits... Table 4-5: Procedure for Regeneration of Used Affiniti Concentration Kits... Table 4-6: Procedure for G FA A S Testing ... Table 5-1: EM Quant@ Test Kit Results ... Table 5-2: Affiniti Concentration Kit Results ... Table 5-3: Graphite Furnace Atomic Absorption Results ... Table 5-4: Summary of Results of DWSS Arsenic Sampling Program ... T able B -1: Sam ple D escriptions ... Table B-2: Test Results for EM Quant@ Test Strips and Affiniti Concentration Kits... T able B -3: G F A A S R esults ... 37 40 44 49 52 54 56 60 62 63 65 81 94 98
List of Figures
Figure 2-1: Eh - pH Diagram for Arsenic at 250C and One Atmosphere ... 16
Figure 2-2: Predominance Charts for Arsenite and Arsenate at Varying pH ... 17
Figure 2-3: Chemical Forms of Arsenic and Their Transformations in Soils. ... 18
Figure 2-4: A Simplified, Comprehensive Cycle Transfer of Arsenic ... 19
Figure 2-5: M ap of B angladesh ... 21
Figure 2-6: Map of Arsenic Contamination in Bangladesh... 22
Figure 2-7: Arsenic Contamination in West Bengal... 24
F igure 2-8: M ap of N ep al ... 26
Figure 2-9: Typical Hand Pump Tube Well ... 28
Figure 2-10: Typical Hand Dug Well... 29
Figure 2-11: Traditional Public Water Spout in Patan Durbar Square ... 30
Figure 2-12: Traditional Natural Spring Water Source ... 31
Figure 3-1: Conversion of Arsenite to Water Soluble DMAA ... 33
Figure 4-1: Experimental Set-up for EM Quant@ Test Strips... 48
Figure 4-2: Picture of EM Quant@ Test Strip Kit ... 49
Figure 4-3: Picture of Affiniti Concentration Kit Resins... 51
Figure 4-4: Experimental Set-up for Affiniti Concentration Kits... 53
Figure 5-1: Locations of Sampling Areas... 59
Figure 5-2: Em Q uant@ Test Strip Results... 61
Figure 5-3: Affiniti Concentration Kit Results ... 62
Figure 5-4: G FA A S R esults... 64
Figure 5-5: NIPSOM Test Results Obtained by DWSS ... 65
Figure 5-6: Sampling Locations in the Kathmandu Valley ... 67
Figure 5-7: Sample Frequency by Well Depth ... 68
Figure 5-8: Sample Frequency by Well Age ... 69
Figure B-1: Calibration Curve for Sample Group 1 ... 104
Figure B-2: Calibration Curve for Sample Group 2 ... 105
Figure B-3: Calibration Curve for Sample Group 3 ... 106
Figure B-4: Calibration Curve for Sample Group 4 ... 107
List of Figures Arsenic Contamination Study of Drinking Water in Nepal
Arsenic Contamination Study ofDrinking Water in Nepal
Figure B-5: Calibration Curve for Sample Group 5 Figure B-6: Calibration Curve for Sample Group 6 Figure B-7: Calibration Curve for Sample Group 7 Figure B-8: Calibration Curve for Sample Group 8 Figure B-9: Calibration Curve for Sample Group 9 Figure B-10: Calibration Curve for Sample Group Figure B-i 1: Calibration Curve for Sample Group Figure B-12: Calibration Curve for Sample Group Figure B-13: Calibration Curve for Sample Group Figure B-14: Calibration Curve for Sample Group Figure B-15: Calibration Curve for Sample Group Figure B-16: Calibration Curve for Sample Group Figure B-17: Calibration Curve for Sample Group Figure B-19: Calibration Curve for Sample Group
... ... ... ... ... 1 0 ... 1 1 ... 1 2 ... 1 3 ... 14 ... 15 ... 16 ... 17 ... 19 ... 108 109 110 111 112 113 114 115 116 117 118 119 120 122 List of Figures
Chapter
1
- Introduction1.1 Nepal Water Project
The Nepal Water Project is a collective effort by seven Master of Engineering students at the Massachusetts Institute of Technology (MIT) to document and analyze several water quality and household water treatment issues in the country of Nepal. The study has been completed as part of the degree requirements for the Master of Engineering program, and each student has completed an individual thesis and collaborated to produce a group report. The advisor for the project is Susan Murcott, and Nepalese hosts and partners in this effort include the Royal Government of Nepal Department of Water Supply and Sewerage (DWSS), the Business and Professional Women's Federation of Nepal, the Nepal Water Supply Corporation (NWSC) and the local chapter of the United Nations Childrens Fund (UNICEF-Nepal).
The project advisor, Susan Murcott, initiated the Nepal Water Project. Ms. Murcott was involved in a Women and Water Conference held in Kathmandu, Nepal in 1998. During this conference, the water quality issues plaguing the country became evident and real to her. This sparked the beginning of the Master of Engineering program project in Nepal. The project involved a myriad of research topics all relating to water quality issues, and included a three-week field trip to the country. This thesis is one of the products of the study efforts, and is submitted as a portion of the overall goal of the project.
1.1.1 Project Motivation
Nepal is a developing country bordered by India to the south, east and west and China to the north. More than half of the Nepalese population lives below the international poverty line, making it the seventh poorest nation in the world. The average yearly income for a Nepalese person is only $210, and many rural communities live within a subsistence economy.1 Like many other countries with limited economic means, serious health and sanitation concerns in Nepal stem from over-population of areas with limited available natural resources.
1U.S. Agency for International Development, 2000.
Introduction Arsenic Contamination Study ofDrinking Water in Nepal
Of the many health issues that plague the country, none is more important than the prevalence of waterborne illness. Seventy percent of the population does not have access to clean, safe
23
drinking water. According to UNICEF, one in ten children die before the age of five and many of these deaths are associated with water-borne illnesses. Of those children who do survive, 67% have stunted growth due to the loss of essential nutrients during illnesses.4
The serious health problems associated with poor drinking water quality have provided the motivation to undertake this study. Information documenting drinking water quality and both municipal and household treatment techniques in Nepal was relatively unknown to team members prior to initiation of this project. This study was initiated because of the seriousness of health problems in Nepal and the lack of true scientific data about them.
1.1.2 Project Purpose
The Nepal Water Project has two main objectives. First, is to quantify water quality issues with specific data and analysis and add to the minimal body of water quality data available. Second, is to make recommendations about acceptable point-of-use treatment systems for implementation in Nepalese households, based on effectiveness and cultural acceptance. These two initiatives are discussed in more detail below.
The water quality analysis portion of the project is divided into three specific studies. The first of these is a microbiological and turbidity study. The purpose of this study is to measure the levels of microbial pathogens and turbidity from a wide range of Nepalese drinking water samples. This study also includes an analysis of the water quality in the Bagmati River, a central water body that flows through the heart of Kathmandu, the nation's capital. A second study involves an analysis of nitrate and ammonia contamination in drinking water. Contamination with high levels of nitrate can result in serious adverse health effects in infants, and is usually the result of agricultural run-off and leaking septic systems. Although there is no standard for safe drinking water levels of ammonia concentration, this parameter is an indicator for microbial
2 Water Resources Institute, 2000. 3 United Nations Childrens Fund, 2000. 4 Murcott, Susan, 1999.
pathogens. The third water quality study, which provides the basis for this thesis, is an analysis of arsenic contamination in Nepalese drinking water. As discussed in later chapters of this document, arsenic contamination is a severe issue in the neighboring countries of India and Bangladesh. Exposure to arsenic can cause various health effects including acute disorders of the skin and chronic diseases such as cancer.
The point-of-use treatment portion of the project can also be divided into four specific studies. The first of these involved an analysis of the use of coagulation and settling techniques for removal of microbial pathogens and turbidity. This study also made recommendations for this treatment option based on efficacy and acceptability at the household level. The second study focused on filtration. It involved the analysis of several filters, made both locally and in foreign countries, for ability to remove microbial pathogens and turbidity. The study made recommendations based on an analysis of the acceptability of filtration as a treatment option based on interviews with local communities and villagers. A third study analyzed three disinfection options: solar, chlorination and ultraviolet. This study made recommendations based on efficiency of removal of microbial pathogens and acceptability by local villagers. A final study involved an economics and logistics study on the distribution and availability of various filters. This was undertaken in conjunction with the filtration study described above.
1.2 Arsenic Contamination Study
The arsenic contamination study of the Nepal Water Project is the focal point of this thesis. By prior arrangement during the fall of 1999, this MIT thesis study has become a small portion of a larger initiative in the country of Nepal. In 1999, the DWSS, in conjunction with UNICEF-Nepal, commenced a lengthy sampling program that will be used to assess the existence and extent of arsenic contamination in Nepalese drinking water. Other international agencies have also implemented sampling programs to test wells in Nepal for arsenic. These sampling programs have mainly focused on testing in the Terai, or southern, region of Nepal.
All of these organizations have been helpful in formulating and executing the sampling program for the purpose of this study. All have been more then generous in sharing their information with Introduction Arsenic Contamination Study ofDrinking Water in Nepal
the Nepal Water Project team, and the information presented in this document will be provided to them in an ongoing effort to collaborate on this important water quality issue.
1.2.1 Study Motivation
Arsenic contamination in drinking water has caused a recent health crisis in West Bengal, India and Bangladesh. The installation of tube wells in an effort to provide drinking water free of microbial pathogens has resulted in widespread arsenic poisoning of people living in these areas. The arsenic contamination in these countries is considered to be of natural origin. Naturally occurring arsenic bound to solid substrates in the subsurface is believed to have been deposited through natural processes in the region. Because of the proximity of Nepal to these affected areas, and the similarity in hydrology and geology of the region, the possibility of arsenic contamination in Nepalese drinking water seemed quite possible. Prior to initiation of this study, little was known about arsenic contamination in Nepal. Even the DWSS sampling program began only after this study was proposed. Because of the potential for arsenic contamination in Nepal and the lack of sufficient data on the subject, this study was initiated as part of the Nepal
Water Project.
1.2.2 Study Purpose
There are three goals associated with this study. The first and most important goal for this study is to assess the level of arsenic contamination in Nepalese drinking water. Because the amount of time for sampling in Nepal was limited, the study focused on collecting and testing samples from two districts in the Terai and several sources in the Kathmandu Valley. This study also provides an analysis of several samples collected by an international agency from a third district in the Terai. Data from the DWSS sampling effort is also presented to provide the most complete picture of the state of arsenic contamination as it is known at this time.
A second goal for this study is to provide an analysis of analytical testing methods. Three methods were used for this study, and the data of a fourth method has also been provided. This study performs a comparison of the relative accuracy of each method used and discusses the advantages and disadvantages associated with them. Whenever data was crosschecked between
the methods used in this and other studies, those results are provided to give better information on the accuracy of the tests used.
A final goal of this study is to present recommendations for future testing and monitoring in Nepal. Based on the data collected and analyzed by this author, and on that received from other organizations, suggestions are made as to which areas require further testing, and which areas should be monitored continually for contamination.
Introduction Arsenic Contamination Study ofDrinking Water in Nepal
Chapter 2 - Background
This chapter provides the background necessary to understand the purpose and motivation for the study. It provides basic information about arsenic in the environment, including its chemistry, an overview of arsenic contamination around the world, a description of the hydrology and geology of Nepal, and finally a description of typical water sources found in Nepal.
2.1 Arsenic in the Environment
Arsenic occurs in the environment in several forms, and possesses a unique chemistry. A thorough discussion of the complex chemistry associated with this element is beyond the scope of this paper. However, basic information about the element and its forms that are of most concern in aqueous environments is presented. A discussion of its common sources in the
environment, both natural and anthropogenic, is also provided.
2.1.1 General Chemistry
Arsenic is a highly toxic metalloid that is brittle, crystalline, odorless and tasteless in its elemental form.5 Arsenic is commonly used in glass making and termite control, as a pesticide
and herbicide, and in timber preservation, fertilization, wallpaper and ceramics.6 As a heavy
metal, it is stable in the -III, 0, +111, and +V oxidation states.7 It forms several inorganic and organic compounds, and is commonly found in the environment.
The most common species of arsenic found in aqueous environments are arsenite (H3AsO3),
arsenate (H3AsO4), monomethylarsonic acid (MMAA), and dimethylarsonic acid (DMAA). The
most important species with relevance to toxicity in humans are arsenite and arsenate. These two species, therefore, are of most concern to this study. The analytical methods discussed in later chapters are based on measurement of these two species in water samples to determine total arsenic present. Information collected did not focus on speciation because this study is only concerned with determining the presence and extent of total arsenic in Nepalese drinking water.
5 WebElements, 1999.
6 Total Environment Centre, 1999.
Arsenic Contamination Study of Drinking Water in Nepal
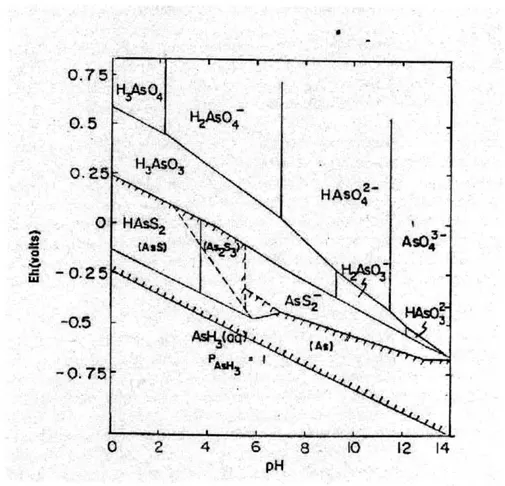
Factors such as pH and oxidation/reduction environments can drastically affect the state of arsenic in the subsurface. Figure 2-1 shows a plot of the complicated chemistry behind arsenic speciation in different environments. The Eh-pH diagram is for arsenic at 25C and one
atmosphere with total arsenic 10-5 mol/L and total sulfur 10- mol/L. From the plot, it can be
seen that several different species of arsenic can be present in a sample based on environmental conditions and other chemicals present. Figure 2-1 also shows that arsenic can exist in both solid and aqueous states, depending on the conditions.
0.7 0.5
0.2
0 III -0.5 -0.75 0 2 4 6 8 10 12 14 pHFigure 2-1: Eh - pH Diagram for Arsenic at 25"C and One Atmosphere
[With total arsenic 10-5 mol/L and total sulfur 10-3 mol/L. Solid species are enclosed in
parenthesis in crosshatched area, which indicates solubility less then 10~53 mol/L.] 8
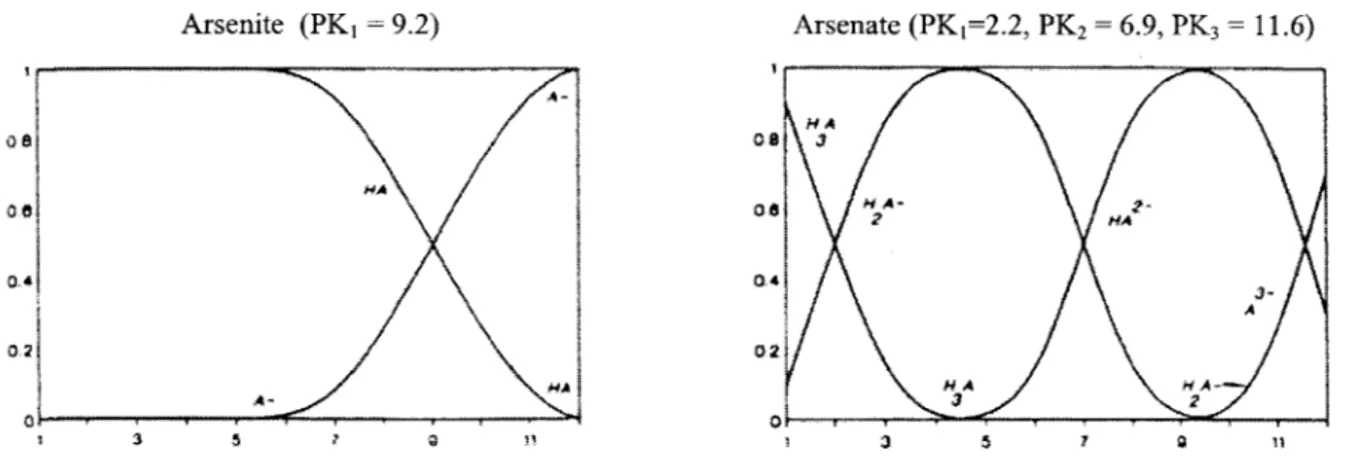
Figure 2-2 shows the predominance plot for arsenate. This plot shows the variety of species that can be present depending on environmental conditions. It can be noted from the graph that at a
7 Stanley, Rachel, 1998.
8 Ferguson, John F., and Jerome Gavis, 1972.
pH of 4, for example, arsenate is negatively charged. However, at that same pH, arsenite, is not charged. This demonstrates that depending on the pH, different species will have different charges. This fact becomes the underlying principle for many separation techniques used to determine speciation. This is important for both analytical testing methods that attempt to separate species and remediation techniques that use ion exchange for separation and treatment. This is also important in assessing subsurface chemistry, because the charge on a species may cause different interactions in the subsurface. Arsenate, for example, is relatively immobile in the subsurface because it tends to sorb onto positively charged particles, such as iron hydroxides. Changes in redox conditions, such as reduction of metal oxides, may enhance the mobility of arsenic. However, in a more reducing sulfidic environment, arsenite may precipitate as arsenic sulfide minerals. Arsenite (PK1 = 9.2) Arsenate (PK1=2.2, PK2 = 6.9, PK3 = 11.6) M A MA M-H 0I 0 Ana 02~ 02 MA NANA A- 3 2 1 3 5 7 111 71 a
Figure 2-2: Predominance Charts for Arsenite and Arsenate at Varying pH9
2.1.2 Common Sources
In soils, arsenic occurs both naturally and as a result of human influences. Arsenic can be naturally derived from several parent materials in soil, including magmatic sulfides and iron ores. The most important arsenic ores are the arsenopyrites, which are often present in sulfide ores. Human influences that can result in a build-up of arsenic include the use of arsenical
9 Korte, N.E. and Q. Fernando, 1991.
pesticides, the application of certain fertilizers, irrigation, dust from the burning of fossil fuels, and disposal of industrial and animal wastes.10
Species of arsenic can also be found naturally in aquatic environments. Both in surface waters and groundwater, species of arsenic such as arsenite, arsenate, MMAA and DMAA are most commonly found. Chemical forms of arsenic in both aqueous and soil environments can cycle through the two mediums depending on the surrounding conditions. Figure 2-310 shows a diagram representing the various chemical forms of arsenic in aquatic environments and their transformations in soils. Arsenate HAsO 2- pH 8-9 H A H a 67 reduction 4 110 Arsenite AsO ; 4 oxidation 2-+ S + Fe adsorp. As2 pptn. reduction pptn. bacteria Methyl Dimethyl
arsonic acid arsinic acid
OH3 OH3 | bacteria HO-As-OH * HO-As- OH / : Cacodylic acid bacteria fungiJ oxidation oxidation As2S 3 FeAsO 4 CH 3 CH 3-As-CH 3
Figure 2-3: Chemical Forms of Arsenic and
Dimethyl arsine Trimethyl arsine (volatile, v. toxic) (volatile, v.toxic)
Their Transformations in Soils.
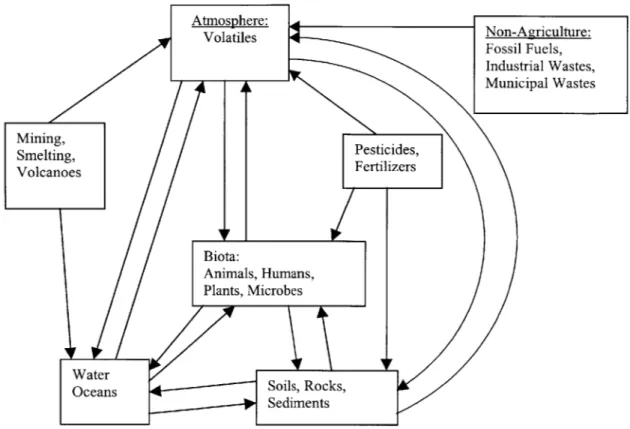
The cycle of arsenic through the environment is quite intricate because of the various forms of arsenic occurrence in different media. However, a simplified cycle that is useful in depicting the typical pathways of arsenic in the environment is presented in Figure 2-414. This figure shows multiple potentials for human exposure from different environmental pathways. According to the figure, humans can be exposed through direct contact with water, soil, pesticides, and the
2
CH
3 H-As-CH
3
10 Blumba, D.K. and R.F. Keefer, 1994.
atmosphere. Although this may seem obvious, it is important to note that all of these pathways present serious dangers based on the toxicity of arsenic. The toxic nature of arsenic is discussed at greater length in the next chapter.
Figure 2-4: A Simplified, Comprehensive Cycle Transfer of Arsenic
2.2 Arsenic Contamination in Other Countries
The impetus for this study stems from ongoing crises in other countries. Two of the largest and most widespread cases of arsenic contamination occur in neighboring countries to Nepal. Both Bangladesh and India have experienced extensive arsenic contamination in their drinking water and subsequent adverse health effects. Details of each of these cases are provided in the following sections. Also included in this section is a discussion of arsenic contamination in the U.S. Several states in the U.S. are home to some of the highest levels of arsenic in the world,
and although this contamination has not led to adverse health effects because of detection, treatment and/or provision of alternate water supply, they are worth noting for adequate representation of known arsenic contamination around the world.
2.2.1 Crisis in Bangladesh
The concern over arsenic contamination in Nepalese drinking water was initiated by the recent crisis in neighboring Bangladesh. After the installation of over 4 million tube wells in Bangladesh, a widespread occurrence of arsenic poisoning has plagued the country. According to the United Nations Development Programme, approximately 20 million people are thought to be exposed to arsenic poisoning, and another 50 million are considered to be at risk." Measurements performed by several scientists indicate that the amount of arsenic in the wells varies greatly, and that levels higher than 50 ppb are common.'2 Levels as high as 2,000 ppb
have been reported. Many wells exceed the World Health Organization (WHO) drinking water standard of 10 ppb.13
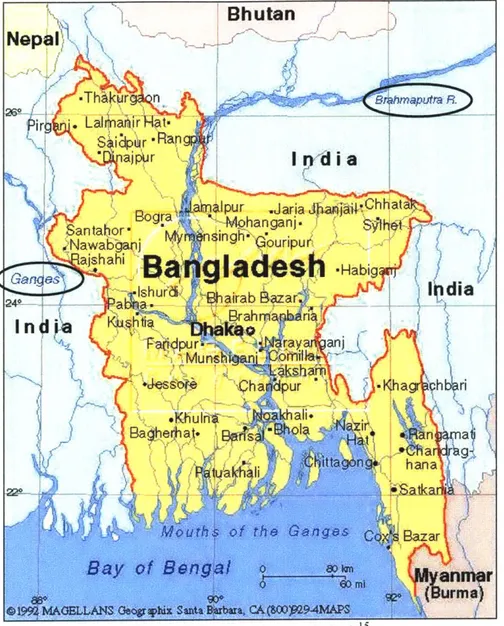
According to the West Bengal & Bangladesh Arsenic Crisis Information Centre, the geology of Bangladesh consists mainly of thick alluvial and deltaic sediments.14 These sediments consist of
sandy and silty materials, characterized by a high hydraulic conductivity. The areas of alluvial deposition can be further divided into two main distinctions. The terrace area includes geologic materials that are estimated to be as much as one million years old. The floodplain areas, which lie mainly in the Ganges, Brahmaputra, Tista and Meghna river basins, consist of, on a geological time scale, much younger deposits. Arsenic sampling and testing in Bangladesh has revealed that much of the arsenic has been found in these floodplain areas. Figure 2-5 provides a map of the area, and the location of the river systems in Bangladesh.
" United Nations Development Programme, 1999.
12 Harvard University, "Arsenic Project." 1999.
" World Health Organization, "Arsenic in Drinking Water." 2000.
14 West Bengal & Bangladesh Arsenic Crisis Information Centre, 1999.
Arsenic Contamination Study of Drinking Water in Nepal Background
Figure 2-5: Map of Bangladesh"
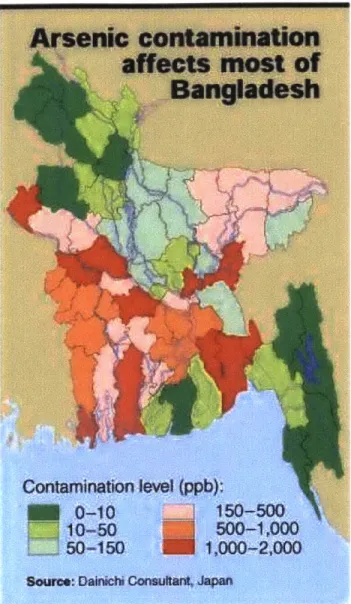
Figure 2-6 shows the extent of arsenic contamination in Bangladesh. From the map, it can be seen that the majority of the contamination is located along the Ganges and Brahmaputra River floodplains. Maximum concentrations in the floodplains range from 1000 to 2000 ppb. This area is characterized as widespread alluvial deposits of high hydraulic conductivity. The arsenic below the surface is believed to be of natural origin, and at least two schools of thought exist about the probable sources of the contaminant. One theory is that a large-scale geologic event resulted in mass deposition of the arsenic thousands of years ago. It is believed that fine-grained clays and iron oxides coagulated when the rivers that were carrying them came in contact with
15 Harvard University, "Bangladesh." 2000.
Background Arsenic Contamination Study of Drinking Water in Nepal
Arsenic Contamination Study of Drinking Water in Nepal Background
Figure 2-6: Map of Arsenic Contamination in Bangladesh'6
the saline waters of the Bay of Bengal. This is thought to have resulted in the mass deposition of fine-grained sediment suspected of being the source of arsenic. The arsenic is believed to have been deposited in the floodplains after transport through the river systems from a naturally occurring source in hard rock outcrops further upstream. A second school of thought is based on the hydrology and topography of the area. The upstream Himalayas of Nepal could be the cause of massive groundwater discharge in the lowlands of Bangladesh. Because of this, water passes through surface sediments and accumulates arsenic concentrations. The highly fluctuating water table caused by monsoonal rains characteristic of the area provides the dynamic subsurface environment that would be needed to have arsenic concentrations build up. Both schools of
16 Dainichi Consultant, 2000.
Background Arsenic Contamination Study of Drinking Water in Nepal
Arsenic Contamination Study ofDrinking Water in Nepal
thought accept the hypothesis that the arsenic is of natural origin. Based on either of these theories, it seemed plausible that arsenic contamination could exist in groundwater drinking sources in Nepal.
The situation in Bangladesh is dire, and numerous non-governmental, academic and governmental organizations are working to find solutions to the problem. Some have suggested returning to the highly polluted surface water sources. This, however, would cause another increase in mortality due to microbial pathogen intake. Other options include implementing various treatment techniques, such as carbon adsorption, or installing deeper tube wells to extract water that is out of the arsenic contaminated zone. All of these options, however, require further analysis, and for the time being, wells that have been tested and are known to be of high arsenic concentration have been painted red and the villagers have been told not to drink them. Unfortunately, some villagers are still drinking from red-painted wells, simply because there is no other convenient water supply.
2.2.2 Crisis in India
Similar to the situation in Bangladesh, severe arsenic contamination has been discovered in India. Particularly, groundwater in areas of West Bengal has been discovered to contain some of the highest levels of arsenic in the world. According to the World Health Organization, six eastern districts in West Bengal, India are contaminated with arsenic levels ranging from 60 ppb to 1,860 ppb.17 The arsenic is believed to be of the same general origin as that found in
Bangladesh. The location of West Bengal relative to Bangladesh and Nepal and the contaminated regions within it are shown in Figure 2-7. This area's hydrology is dominated by the Genges and Brahmaputra Rivers. The large alluvial deposits of West Bengal contain arsenic. The many river systems of the Himalayas, some of which flow through Nepal, are intricately involved in the transport of arsenic in the area, and for these reasons, the hypothesis that there could be arsenic contamination in Nepal seemed justifiable.
17 World Health Organization, "Arsenic in Drinking Water and Resulting Arsenic Toxicity in India and Bangladesh:
Recommendations for Action." 2000.
Arsenic Contamination Study of Drinking Water in Nepal Background
.- ,f; 1~MAKNUL S V7) AARfCAT IN
~~'1
U XGQ~c&IATDy a" PURImZWALVI JI4)O" (&I, K4u4lHAZ I
DIA~ ML 3EVDX-(ZEaJ (4 KAILCHAJK1
SDA
k'ANGOLA
Rx Ot"2*I
~2I (e2) "B"JAN
DE$ IUARAAn (41) 3A1IAU~f 114) 31AWUUmL (M) DORAL
~~~~X JA~A T-h ff (51) 1{AVII ik~ O
0:01 AAaA&SA 04 BXL-(iAAYJ1ULXDL
111MSJA 3 umA3ALT]
010 JAN PAR )WP5AK3
I--tax.7060 ILUA4.A fYO R4A41kA
Clio AAJLAQ L4 OtjI)) A
E S3 N j~4*~ it* 11CLMAR on D=,
§L
M.*IAI1 tw) CMjk A
"Mg
KuuFnf T (fin KftISMAXAIIJ I WK ps(2) 1ArUIKr n] (6b) K1]D LJrAx IT
*Blocks whets amsnic in proundvaor found ab~ove 0.O05 mof Figure 2-7: Arsenic Contamination in West Bengal
r-2.2.3 Contamination in the United States
Arsenic concentrations above the safe drinking water limit imposed by the U.S. Environmental Protection Agency (USEPA) have been found within the United States. Several states, including Nevada, Arizona, California, Wisconsin, Michigan, Utah, New Hampshire and Maine, have been reported to have concentrations as high as 180 ppb. The source of much of the contamination is
Arsenic Contamination Study ofDrinking Water in Nepal
believed to be of natural origin and not of anthropogenic origin.19 The sources are either currently being treated or have been abandoned for arsenic-free options. The arsenic contamination in the U.S. has fortunately not resulted in poisoning of the population as in Bangladesh and West Bengal. It is interesting to note, though, that arsenic has been found around the world in the subsurface, and consequently is a potential problem for many countries around the globe.
2.3 Overview of Hydrology and Geology of Nepal
2.3.1 Geography and Geology
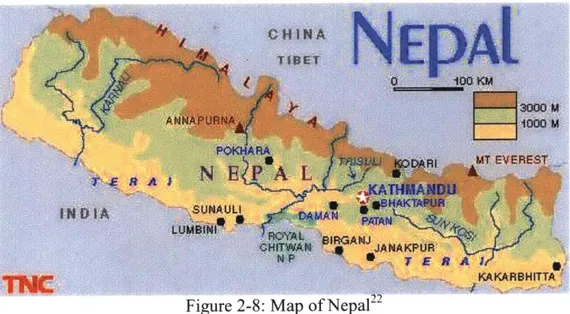
The geology of Nepal is a complex system centered around the great elevation change from the top of the Himalayas to the flatlands of the Terai. The upper Himalayas form a massive mountain terrain that stretches the northern length of the country bordering China. The mountains in this area are famous, home to the highest peak in the world, Mount Everest (elevation 8,848 m 20), and the greatest number of high peaks in any mountain range.2 1 This
range of mountains dramatically dictates the climate and hydrology of Nepal. Figure 2-8 shows the topography and some of the surface hydrology in Nepal. Extensive systems of rivers flow down all sides of the mountains. Some flow through Nepal and into India and Bangladesh, whereas others flow through China. Of note are two major rivers that originate in the mountains. The Kosi River drains out through eastern Nepal and feeds into the vast Ganges River in India before it flows into the Bay of Bengal. Waters of the Kosi originate in the Himalayas and join to form the Kosi River system in eastern Nepal. This is the biggest river, according to C.K. Sharma21, with affluent catchment areas totaling approximately 62,000 square kilometers and annual sediments of 118 million cubic meters. Another major river originating in this mountain system in China is the Bhramaputra, which flows through China and the West Bengal portion of India into Bangladesh. Both of these rivers, along with the multitude of minor rivers that originate in the mountains, have massive deposition associated with their flow patterns. The high velocities achieved while the rivers flow down the steep mountains allow for massive transport of sediments along the way. When the river velocities decrease as they reach lower
19 Peters, Stephen C., et al., 1999.
20 Central Intelligence Agency. 2000.
elevations, suspended sediments in the water are deposited in massive quantities. These river systems, therefore, dictate a good deal of the geology in the lower lands of the country.
M9.j~jUT EVEREST
74a
i
N E PA L
Figure 2-8: Map of NepalA
The foothills of the mountains give rise to highly industrialized areas in the middle latitudes of Nepal. This region is home to the Kathmandu Valley, which is one of the most densely populated regions of the country. The relatively industrialized cities of Patan, Kathmandu and Bhaktapur in the Kathmandu Valley contain many industries, businesses and personal residences. The hydrology in this region is mainly dominated by the Bagmati River, which flows through the heart of the valley. The drainage area of this river is 2,720 square kilometers, and it has an average discharge of 161.6 m3/s.2
1 This valley region was once a lake, and sediments of the nearby hills and plant material were deposited as it dried up. Soils in the valley today consist of highly fertile black clay. Outside the valley in the foothills, soils tend to be sandy and less fertile.
The low plains area to the south of Nepal is called the Terai region. It extends from west to east along the southern border with India. The region is characterized as flat plains and farmland. Also, heavy agricultural use occurs in the area. It is densely populated, mainly with agricultural communities and scattered industrial complexes. The climate in the area is tropical, with high temperatures and humidity throughout the year. During the monsoon season, this region, along 21 Sharma, Chandra K., 1977.
22 Travel-Nepal.com, 2000.
Background Arsenic Contamination Study of Drinking Water in Nepal
with the foothills, receives extensive amounts of rainfall (average annual precipitation in Kathmandu is 90 inches2 3). Many of the river systems that originate in the mountains and foothills to the north flow through these flatlands and into India. The geology of the region is characterized in general as alluvial deposits. The subsurface consists of a layer approximately
5,000 feet thick of alluvium.2 1 The soils of the Terai contain a large amount of iron oxides, which result in iron contamination in the groundwater.2'
2.3.2 Typical Water Sources
Water samples were taken from a wide range of sources. Descriptions of the sources are provided below, along with an explanation of where these sources are typically used for drinking water:
e Tube Wells: Tube wells are hollow pipes, typically of steel or polyvinyl chloride, which are
driven into the ground. Typical depths of tube wells sampled in this study ranged from
30-300 feet below the surface. Tube wells extract groundwater from the subsurface by the use
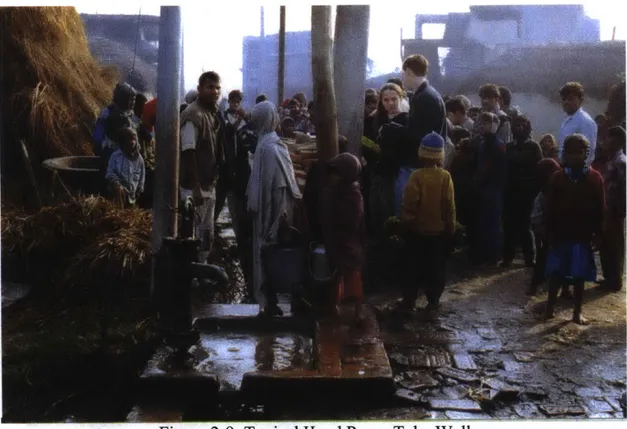
of a pump. In the Terai regions of Nepal, hand pumps are commonly used to extract the water. Figure 2-9 shows a typical hand pump tube well located in the Terai region. The majority of the samples taken from the Terai region were from tube wells similar to the one
shown.
23 Nepal.com, 2000.
Background Arsenic Contamination Study ofDrinking Water in Nepal
Arsenic Contamination Study of Drinking Water in Nepal Background
Figure 2-9: Typical Hand Pump Tube Well
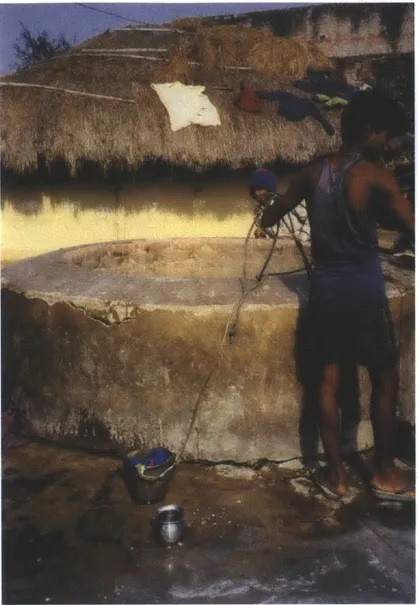
* Hand Dug Wells: Hand dug wells are those that are literally dug by hand. These are typically much shallower than tube wells, and are larger in diameter. Water is usually extracted from the wells by lowering a bucket into the well. Figure 2-10 shows a hand dug well in Nepal. Only a small number of the samples taken in Nepal were from hand dug wells.
Background Arsenic Contamination Study of Drinking Water in Nepal
Arsenic Contamination Study of Drinking Water in Nepal Background
Figure 2-10: Typical Hand Dug Well
e Municipally Supplied Water: In many areas of the Kathmandu Valley, municipally supplied water systems are prevalent, providing approximately 58% of the water in Kathmandu. These systems may be simple collection and re-distribution systems, or may include one, if not more, stages of water treatment. Some of the treatment facilities found in the Kathmandu Valley have collection, aeration, coagulation, filtration, chlorination and distribution components. In most cases, the treated water is distributed to public taps that are turned on twice a day for collection. Often several households and commercial establishments use these taps as their sole water source. A portion of the samples taken from the Kathmandu
2 4
United Nations Development Programme, 1998.
Background Arsenic Contamination Study of Drinking Water in Nepal
Valley for the purposes of this study were from various points in these distribution/treatment systems.
Figure 2-11: Traditional Public Water Spout in Patan Durbar Square
e Natural Springs: In large urban centers, natural spring water is often pumped to traditional
public water spouts (also known as traditional stone taps) which are used for bathing, washing and occasionally drinking. Figure 2-11 shows a typical public water spout in the heart of the Kathmandu Valley. Natural spring sources are also used as traditional water sources in rural areas of Nepal. These are often hand dug springs that contain natural groundwater. Figure 2-12 shows a woman retrieving water from such a source. It is interesting to note that this woman, when asked why she did not drink the municipally supplied, treated water located a few feet from this spring, stated that she preferred this source because her family has been drinking it for generations and because she did not trust the treated water. This is true of many people who prefer traditional water sources in Nepal.
" Surface Water: Less frequently, surface water is used as a direct source of water for rural communities. In general, surface water in Nepal is highly polluted, particularly in urban centers of the Kathmandu Valley. The Bagmati River is the main surface water source that Background Arsenic Contamination Study of Drinking Water in Nepal
Arsenic Contamination Study of Drinking Water in Nepal
runs through the Kathmandu Valley. This river is used as a sewer, a garbage repository, and a bathing area. No surface water samples were tested for the purpose of this arsenic study25, but it should be noted that surface water does serve as a source for drinking water.
igure 2-12: Iraclitional Natural Sprmg
25 Wolfe, Andrea N.C., 2000.
Arsenic Contamination Study ofDrinking Water in Nepal
Chapter 3 - Health Effects
Arsenic has long been known as a poison, and its effects on health even at small doses can be quite devastating. The recent crises in India and Bangladesh give frightening testament to the far-reaching, chronic effects of arsenic poisoning. This chapter provides an outline of the health effects of arsenic poisoning, both acute and chronic, and provides background information on the current state of regulations concerning tolerable thresholds and safe drinking water limits in the environment. An epidemiological analysis of current health problems in Nepal is also provided. 3.1 Toxicology of Arsenic Compounds
Arsenic can enter the body through the three main pathways to exposure: inhalation, ingestion, and absorption. Arsenic can also be passed from a pregnant woman to her unborn child. In various different forms, the chemical can be toxic to humans. This section provides a brief overview of the toxicological principles behind arsenic chemistry in the body. Information is provided on arsine gas (AsH3), a common inhalation hazard, and inorganic arsenic compounds
that are normally ingested in food and contaminated water.
3.1.1 Arsine
Arsine gas (AsH3) is classified as an extremely toxic chemical. It is a Class A, flammable poison
with a threshold limit value of 50ppb.2 6 Because it is a gas, arsine poses an inhalation hazard.
When arsine enters the lungs from the outside environment, it travels directly to the alveoli in the
lungs where it freely diffuses into the bloodstream and finally into the red blood cells. Once in these cells, water hydrolyzes the arsine to form arsenous acid (As(OH)3). This compound is
extremely nucleophilic, and reacts with the thiol groups of hemoglobin, DNA and cell membrane enzymes. These reactions cause the cell to erupt and die. An individual receiving large doses of arsine gas will become dizzy, experience central nervous system malfunction, abdominal pain, and liver and kidney dysfunction. Ultimately, heart failure and/or renal dysfunction cause death.
26 Massachusetts Institute of Technology, 2000.
Arsenic Contamination Study ofDrinking Water in Nepal 3.1.2 Inorganic Arsenic
Inorganic arsenic is also extremely toxic. Various forms of inorganic arsenic can enter the body when contaminated food and water are ingested. When, for example, arsenite enters the body from the outside environment, it is converted by the enzyme arsenic methyl transferase to a water soluble form that can be excreted in the urine. The arsenite ion, however, has a high affinity for thiol groups. If the toxin is in the body for a long enough time or a high enough dosage, the arsenite can bind to thiol groups before it has a chance to be converted by the transferase enzyme to a safe form. Arsenite particularly binds to the many thiol groups found on common enzymes. The arsenite blocks the active sites of these enzymes, thereby disabling them. This process can result in eventual death if enough enzymes are affected.
HO\ /0 As OH Arsenite Enzyme: 0 Arsenic Methyl Transferase PO CH3 - As - 0-CH3 DMAA (water soluble)
+
Typical Enzyme with Active SiteTypical Enzyme made inactive by Arsenite
Figure 3-1: Conversion of Arsenite to Water Soluble DMAA
An example of the chemical interactions of arsenite in the body is shown in the molecular diagrams provided in Figure 3-1. Arsenite is converted by arsenic methyl transferase to water soluble DMAA. Figure 3-1 also shows that if arsenite is in the body so that significant time must pass before all of the toxin is converted, arsenite becomes bound to the active site of a typical enzyme and therefore shuts down the function of the enzyme. If enough arsenite is introduced Health Effects
Arsenic Contamination Study ofDrinking Water in Nepal
into the body, toxic effects result. This is just one example of the many deleterious outcomes of arsenic exposure to humans.
3.2 Exposure Limits and Health Guidelines
Several limits have been placed on human exposure to arsenic based on the believed toxicity of arsenic. For example, arsine gas is extremely toxic to humans, and an exposure of 20 to 50 ppm for 30 minutes is reported to be lethal.27 The Reference Concentration for arsine gas is 0.00005
27
mg/m3. The USEPA has established a Reference Dose of 0.0003 mg/kg/d for inorganic arsenic.27 Because of the use of this compound in industrial applications, the Occupational Safety and Health Administration has established standards designed to protect workers from occupational exposure to inorganic arsenic.28
For aqueous arsenic species (mainly arsenite and arsenate), the standards have been set based on what is believed to be an allowable level of arsenic intake over time. The WHO has set the international drinking water guideline for arsenic at 10 ppb. This is a strict standard due to the high toxicity associated with this chemical.
On a country by country basis, drinking water guidelines vary based on different regulations and governments. According to the Code of Federal Regulations, the maximum contaminant level for arsenic in the U.S. is currently 50 ppb.2 9
This less stringent standard is due to the fact that some of the highest levels of arsenic in the world have been found in U.S. groundwater and it is expensive to treat or provide alternate water supplies. The USEPA, however, is currently reviewing the drinking water standard for arsenic. A final ruling on the drinking water standard for arsenic is scheduled to be released by the USEPA on January 1, 2001. Similarly, countries currently plagued with arsenic contamination, including India and Bangladesh, have adopted standards of 50ppb in conjunction with several international organization standards. Although this is a higher allowable concentration than the WHO limit, it is considerably less than the levels of arsenic that are being found in those countries. There are currently no drinking water
27 U.S. Environmental Protection Agency, "Arsenic and Compounds." 2000. 28 Occupational Safety & Health Administration, 2000.
2 9
40 CFR 141.11
standards for any water quality parameters in Nepal, including arsenic. However, in 1996, Roshana Shakya and Suman Prasad Sharma of WHO/SEARO proposed a water quality goal in Nepal of 50 ppb for arsenic.31
3.3 Symptoms of Arsenic Poisoning
Symptoms of arsenic poisoning can be described in two categories: acute and chronic. Acute symptoms are those that occur directly after brief exposure at high concentrations. Chronic effects occur gradually over time, and tend to develop after long term exposure to low levels of arsenic. Symptoms associated with both of these types of health effects are described in detail below.
3.3.1 Acute Health Effects
There are several symptoms characteristic of arsenic poisoning that manifest immediately if the dose is large enough. Signs of acute poisoning typically occur within 30 minutes of entry into the body. Initial symptoms can include muscle pain, and weakness, followed by severe nausea, abdominal pain and diarrhea. Other symptoms include numbness in hands and feet, red rashes on the skin, intense thirst, decreased urine output, drowsiness and confusion, paranoid delusions, hallucinations, and delirium. Ultimately, seizures, coma and death occur.3 2
In general, acute health effects are seen when arsenic levels of about 300 to 3,000 ppb enter the body. Approximately 60,000 ppb of arsenic can be fatal in adult humans.
3.3.2 Chronic Health Effects
Chronic health effects are the more common in India and Bangladesh. Although the levels of arsenic in the drinking water for these countries is quite high, the gradual ingestion of the arsenic has, over time, led to widespread chronic health effects. When arsenic is introduced in the body, 3 U.S. Environmental Protection Agency, "Drinking Water Priority Rulemaking: Arsenic." 2000.
31 Shakya, Roshana, and Suman Prasad Sharma. 1996. 32 Saha, J.C., et al., 1999.
3 ECO-USA, 2000.
unless it is at a level that produces acute effects, it will accumulate until an injurious state is reached. The metal will accumulate in the tissues, organs, hair and nails of the individual who is exposed, and will gradually build up to toxic levels. At that point, the arsenic begins to cause skin disorders. They begin as dark spots, particularly on the hands and feet, and gradually spreading to the neck and chest. The skin problems can become worse, leading to open sores on the body. Severe disorders, such as gangrene and melanoma, can also result if the level of toxin builds up enough over time. Other symptoms, such as a black tongue, nausea, vomiting, stomach pain, diarrhea, partial paralysis and blindness can also occur.
Aside from the skin disorders caused by arsenic poisoning, the chemical is also believed to cause several types of cancer of the internal organs. The USEPA has classified inorganic arsenic as a Group A human carcinogen, with a 1/ED10 value of 140 per (mg/kg)/dd.2 7 Prolonged exposure
to arsenic is believed to cause tumors in the bladder, kidney, liver and lungs. These chronic effects often do not manifest in the exposed individual until after several years of exposure.
3.4 Health Problems in Nepal
Current statistics concerning health problems in Nepal provide no direct links to arsenic poisoning in the country. However, information is available about some of the various symptoms associated with the toxin. From the data available, some general epidemiological conclusions can be drawn about the possibility of arsenic contamination in Nepalese drinking water.
The World Health Organization's International Agency for Research on Cancer has developed a 1990 worldwide cancer incidence and mortality index called GLOBOCAN 1.3 4 According to this index, incidence rates for common cancers have been determined for Nepal. The data for cancer in males that are typical of arsenic exposure are provided in Table 3-1. Rates for Nepal, Bangladesh, India and the world are provided for comparison.
34 World Health Organization, "GLOBOCANI." 2000.
Table 3-1: Incidence Rates for Male Adults in Various Countries
(Incidence Rates represent an age-standardized rate expressed per 10,000 people)3
Cancer Type Nepal Bangladesh India World
Liver Cancer 2.79 1.35 2.63 14.67
Lung Cancer 11.95 23.27 9.64 37.46
Melanoma of Skin 0.38 0.35 0.28 2.25
Bladder Cancer 4.39 1.31 3.74 9.89
Kidney Cancer 1.40 0.63 1.33 4.34
The data presented in Table 3-1 provides a survey of some common chronic health effects of arsenic poisoning. In countries such as India and Bangladesh, where known arsenic poisoning has occurred, incidence rates for liver cancer, melanoma of the skin, bladder and kidney cancer are actually less than those for Nepal. Of course there are several causes of these cancers, and a direct relationship between arsenic contamination and cancer incidence cannot be drawn. However, this data does not decrease the possibility of arsenic contamination in Nepalese drinking water.
Because of the common symptoms associated with arsenic poisoning, it is possible that exposure could be misdiagnosed as various other diseases. For instance, the skin disorders associated with arsenic poisoning can be mistaken for leprosy. Similarly, various types of cancers can be caused by several factors, including natural causes, and diseases like cancer are not commonly diagnosed in third world countries. Because of this, it is possible that arsenic poisoning may exist in Nepal without the symptoms being linked to arsenic.
Arsenic Contamination Study ofDrinking Water in Nepal
Chapter 4 - Analytical Methods
Three analytical methods were used to determine arsenic concentrations in samples collected in Nepal in January 2000. There were several choices of methods, and the first portion of this chapter explains the available options and the reasoning behind the decisions that were made. Next, detailed descriptions of each of the three methods used are provided, along with the
specific procedures that were performed.
4.1 Possible Test Methods
There are several test methods available that can be effectively used to measure arsenic concentrations in water samples. Each of these methods has significant advantages and disadvantages. Because of the unique nature of this project, each viable method was evaluated with respect to certain criteria important to this particular study. These criteria included the following:
" Detection limit: The detection limit for any given method is important. Because of the uncertainty of the concentrations of arsenic expected to be found in Nepal, a wide range of detection limits was preferred. The ability to accurately determine arsenic concentrations at the WHO guideline of 10 ppb was desirable.
* Field applicability: The method's applicability for use in the field was also another important consideration. For the purpose of this study, any instruments used had to be portable and rugged. The instruments also needed to be suitable for use in the climate of Nepal.
" Electricity/refrigeration requirements: The requirements of electricity and refrigeration are also important to this study. Resources available were not fully understood until the author arrived in Nepal. Because of this, methods not requiring electricity or refrigeration were desirable.
" Other chemical interferences: The interference of other chemicals with each method is also important for the study. Little is known about other chemical levels in Nepalese drinking water. Therefore, a method with few interactions with other chemicals was preferred.
e Safety issues: Another important factor concerning the determination of the appropriate analytical method was safety. Because arsenic is highly toxic, it was important that persons conducting tests be kept at low risk of adverse health effects when performing analytical procedures.
* Cost: The final factor affecting the analytical method decision was cost. Because of the limited resources available to this project, it was important that the method used be relatively inexpensive.
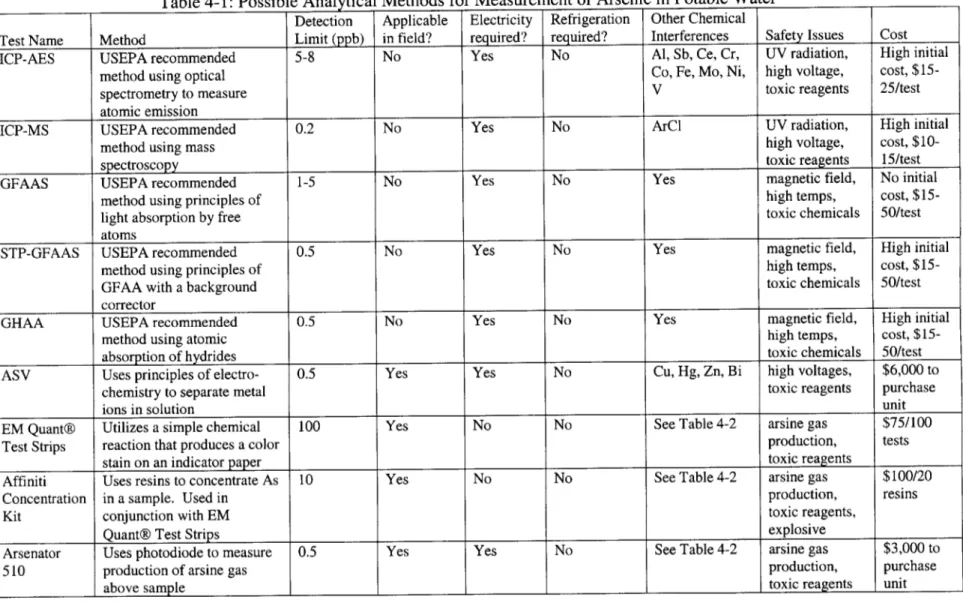
These criteria were used to evaluate several testing methods prior to choosing the most appropriate one(s). Each of the methods that were evaluated for potential use during this study are described below. Table 4-1 shows a matrix of the testing method selection process, and is a general summary of the information presented here.
e Inductively Coupled Plasma Atomic Emission Spectroscopy (ICP-AES):
This is a USEPA approved method for measuring arsenic in drinking water.3" An ICP-AES
instrument utilizes optical spectrometry to measure the characteristic atomic emission spectra of the analyte in question.36 ICP-AES uses a modified version of atomic emission spectroscopy
(AES). In AES, analyte atoms are aspirated into a region where they are desolvated, vaporized and atomized by a flame, discharge or plasma.37 The excited atoms radiate, and at a
characteristic wavelength, the intensity is directly proportional to the concentration of the analyte. With ICP-AES, the same concept is used, but a much higher temperature flame eliminates common interference and error sources.38 The detection limit for this method ranges
from 5-8 ppb." This instrument is not applicable for use in the field because of its large size and sensitivity to transportation, and would not be practical for use in Nepal. It requires electricity, but no refrigeration. ICP-AES can have several chemical interferences. When analyzing for arsenic, these include: aluminum, antimony, cerium, chromium, cobalt, iron, molybdenum, nickel, and vanadium. There are several safety issues associated with this method. First, the
3 U.S. Environmental Protection Agency, "Arsenic in Drinking Water: Analytical Methods." 1999. 36 U.S. Environmental Protection Agency, Region 9 Laboratory, 2000.
3 McMaster University, Faculty of Science, "Atomic Emission Spectroscopy." 1999.
38 McMaster University, Faculty of Science, "Inductively-Coupled Plasma Atomic Emission Spectroscopy." 1999.