HAL Id: hal-00649589
https://hal.archives-ouvertes.fr/hal-00649589
Submitted on 14 Apr 2021
HAL is a multi-disciplinary open access
archive for the deposit and dissemination of
sci-entific research documents, whether they are
pub-lished or not. The documents may come from
teaching and research institutions in France or
abroad, or from public or private research centers.
L’archive ouverte pluridisciplinaire HAL, est
destinée au dépôt et à la diffusion de documents
scientifiques de niveau recherche, publiés ou non,
émanant des établissements d’enseignement et de
recherche français ou étrangers, des laboratoires
publics ou privés.
changing environment elucidated by satellite tracking
and baleen plate stable isotopes
I. Bentaleb, C. Martin, M. Vrac, B. Mate, Patrick Mayzaud, D. Siret, Renaud
de Stephanis, Christophe Guinet
To cite this version:
I. Bentaleb, C. Martin, M. Vrac, B. Mate, Patrick Mayzaud, et al.. Foraging ecology of Mediterranean
fin whales in a changing environment elucidated by satellite tracking and baleen plate stable isotopes.
Marine Ecology Progress Series, Inter Research, 2011, 438, pp.285-302. �10.3354/meps09269�.
�hal-00649589�
INTRODUCTION
Fin whales Balaenoptera physalus are the largest marine mammals in the Mediterranean Sea (Notar-bartolo di Sciara et al. 2003), with an estimated popu-lation of 3500 individuals. B. physalus feed on the krill Meganyctiphanes norvegica (euphausiacea) as
revealed both by feces (Orsi Relini & Giordano 1992) and fatty acid (Ruchonnet et al. 2006) analyses. They gather during summer in the northern part of the western basin (Forcada et al. 1996, Monestiez et al. 2006, Cotté et al. 2009), where they are exposed to shipping collisions, a major threat for the species (Panigada et al. 2006) particularly in the Mediterra
-© Inter-Research 2011 · www.int-res.com *Email: ilham.bentaleb@univ-montp2.fr
Foraging ecology of Mediterranean fin whales in a
changing environment elucidated by satellite
tracking and baleen plate stable isotopes
I. Bentaleb
1,*, C. Martin
1, M. Vrac
2, B. Mate
3, P. Mayzaud
4, D. Siret
5,
R. de Stephanis
6, 7, C. Guinet
81Université Montpellier II, CNRS-ISEM, UMR 5554, 34095 Montpellier, Cedex 5, France 2UMR 8212, Laboratoire des Sciences du Climat et de l’Environnement (LSCE-IPSL), CNRS-CEA-UVSQ,
91198 Gif Sur Yvette, France
3Marine Mammal Institute, Oregon State University, Newport, OR 97365, USA
4Laboratoire d'Océanographie de Villefranche, UMR CNRS 7093, BP. 28, 06230 Villefranche sur Mer, France 51 allée Louis de Villetain, 91190 Gif-sur-Yvette, France
6Department of Conservation Biology, Estación Biológica de Doñana, CSIC, C/Americo Vespucio, s/n, 41092,
Isla de la Cartuja, Sevilla, Spain
7CIRCE, Conservation, Information and Research on Cetaceans, c/ Cabeza de Manzaneda 3, Algeciras-Pelayo, 11390 Cadiz, Spain 8Centre d’Etudes Biologiques de Chizé, 79360 Villiers-en-Bois, France
ABSTRACT: We investigated seasonal shifts in diet and distribution of fin whales Bala en optera physalus occurring in the western Mediterranean Sea. For this purpose, we combined carbon and nitrogen stable isotope ratios (δ13C, δ15N) along 10 baleen plates collected from stranded fin
whales between 1975 and 2002 with satellite tag deployments on 11 fin whales during summer 2003. Baleen plate stable isotopes were compared with those of the krill Meganyctiphanes norvegica, the main prey of fin whales in the northwestern Mediterranean Sea. Two plates col-lected near Malaga, Spain, exhibited larger δ13C variations, while only smaller variations could be
detected in the other 8. While all mean baleen plate results were consistent with the δ13C
signa-ture of Mediterranean M. norvegica, the most depleted δ13C values were intermediate between
those of Atlantic and Mediterranean M. norvegica, suggesting westward migrations perhaps extending to the Strait of Gibraltar but not extensive, prolonged feeding in the Northeast Atlantic. This pattern was confirmed by satellite tracking; 1 out of 8 fin whales we successfully tracked left the Mediterranean for the Atlantic. Longer-term changes in isotopic signatures of baleen plates exhibited significant depletion trends, indicating that changes due to increasing input of nutrients and anthropogenic carbon are occurring in the western Mediterranean Sea ecosystem.
KEY WORDS: Meganyctiphanes norvegica · Mediterranean Sea · Foraging · Migration · Satellite telemetry · Environmental change
nean, which accounts for 30% (in Notarbartolo di Sciara et al. 2003) of the world’s merchant shipping covering only 0.8% of the global ocean surface. Infor-mation about their population distribution outside the summer period is lacking, yet it is needed to de -velop mitigation measures for the conservation of the species. Mediterranean fin whales are genetically distinct from the other north Atlantic populations (Bérubé et al. 1998). The degree of contact be tween Mediterra nean and Atlantic fin whale popu lations has been debated for the last 2 centuries, and the pre-vailing idea is that the stocks are geographically iso-lated (Notarbartolo di Sciara et al. 2003). Recently, from fin whale sighting and satellite tracking, Cotté et al. (2008) suggested a regional fidelity to the north-western Mediterranean Sea. Sightings have been recorded in shallow water around Lampedusa Island in winter (Canese et al. 2006), and Aïssi et al (2008) suggested a probable year-round distribution along synchronic seasonal dispatching, with a feeding be -haviour occurrence in the Ligurian Sea during late spring and summer and in the Lampedusa area from late winter to early spring. However, the results are still insufficient to prove year-round residency of a large portion of the fin whale Mediterranean population.
In the present study, the distribution of fin whales was investigated by monitoring movement using satellite tags deployed on whales present in the northwestern Mediterranean Sea during summer. This approach was complemented by the measure-ments of stable isotopes in fin whale tissues, which can be a powerful complement for investigating for-aging behaviour, not only in terms of diet but also in terms of movement of marine predators (Kelly 2000, Bearhop et al. 2004, Bailleul et al. 2010). Recently de -veloped methods of diet analysis (e.g. lipids and sta-ble isotopes) are increasingly used to investigate the feeding habits of predator species. The stable isotope ratio for an animal’s tissue is often related to that of its diet, with a difference due to the trophic isotopic enrichment factor between dietary and consumer tis-sue (DeNiro & Epstein 1978, 1981). Consumer tistis-sues are enriched in 15N relative to their food, and,
conse-quently, δ15N measurements serve as indicators of a
consumer trophic position (McCutchan et al. 2003, Vanderklift & Ponsard 2003) integrated over months while stomach contents or feces analysis are gener-ally only representative of the very last foraging areas visited. Pioneering studies of DeNiro & Epstein (1981), Minagawa & Wada (1984), and Peterson & Fry (1987) suggested that consumers become enriched in
15N relative to their food by 3 to 4 ‰. However a
num-ber of studies reveal a wider range of isotopic 15N
enrichment between trophic levels (1.7 to 4.5 ‰; Minagawa & Wada 1984, Abend & Smith 1997, Post 2002). A mean 3.4 ‰ enrichment value was used by Pinnegar et al. (2003) in their exhaustive western Mediterranean fishery landing study.
In contrast, small increases of δ13C between prey
and predators are reported in the literature (< 2 ‰, mean 1 ‰) (De Niro & Epstein 1978, Wada et al. 1991) providing clues about the ultimate origin of their food. δ13C values of organic tissue along food chain
are mainly used to assess consumer foraging areas, i.e. inshore versus offshore, pelagic versus ben thic, or latitudinal variations in the contribution to food intake (Kelly 2000, Cherel & Hobson 2007). The ori-gin of the latitudinal depletion of marine organic mat-ter δ13C with increasing latitude has been mainly
attributed to changes in the concentration of aqueous CO2 (Rau et al. 1989, Bentaleb et al. 1998). These
regional and latitudinal δ13C gradients have been
also used as an effective way for investigating sea-sonal change in the foraging areas of marine preda-tors (Cherel & Hobson 2007, Cherel et al. 2007).
The whale baleen plates are a particularly suit-able tissue to investigate the temporal change of the δ15N and δ13C due to their continuous growth
throughout lifetime (Hobson et al. 2004). The baleen plates grow down from the gums of the upper jaw and are arranged in rows that extend down each side of the mouth. The terminal end continually wears off. The baleens composed of keratinous pro-tein are metabolically inactive after formation (Schell et al. 1989a). Thus, their isotopic composition is believed to record the diet of the whales through its synthesis. Schell et al. (1989a,b) measured stable isotope ratios in the baleen plates of bowhead whales Balaena mysticetus and found isotopic oscil-lations along the length of the baleen plates. Similar oscillations were also found in the baleen of south-ern right whales Eubalaena australis (Best & Schell 1996). The technique was also successfully applied to investigate seasonal shift in diet of Minke whales off Japan (Mitani et al. 2006) and long-term average diet (Hobson et al., 2004).
The present study focuses on the Mediterranean Balaenoptera physalus (hereafter fin whale). The main objectives of our study were to assess seasonal movements or dietary shift of this population and their movements inside the Mediterranean Sea by combining the information provided by: (1) satellite tracking of individual fin whales marked in the Mediterranean Sea at the end of summer, and (2) analyses of δ15N and δ13C signatures along baleen
plates collected from stranded fin whales in the west-ern Mediterranean, and of krill Meganycti phanes norvegica (hereafter krill) sampled in the Mediter-ranean sea and in the Atlantic ocean.
We assert that the isotopic composition of the krill consumed throughout the fin whale lifetime is pre-served. Whenever Mediterranean fin whales migrate, or shift preys, they should exhibit corresponding changes in the isotopic signature along their plates. Stable isotope values should be different be tween different prey or between the Mediterranean Sea and the Atlantic Ocean. Finally, from plates collected from the 1970s to the 2000s, we tried to detect whether δ13C and δ15N stable isotope signatures shift
over time, revealing some large-scale and long-term environmental change within the Mediterra nean Sea.
MATERIALS AND METHODS Sampling of materials
Baleen plates are made of Keratin. They grow from the gums of the upper jaw and are arranged in rows that extend down each side of the mouth. Baleen grows throughout the whale’s lifetime; the terminal end continually wears off. The outer (outside-facing)
edge of each plate is smooth, while the inner edge is frayed (see Fig. 1). The frayed edge of each plate intertwines to form a mat, which functions as a strainer during filter feeding.
A total of 10 baleen plates (BP) was collected over the period 1975 to 2002 from 9 fin whales stranded along the western Mediterranean coast. Eight BPs were collected on the French coast (BP1 to BP7 and BP9) and 2 in the Malaga area and the Strait of Gibraltar, Andalusia, Spain (BPs 8 and 10). BPs 3 and 4 were collected from the same individual stranded in Port-La-Nouvelle (France). BP3 was collected from the right upper jaw, whereas BP4 was taken in the anterior part (see Fig. 1, Table 1).
Krill from the Atlantic Ocean (be tween 38 and 45° N and 12 and 13° W) was sampled during the POMME 2 and 3 cruises in March and September 2001 using a mid-water trawl. Stable isotopic study concerned a total of 12 adult and sub-adult individu-als (6 each for spring and fall), and the 6 adults were sexed (4 males and 2 females; Table 2). Samples were immediately frozen at –80°C (see Salomon et al. 2000) until laboratory analysis. For the Mediter-ranean Sea, we used stable isotopic data and carbon: nitrogen ratio (C:N) of 12 adult specimens (6 each from spring and fall) of krill sampled in the Gulf of Lion (Ferraton 2007; Table 3).
Fig. 1. Balaenoptera phy sa -lus. Photographs of the 10
baleen plates (BP) of fin whales stranded along west-ern Medi terranean coasts. Sampling follows the L-axis (proximal = jaw to plate junc-tion, L = 0; Distal = Lmax). Some BPs have conserved the junction zone between jaw and plate (see BP1) and have both outer and inner edge. The scale is given on
Stable isotope analyses of fin whale baleen plates and krill
Baleen plates were rinsed with distilled water and dried in an oven at 50°C. We used a dental drill to col-lect the keratin powder along the L-axis from the proximal part (below the gum line) to the to the most distal, i.e. oldest part of the plates at an interval of ~1 cm so as to represent an approximately constant time interval. The drilled area was 2 to 3 mm in dia -meter. The sampling took place at the outer edge (W = 0) for most of the plates except BP6 (W = 2 cm). The plates are generally broken in different areas such as BPs1, 2, 7, and 8, for which an undetermined and probably significant top portion is missing (Fig. 1). The powder (0.5 to 1.0 mg) was collected in a glass tube previously washed with hydrochloric acid and rinsed with distilled water, and dried at 60°C for 48 h. The stable-carbon and stable-nitrogen isotope assays and the C and N contents were performed in 2008 at the Institut des Sciences de l’Evolution de Montpel-lier Laboratory. About 70 to 120 µg of homogenized powder samples were loaded into tin cups and com-busted at 1200°C in a Euro Vector EA3000 elemental analyzer. Resultant CO2and N2gases were analyzed
by continuous flow using an interfaced GV Optima Isotope Ratio Mass Spectrometer (IRMS). δ13C and
δ15N values are expressed in δ notation relative to
V-PDB belemnite and atmospheric N2 (air),
respec-tively. The δ notation represents the deviation from standards in parts per thousand (‰):
δ13C or δ15N = (R
sample/Rstandard– 1) × 1000 (1)
where R = 13C/12C or 15N/14N. Replicate δ15N mea-surements of both potassium nitrate (n = 36; IAEA-NO-3-δ15N: 4.7 ‰) and alanine (ISEM internal
stan-dard unknown origin; n = 41; alanine-δ15N: –0.5 ‰)
indicate a reproducibility better than 0.2 ‰ and an accuracy of 0.1 ‰. Both accuracy and reproducibility of the δ13C Nist-8541 graphite (also known as
USGS-24 with a δ13C of –16.1 ‰; n = 34) are 0.3 ‰. The
ala-nine δ13C accuracy was quite poor (0.5 ‰), but the re
-producibility was 0.2 ‰. Using the C and N contents of the IAEA-NO-3 (N% = 13), and Alanine (C% = 40%), the baleen plate C and N contents (%) were measured with a precision of 1%.
Whole Atlantic krill individual samples were lyo -philized, powdered using a mortar pestel and sieved through a 60 µm mesh. We did not re move the chitin assuming that the small content (3.7 to 5% of krill dry weight (DW) according to Raymont et al. 1971) will not significantly affect the isotopic value of the whole individual. Moreover it allowed us to compare
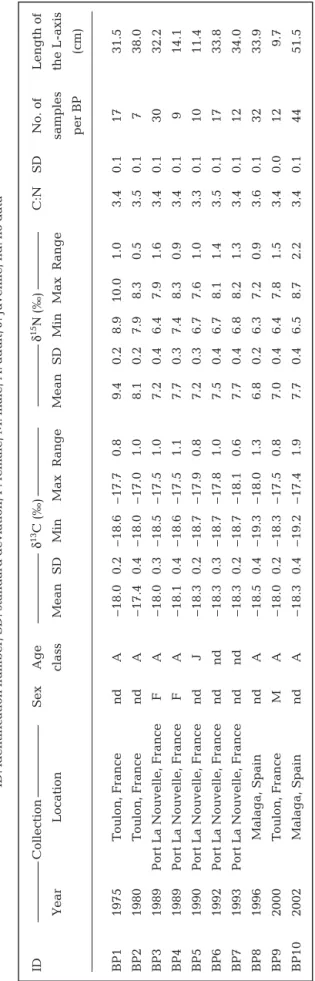
ID Collection Sex Age δ 13 C (‰) δ 15Ν (‰) C:N SD No. of Length of Y ear Location class Mean SD Min Max Range Mean SD Min Max Range samples the L-axis per BP (cm) BP1 1975 T oulon, France nd A – 18.0 0.2 – 18.6 – 17.7 0.8 9.4 0 .2 8.9 10.0 1.0 3.4 0.1 17 31.5 BP2 1980 T oulon, France nd A – 17.4 0.4 – 18.0 – 17.0 1.0 8.1 0 .2 7.9 8.3 0.5 3.5 0.1 7 38.0 BP3 1989 Por t La Nouvelle, France F A – 18.0 0.3 – 18.5 – 17.5 1.0 7.2 0.4 6.4 7.9 1.6 3.4 0.1 30 32.2 BP4 1989 Por t La Nouvelle, France F A – 18.1 0.4 – 18.6 – 17.5 1.1 7.7 0.3 7.4 8.3 0.9 3.4 0.1 9 14.1 BP5 1990 Por t La Nouvelle, France nd J – 18.3 0.2 – 18.7 – 17.9 0.8 7.2 0.3 6.7 7.6 1.0 3.3 0.1 10 11.4 BP6 1992 Por t La Nouvelle, France nd nd – 18.3 0.3 – 18.7 – 17.8 1.0 7.5 0.4 6. 7 8.1 1.4 3.5 0.1 17 33.8 BP7 1993 Por t La Nouvelle, France nd nd – 18.3 0.2 – 18.7 – 18.1 0.6 7.7 0.4 6. 8 8.2 1.3 3.4 0.1 12 34.0 BP8 1996 Malaga, Spain nd A – 18.5 0.4 – 19.3 – 18.0 1.3 6.8 0 .2 6.3 7.2 0.9 3.6 0.1 32 33.9 BP9 2000 T oulon, France M A – 18.0 0.2 – 18.3 – 17.5 0.8 7.0 0.4 6.4 7.8 1.5 3.4 0.0 12 9.7 BP10 2002 Malaga, Spain nd A – 18.3 0.4 – 19.2 – 17.4 1.9 7.7 0. 4 6.5 8.7 2.2 3.4 0.1 44 51.5 T able 1. Balaenoptera phy sa lus
. Sampling data, carbon (C) and nitr
ogen (N) stable isotope and C:N (see Fig. 1) ratios of 10 fin whale baleen plates (BP). BP3
and 4 wer
e
fr
om the same individual but sampled at lateral and fr
ontal sides of the jaw
. All samples wer
e
measur
ed along W = 0 axis except
for BP6, which was measur
ed as W = 2 cm.
ID: identification number; SD: standar
d
Atlantic krill isotopic composition values to those of the Mediterranean Sea analysed with chitin intact (Ferraton 2007). The isotopic measurements were performed in the laboratory of Littoral Environne -ment et Sociétés (LIENS). Precision of the ace ta ni lide is 0.2 ‰ for 13C and 15N, and ~1% for the C and N
elemental content. We did not proceed to a calibration of standards. Instead we compared the isotopic results of the 12 bulk Atlantic krill powders analyzed at an interval time of 4 yr in 2009 at LIENS and 2005 at ISEM labo ratories. Results show very consistent δ13C values (differences < 0.1 ‰), while
ISEM δ15N values were consistently de pleted by
0.6 ‰ compared to LIENS. This difference does not affect our interpretation.
For the Mediterranean Sea we used stable isotope and C:N ratio data for spring and fall Mediterranean krill from Ferraton (2007). We assumed that Ferraton’s data were representatitive endmember of δ13C and δ15N
composi-tions for the Mediterranean fall and spring krill. High lipid concentration can mask a large part of the δ13C isotopic
signature be cause lipids are13C depleted
(6 to 8 ‰) compared with proteins and carbo hydrates (De Niro & Epstein 1978, McConnaughey & McRoy 1979). We tested the effect of the lipid content by comparing the 12 Atlantic Ocean krill C and N isotopic compositions measured before and after the lipid extraction treatment using cyclohexane. Available Medi -terranean krill isotopic data concerns only non-lipid extracted samples.
Satellite tracking
Semi-implantable tags (26 cm in length × 1.9 cm in diameter) consisted of a Telonics Argos ST-15 transmitter in a stainless steel tube, incorporating a flexi-ble 12.5 cm whip-an ten na, a flexiflexi-ble 4 cm saltwater switch (SWS), and 2 solid flanges (0.9 × 1.5 cm) to prevent inward migration. Half of the anterior housing was coated with 2.5 g of Gentamycin sul-fate antibiotic in methacrylate (Eudra grit), designed for ex tended time-release. The tag was applied to the fin whale using an air-powered applicator (Heide- Jørgensen et al. 2001) with 7 bar pressure from an el-evated 1 m bow pulpit at a distance of < 3 m from a 6 m outboard-powered boat. Tags were deployed within 2 m of the dorsal fin frontal part. To conserve batteries and extend tag operation, tags transmitted for only 4 periods of 1 h daily for 90 d and then every fourth day. A saltwater switch prevented the tag from transmitting when underwater. At the surface, transmissions were programmed to coincide with optimal satellite coverage within the western Mediterranean Sea.
Statistics
Data were analyzed statistically using the R lan-guage (R Development Core Team 2010). Isotopic Sample Collection n Bulk samples Lipid-free samples
date (mo/yr) δ13C δ15N C:N δ13C δ15N C:N 1753_5F 03/2001 1 –20.9 5.3 3.8 –20.9 6.3 3.5 1753_6F 03/2001 1 –21.4 4.5 3.9 –21.2 5.5 3.7 1755_1M 03/2001 1 –21.5 5.7 3.7 –21.4 6.0 3.6 1755_2M 03/2001 1 –20.7 6.8 3.5 –20.6 7.1 3.5 1755_3M 03/2001 1 –21.2 5.9 3.9 –20.8 6.5 3.5 1755_4M 03/2001 1 –20.7 6.6 3.5 –20.7 6.7 3.5 1754_SUB6 09/2001 1 –21.3 7.1 3.9 –21.0 7.1 3.6 1756_SUB1 09/2001 1 –21.1 7.8 3.6 –21.2 7.8 3.6 1756_SUB2 09/2001 1 –21.2 8.4 4.0 –20.9 8.6 3.7 1756_SUB3 09/2001 1 –21.4 7.2 3.9 –21.2 7.3 3.7 1756_SUB4 09/2001 1 –20.9 7.4 4.0 –20.9 7.3 4.0 1756_SUB5 09/2001 1 –21.7 6.9 3.8 –21.4 7.2 3.5 Spring mean 6 –21.1 5.8 3.7 –20.9 6.3 3.5 ± SD ± 0.4 ± 0.9 ± 0.2 ± 0.3 ± 0.6 ± 0.1 Fall mean 6 –21.3 7.4 3.8 –21.1 7.5 3.7 ± SD ± 0.3 ± 0.6 0.2 ± 0.2 ± 0.6 ± 0.2 Annual mean 12 –21.2 6.6 3.8 –21.0 6.9 3.6 ± SD ± 0.3 ±1.1 ± 0.2 ± 0.3 ± 0.8 ± 0.1 Table 2. Meganyctiphanes norvegica. δ13C, δ15N, and C:N values of 12 bulk
and 12 lipid free samples of Atlantic krill. Spring, fall, and annual values are mean ± SD. F: female, M: male; Sub: sub-adult
Origin, year Season n δ13C δ15N C/N
AO, 2001 Spring 6 –21.1 ± 0.4 5.8 ± 0.9 3.7 ± 0.2 (present study) Fall 6 –21.3 ± 0.3 7.4 ± 0.6 3.8 ± 0.2 Annual 12 –21.2 ± 0.3 6.6 ± 1.1 3.8 ± 0.2
MS, 2004 Spring 6 –19.0 ± 0.4 4.1 ± 0.5 5.6 ± 0.4 (Ferraton 2007) Fall 6 –19.7 ± 0.2 5.0 ± 0.2 5.7 ± 0.1 Annual 12 –19.3 ± 0.5 4.4 ± 0.6 5.6 ± 0.2 Table 3. Meganyctiphanes norvegica. Spring, fall, and annual values of δ13C,
δ15N, and C:N (mean ± SD) of Atlantic Ocean (AO) and Mediterranean Sea
ratios were means ± SD, and statistical tests re -garding potential differences in variances or means for different sub-groups were performed using Fisher-Snedecor and Student’s t-test or Welsh’s test (e.g. see Wilks 2006), respectively, at a 95% level of signifi-cance (α = 0.05). Statistical analyses performed on BPs in the sections that follow refer always to BPs with W = 0, hence excluding BP6 (W = 2 cm).
RESULTS Stable isotopes of krill
Bulk powders of 12 Atlantic krill individuals sam-pled in spring (n = 6; adults) and fall (n = 6; subadults) were analyzed for C and N stable isotopes and C and N contents (%) before and after lipid removal by chemical treatment (Table 2). Sample sizes were too small to parse out class age or seasonal ef fect. Hence seasonal effects cannot be independently studied for the Atlantic krill data.
Using a dependent t-test for paired samples, car-bon stable isotope values (mean ± SD, n = 12) before (–21.2 ± 0.3 ‰) and after (–21.0 ± 0.3 ‰) chemical treatment were statistically significantly different (t = 3.1, p < 0.01). For the nitrogen isotopic values, signif-icant differences between none lipid extracted (6.6 ± 1.1 ‰) and lipid free samples (6.9 ± 0.8 ‰) were found (t = 3.06, p < 0.05). These statistical analyses suggest an effect of the chemical treatment for carbon and nitrogen isotopic composition of the krill. These deli -pi da tion treatments have been discussed in Kiljuenen et al. (2006) and Post et al. (2007).
Lipid removal does cause slight and statistically sig-nificant changes in δ13C and δ15N values for
whole-body krill. However, on the ab solute scale the differ-ences in δ15N and δ13C between lipid extracted and
bulk krill are small, by 0.32 and 0.15 ‰, respectively, on average. Therefore in order to allow direct com-parison with the results provided by Ferraton (2007) for Mediterranean krill, bulk krill values were used, for which seasonal δ13C and δ15N differences were
reported (Table 3). Mean δ13C is higher in spring
(–19.0 ± 0.4 ‰) than during fall (–19.7 ± 0.2 ‰), and δ15N mean increases from 4.1 ± 0.5 ‰ in spring to
5.0 ± 0.1 ‰ in fall.
Significant differences were found between bulk krill sampled in the Atlantic Ocean (AO) and the Mediterranean Sea (MS) at the annual scale for both the δ13C (MS: –19.3 ± 0.5 ‰; AO: –21.2 ± 0.3 ‰; t =
–6.53, p < 0.01) and δ15N (MS: 4.4 ± 0.6 ‰, AO: 6.6 ±
1.1 ‰, t = 7.36, p < 0.01).
Assuming enrichments of ~1 ‰ 13C and 3.4 ‰ 15N
per trophic level (De Niro & Epstein 1978, 1981) the δ13C and δ15N annual means for a fin whale feeding
on krill in the MS or in the AO would be –18.3 ± 0.5 ‰; 7.8 ± 0.6 ‰ and –20.2 ± 0.3 ‰; 10 ± 1.1 ‰, respectively.
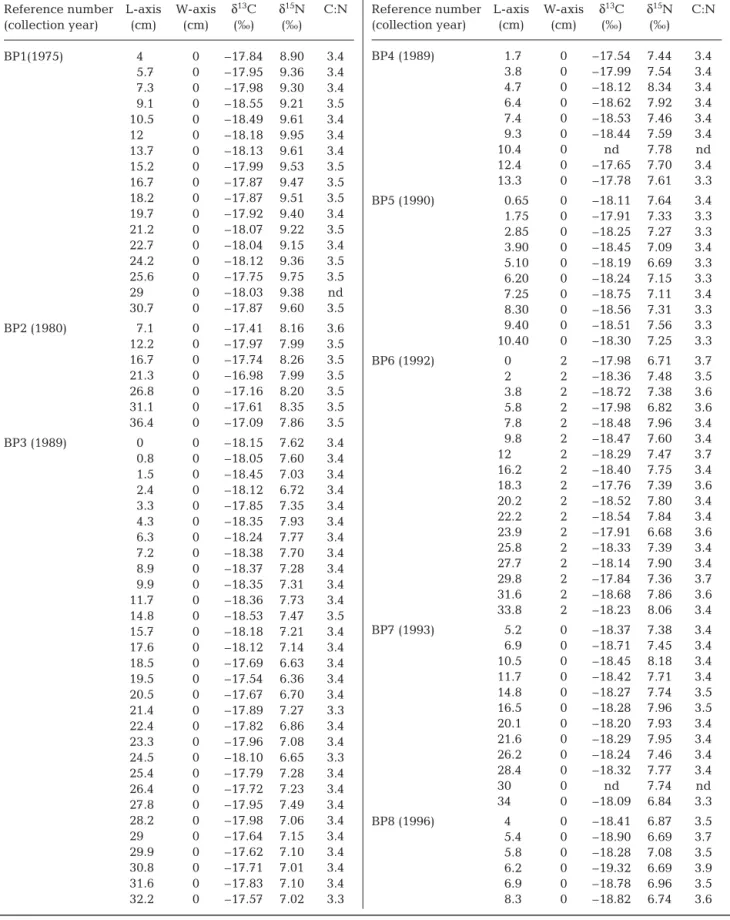
Stable isotopes of fin whale baleen plates The isotopic variations in the 10 baleen plates, re -presenting 190 pairs of δ13C to δ15N analyses and C:N
ratios along the L-axis of the baleen plates are reported in Table 4. The mean and SD of all 190 C:N ratios for all BPs across all baleen lengths is 3.4 ± 0.1 (Table 4), which is in agreement with the theoretical C:N atomic ratio of keratin (O’Connell & Hedges 1999).
Among all 190 baleen samples and across all lengths, δ13C and δ15N values ranged between –19.3
and –17 ‰, and 6.3 and 10.0 ‰, respectively (Table 1). The δ13C ranges (max. δ13C to min. δ13C along a
baleen plate) are rather small for most BPs (<1.1 ‰; Table 1), except for BP8 and BP10 (1.3 and 1.9 ‰, respectively). BPs 3, 9, and 10 show the highest δ15N
range values (1.6, 1.5, and 2.2 ‰, respectively; Table 1). Both BP1 and BP2 showed a higher δ15N
mean (9.4 ± 0.2 ‰ and 8.1 ± 0.2 ‰, respectively) than the other BPs (6.8 to 7.7 ‰; p always < 0.05 and even < 0.001 for most of the BPs, W = 0).
Considering the records along the plate, positive or negative trends in δ13C and δ15N with respect to the
distance from the top of the plates (W = 0) were found (Figs. 2 & 3). The relationships between δ13C along
the L-axis were only significant for BP5 and BP9, which both exhibit significant slopes (p < 0.05).
While δ13C of BP3 (lateral position) and BP4 (frontal
area) were sampled from the same fin whale, no rela-tionship was found (p = 0.92; Fig. 2). BP4 was half the size of BP3 and probably represents a shorter time-span. Mean BP4 δ13C record (–18.1 ± 0.4 ‰) is very
similar to that found for BP3 between 0 and 15.7 cm (–18.3 ± 0.2 ‰) (p > 0.05). δ13C of BP3 showed a
change at ~17.6 to 20.5 cm (mean ± SD = –17.8 ± 0.3 ‰). The same results were observed regarding δ15N with relatively similar mean values for BP4
(7.7 ± 0.3 ‰) and BP3 (between 0 and 15.7 cm = 7.4 ± 0.3 ‰, p > 0.05). The mean δ15N values of BP3
between 17.6 and 20.5 cm (6.7 ± 0.3 ‰) are signifi-cantly lower than the values observed between 0 to 15.7 cm (p < 0.05) and 21.4 to 32.2 cm (p < 0.05). Sig-nificant covariation between δ13C and δ15N was also
Reference number L-axis W-axis δ13C δ15N C:N (collection year) (cm) (cm) (‰) (‰) BP1(1975) 4 0 –17.84 8.90 3.4 5.7 0 –17.95 9.36 3.4 7.3 0 –17.98 9.30 3.4 9.1 0 –18.55 9.21 3.5 10.5 0 –18.49 9.61 3.4 12 0 –18.18 9.95 3.4 13.7 0 –18.13 9.61 3.4 15.2 0 –17.99 9.53 3.5 16.7 0 –17.87 9.47 3.5 18.2 0 –17.87 9.51 3.5 19.7 0 –17.92 9.40 3.4 21.2 0 –18.07 9.22 3.5 22.7 0 –18.04 9.15 3.4 24.2 0 –18.12 9.36 3.5 25.6 0 –17.75 9.75 3.5 29 0 –18.03 9.38 nd 30.7 0 –17.87 9.60 3.5 BP2 (1980) 7.1 0 –17.41 8.16 3.6 12.2 0 –17.97 7.99 3.5 16.7 0 –17.74 8.26 3.5 21.3 0 –16.98 7.99 3.5 26.8 0 –17.16 8.20 3.5 31.1 0 –17.61 8.35 3.5 36.4 0 –17.09 7.86 3.5 BP3 (1989) 0 0 –18.15 7.62 3.4 0.8 0 –18.05 7.60 3.4 1.5 0 –18.45 7.03 3.4 2.4 0 –18.12 6.72 3.4 3.3 0 –17.85 7.35 3.4 4.3 0 –18.35 7.93 3.4 6.3 0 –18.24 7.77 3.4 7.2 0 –18.38 7.70 3.4 8.9 0 –18.37 7.28 3.4 9.9 0 –18.35 7.31 3.4 11.7 0 –18.36 7.73 3.4 14.8 0 –18.53 7.47 3.5 15.7 0 –18.18 7.21 3.4 17.6 0 –18.12 7.14 3.4 18.5 0 –17.69 6.63 3.4 19.5 0 –17.54 6.36 3.4 20.5 0 –17.67 6.70 3.4 21.4 0 –17.89 7.27 3.3 22.4 0 –17.82 6.86 3.4 23.3 0 –17.96 7.08 3.4 24.5 0 –18.10 6.65 3.3 25.4 0 –17.79 7.28 3.4 26.4 0 –17.72 7.23 3.4 27.8 0 –17.95 7.49 3.4 28.2 0 –17.98 7.06 3.4 29 0 –17.64 7.15 3.4 29.9 0 –17.62 7.10 3.4 30.8 0 –17.71 7.01 3.4 31.6 0 –17.83 7.10 3.4 32.2 0 –17.57 7.02 3.3
Reference number L-axis W-axis δ13C δ15N C:N
(collection year) (cm) (cm) (‰) (‰) BP4 (1989) 1.7 0 –17.54 7.44 3.4 3.8 0 –17.99 7.54 3.4 4.7 0 –18.12 8.34 3.4 6.4 0 –18.62 7.92 3.4 7.4 0 –18.53 7.46 3.4 9.3 0 –18.44 7.59 3.4 10.4 0 nd 7.78 nd 12.4 0 –17.65 7.70 3.4 13.3 0 –17.78 7.61 3.3 BP5 (1990) 0.65 0 –18.11 7.64 3.4 1.75 0 –17.91 7.33 3.3 2.85 0 –18.25 7.27 3.3 3.90 0 –18.45 7.09 3.4 5.10 0 –18.19 6.69 3.3 6.20 0 –18.24 7.15 3.3 7.25 0 –18.75 7.11 3.4 8.30 0 –18.56 7.31 3.3 9.40 0 –18.51 7.56 3.3 10.40 0 –18.30 7.25 3.3 BP6 (1992) 0 2 –17.98 6.71 3.7 2 2 –18.36 7.48 3.5 3.8 2 –18.72 7.38 3.6 5.8 2 –17.98 6.82 3.6 7.8 2 –18.48 7.96 3.4 9.8 2 –18.47 7.60 3.4 12 2 –18.29 7.47 3.7 16.2 2 –18.40 7.75 3.4 18.3 2 –17.76 7.39 3.6 20.2 2 –18.52 7.80 3.4 22.2 2 –18.54 7.84 3.4 23.9 2 –17.91 6.68 3.6 25.8 2 –18.33 7.39 3.4 27.7 2 –18.14 7.90 3.4 29.8 2 –17.84 7.36 3.7 31.6 2 –18.68 7.86 3.6 33.8 2 –18.23 8.06 3.4 BP7 (1993) 5.2 0 –18.37 7.38 3.4 6.9 0 –18.71 7.45 3.4 10.5 0 –18.45 8.18 3.4 11.7 0 –18.42 7.71 3.4 14.8 0 –18.27 7.74 3.5 16.5 0 –18.28 7.96 3.5 20.1 0 –18.20 7.93 3.4 21.6 0 –18.29 7.95 3.4 26.2 0 –18.24 7.46 3.4 28.4 0 –18.32 7.77 3.4 30 0 nd 7.74 nd 34 0 –18.09 6.84 3.3 BP8 (1996) 4 0 –18.41 6.87 3.5 5.4 0 –18.90 6.69 3.7 5.8 0 –18.28 7.08 3.5 6.2 0 –19.32 6.69 3.9 6.9 0 –18.78 6.96 3.5 8.3 0 –18.82 6.74 3.6 Table 4. Balaenoptera phy sa lus. Carbon (C) and nitrogen (N) stable isotope and C:N ratios measured along fin whale baleen plate length (L-axis, see Fig. 1) by plate reference number (collection year). All samples were measured along W = 0 axis
except for BP6, which was measured as W = 2 cm. nd: lost sample
Stable isotopes signature of krill and fin whale baleen, and trophic level of fin whales The mean level of δ15N signature of baleen plates
(7.6 ± 0.7 ‰) was 3.2 and 1.0 ‰ higher than that of bulk (non-lipid-extracted) Meganyctiphanes norve -gica sampled in the Mediterranean Sea or in the Atlantic Ocean, respectively. The mean level of δ13C
signature of baleen plates (–18.2 ± 0.4 ‰) was 1.1 ‰ and 3.0 ‰ higher than that of annual mean bulk krill sampled in the Mediterranean Sea or in the Atlantic Ocean, respectively (Tables 2 & 3).
According to the methods described by De Niro & Epstein (1978, 1981) we corrected the δ13C and δ15N
values of the Mediterranean Sea and the Atlantic Ocean krill by 1.0 and 3.4 ‰, respectively to take into account the trophic level enrichment factor for car-bon and nitrogen. When compared to the corrected spring and fall δ13C and δ15N values of the bulk
Mediterranean and to the corrected annual δ13C and
δ15N values of the bulk Atlantic krill samples, the
δ13C and δ15N values of the 10 BPs are more closely
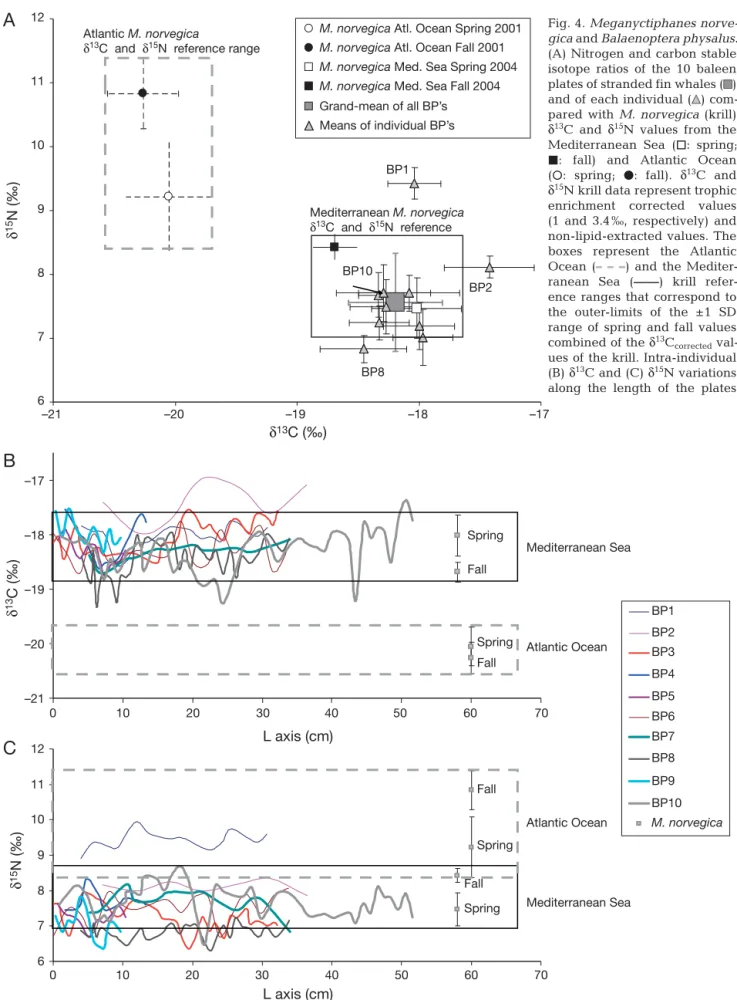
related to the annualized Mediterranean krill values (Fig. 4A). All but one (BP2) δ13C mean value fell
Reference number L-axis W-axis δ13C δ15N C:N
(collection year) (cm) (cm) (‰) (‰) BP (1996) 9.1 0 –19.25 6.70 4.0 9.7 0 –18.76 6.57 3.7 10.5 0 –18.78 6.44 3.6 11.2 0 –18.66 6.58 3.6 12 0 –18.02 6.79 3.4 12.7 0 –18.23 6.93 3.5 13.5 0 –18.05 6.61 3.6 15.5 0 –18.20 6.79 3.6 16.4 0 –18.05 7.01 3.5 17.2 0 –17.97 7.07 3.6 18.1 0 –18.64 6.77 3.7 18.9 0 –18.26 7.03 3.6 19.7 0 –18.62 7.00 3.7 20.5 0 –18.21 7.04 3.6 22.4 0 –18.46 6.32 3.5 23.4 0 –18.29 6.64 3.5 24.4 0 –18.73 7.02 3.6 25.4 0 –18.28 6.66 3.5 26.2 0 –18.80 7.23 3.7 27.1 0 –18.39 6.99 3.5 28.2 0 –18.52 6.93 3.6 29.5 0 –18.36 6.69 3.6 30.6 0 –17.99 6.97 3.5 31.8 0 –18.14 6.69 3.5 32.9 0 –18.30 6.88 3.5 33.9 0 –18.08 7.16 3.5 BP9 (2000) 0.35 0 –17.57 7.29 3.5 1.25 0 –18.05 6.84 3.4 2.15 0 –17.53 7.16 3.4 3 0 –17.79 7.11 3.4 3.85 0 –18.02 7.83 3.4 4.75 0 –18.16 7.55 3.4 5.8 0 –17.86 6.58 3.4 6.85 0 –18.18 6.40 3.4 7.25 0 –18.32 6.36 3.3 8.05 0 –17.90 7.10 3.4 8.7 0 –18.18 7.09 3.3 9.7 0 –18.06 6.83 3.4 BP10 (2002) 0.9 0 –18.02 7.61 3.3 3 0 –18.15 8.12 3.4 4.1 0 –18.08 8.08 3.4 5.1 0 –18.19 7.73 3.3
Reference number L-axis W-axis δ13C δ15N C:N
(collection year) (cm) (cm) (‰) (‰) BP10 (2002) 6.2 0 –18.33 7.14 3.4 (continued) 7.25 0 –18.83 7.31 3.8 8.15 0 –18.46 7.15 3.3 9.25 0 –18.70 7.56 3.4 10.35 0 –18.41 7.68 3.4 10.35 0 –18.34 7.96 3.4 11.45 0 –18.24 7.95 3.4 12.55 0 –18.16 7.90 3.3 13 0 –18.66 8.38 3.6 14.75 0 –18.12 8.35 3.3 16 0 –18.11 8.00 3.4 17.2 0 –18.69 8.49 3.5 18.35 0 –18.50 8.68 3.3 19.5 0 –18.53 8.23 3.3 20.65 0 –18.84 7.17 3.4 21.75 0 –18.94 6.50 3.4 23.25 0 –18.83 8.14 3.4 24.55 0 –19.25 7.95 3.5 27.15 0 –18.26 7.82 3.4 28.55 0 –18.05 8.09 3.4 29.65 0 –17.94 7.23 3.3 30.9 0 –18.14 7.46 3.3 32.1 0 –18.50 7.92 3.5 33.2 0 –18.34 7.97 3.4 34.3 0 –18.15 7.87 3.4 35.5 0 –18.08 7.60 3.5 36.7 0 –18.19 7.29 3.5 37.9 0 –18.24 7.31 3.4 39 0 –18.29 7.34 3.4 40.2 0 –17.95 7.23 3.4 42.4 0 –18.10 7.38 3.3 43.4 0 –19.21 7.08 3.7 44.5 0 –17.79 7.64 3.3 45.6 0 –18.07 7.36 3.3 46.5 0 –17.88 8.10 3.3 47.5 0 –17.95 7.83 3.3 48.5 0 –18.50 7.81 3.5 49.55 0 –17.73 7.47 3.3 50.65 0 –17.37 7.91 3.3 51.55 0 –17.75 7.25 3.3 Table 4. (continued)
within the reference range corresponding to the outer-limits of the ±1 SD range of spring and fall val-ues combined of the δ13C
corrected values of the Medi
-terranean sea krill (–18.9 to –17.5 ‰).
When excluding BP2, which is well outside the range of δ13C
correctedkrill values, all but BP8 are
cen-tered on the ± SD range of the Mediterranean spring krill mean value, and all but BP9 have few consistent values with fall Mediterranean krill δ13C. Fig. 4B
shows that some individuals have δ13C values
iso-topic values exceeding the range expected from the spring and fall Mediterranean krill δ13C values.
How-ever, even the most depleted values (–18.9 to –19.3 ‰) of the BPs 8 and 10 plates samples were not consis-tent with the δ13C
correctedsignature of krill sampled in
the Atlantic Ocean (–20.6 to –19.1 ‰).
Most δ15N plate values are also consistent with
spring Mediterranean krill δ15N mean value (Fig. 4A).
The main exception being the BP1 with a δ15N ex
-ceeding the δ15N signature expected from the fall
and spring Mediterranean krill isotopic signature. BP2 has intermediate δ15N values between fall and
spring Mediterranean krill δ15N. BPs 4 and 10 are the
only plates showing consistent δ15N values with both
fall and spring Mediterranean krill δ15N mean value.
All plates except BPs 1, 2, and 4 are characterized by δ15N values lower than expected from the spring and
fall Mediterranean krill δ15N signatures (Fig. 4C).
Assuming that the euphausid is a primary con-sumer (i.e. mostly herbivorous and omnivorous), a trophic level of 2 can be assigned to this species (e.g. Vander Zanden & Rasmussen 2001). Using mean val-ues for the whales and their euphausid prey in the formula proposed by Vander Zanden and Rasmussen (2001) for the trophic level value (TL):
TL = 2 + (δ15N
baleen– δ15Nuncorrected M. norvegica) / 3.4 (2)
we calculate a TL of 2.9 ± 0.3 (mean ± SD) for fin whales based on the annual mean δ15N
Mediter-ranean euphausids. The TL varies between 2.8 in fall and 3.0 in spring due to the effect of the seasonal δ15N variability observed in the euphausids. Using
the Atlantic euphausids δ15N values, a mean TL of
2.3 ± 0.4 (2.0 in fall and 2.5 for spring) can be esti-Fig. 2. Balaenoptera phy sa lus. Intra-individual stable carbon isotope values (expressed per ml) along the length of baleen plates of fin whales stranded at western Mediterranean coasts between 1975 and 2002. All plots represent W = 0 sampled whales. Grey areas represent the range of values comprising > 50% of the isotopic ratios of the whole dataset. The dashed vertical band in Panel BP3 suggests the weaning period. BP3 & BP4 were from the same individual but sampled at lateral and frontal sides
mated. The TL = 2.9 ± 0.3 calculated with the Mediterranean δ15N
uncorrected M. norvegicavalue is closer
to the TL = 3.2 estimated from the dietary analysis of Mediterranean fin whale by Kaschner et al. (2004).
Decadal trends in stable isotope signature The evolution of the keratin δ13C and δ15N from the
10 BPs of fin whales stranded along the Western Mediterranean coasts over a 27 yr span is presented in Fig. 5A,B. δ13C and δ15N mean values show
impor-tant changes between 1975 and 2002. Whereas δ15N
variances statistically significantly increase with time, the slight positive increase in δ13C variances is
not statistically significant (p > 0.68) from linear regression. We calculated the regression equation using the mean values of all BPs (Table 1). The linear fit shows a strong correlation between δ15N means
and years of collection (r2 = 0.58, n = 10, p = 0.01) and
a smaller one for δ13C (r2 = 0.29, n = 10). A polynomial
fit (third order) applied to both δ13C and δ15N means
increased the correlation between stable isotope evo-lution and years. The δ13C versus year fit shows a
sinusoidal curve and an isotopic shift in 1980 (Fig. 5A). The δ15N versus year ‘abruptly’ decreases
be tween 1975 and 1980 but shows less variation be -tween 1990 and 2002 (Fig. 5B).
Satellite tracking
Eleven fin whales were tagged with satellite-moni-tored radio transmitters off the Provençal coast from 1 August to 20 August 2003. Argos positions were obtained from 8 individuals over the course of 9 mo (Table 5). Seven individuals re mained in the north-western part of the Mediterra nean Sea through fall and winter, and 1 individual (tag 10842) moved into the Atlantic Ocean (Fig. 6).
DISCUSSION
Satellite telemetry provides evidence, that some fin whales migrate from the Medi terranean Sea to the Atlantic Ocean; however, most individuals remain within the western basin during fall and winter. Fig. 3. Balaenoptera phy sa lus. Intra-individual stable nitrogen isotope values (expressed per ml) along the length of baleen
6 7 8 9 10 11 12 L axis (cm) Fall Fall Spring Spring Atlantic Ocean Mediterranean Sea
C
0 10 20 30 40 50 60 70 –21 –20 –19 –18 –17 0 10 20 30 40 50 60 70 Spring Fall Spring Fall Atlantic Ocean Mediterranean SeaB
L axis (cm) BP1 BP2 BP3 BP4 BP5 BP6 BP7 BP8 BP9 BP10 M. norvegica 6 7 8 9 10 11 12 –17 –18 –19 –20 –21M. norvegica Atl. Ocean Spring 2001 M. norvegica Atl. Ocean Fall 2001 M. norvegica Med. Sea Spring 2004 M. norvegica Med. Sea Fall 2004
Grand-mean of all BP’s Means of individual BP’s BP2 BP1 BP8 Mediterranean M. norvegica δ13C and δ15N reference
A
Atlantic M. norvegicaδ13C and δ15N reference range
BP10 δ 15 N (‰) δ 15N (‰) δ 13C (‰) δ13C (‰)
Fig. 4. Meganyctiphanes norve
-gica and Balaenoptera phy sa lus.
(A) Nitrogen and carbon stable isotope ratios of the 10 baleen plates of stranded fin whales ( ) and of each individual ( ) com-pared with M. norve gica (krill) δ13C and δ15N values from the
Mediterranean Sea (h: spring; j: fall) and Atlantic Ocean (s: spring; d: fall). δ13C and
δ15N krill data represent trophic
enrichment corrected values (1 and 3.4 ‰, respectively) and non-lipid- extracted values. The boxes represent the Atlantic Ocean (
– – –
) and the Mediter-ranean Sea (——) krill refer-ence ranges that correspond to the outer-limits of the ±1 SD range of spring and fall values combined of the δ13Ccorrected
val-ues of the krill. Intra-individual (B) δ13C and (C) δ15N variations
Therefore this population is exposed, year-round, to heavy shipping traffic, as the 3 largest Mediter-ranean ports — Bar ce lona, Marseille, and Genova — are contiguous to the main fin whale summer forag-ing grounds (Forcada et al. 1996, Monestiez et al. 2006, Cotté et al. 2009).
The stable isotope analyses of baleen plates reveal that most stranded fin whales in the northwestern Mediterranean Sea did not present δ13C oscillations.
Assuming a + 3.4 ‰ trophic enrichment factor for δ15N
and +1 ‰ for δ13C, these results suggest year-round
residency within the western Mediterranean Sea. Few δ13C values were either en riched (BP2) or
depleted (BP8, BP10) compared to the δ13C
Mediter-ranean krill reference range (Fig. 4B).
Both δ13C and δ15N variations along
the length of BP2 may be cyclical, suggesting that BP2 fin whale may regularly visit different foraging grounds, possibly by alternating between the northwestern Medi -terranean basin (where this whale was ultimately killed in a ship colli-sion) during spring– summer seasons (31 and 12 cm; Fig. 4B) and unidenti-fied waters (where it fed at the same high trophic level compared to the other fin whales) (~21 cm). However, the high δ13C values of BP2 suggest
that this whale was unlikely to forage in the Atlantic Ocean. δ13C of BP10
and to a lesser extent BP8, which were both sampled in the Malaga region, also exhibit ‘cyclic’ patterns (Fig. 4B). The high δ13C ranges
mea-A
B
–19 –18 –17 1970 1975 1980 1985 1990 1995 2000 2005 δ 13C ( ‰ ) 6 7 8 9 10 Year of collection δ 15N ( ‰ ) 1970 1975 1980 1985 1990 1995 2000 2005Fig. 5. Balaenoptera phy sa lus. Variations of (A) δ13C and (B)
δ15N values of 10 fin whale baleen plates versus year of
collec-tion, means ± SD. The line curves fitting the data are linear (δ13C = –0.02 × + 20.14; r2= 0.29; δ15N = –0.07 × Years + 142.5;
r2= 0.58) and cubic polynomial regressions (δ13C = 0.0004 ×
Years3– 2.6145 × Years2+ 5199 × Years – 3 × 10⁶; r2= 0.70;
δ15N = –8 × 10–05× Years3+ 0.4886 × Years2– 981.82 × Years +
657624; r2= 0.84)
PTT Date Location Message Distance deployed (d) (d) (km) 10836 8/12/03 145.1 192.7 913 10838 8/18/03 278.0 296.0 4260 10842 8/16/03 138.6 138.6 4057 23029 8/18/03 45.1 57.6 1079 23032 8/18/03 43.3 44.3 405 23033 8/4/03 140.4 140.4 761 23041 8/8/03 175.3 228.8 419 23042 8/16/03 301.0 394.0 1461 Averages 158.3 186.6 1669 Table 5. Balaenoptera phy sa lus. Tag identification number (PTT), deployment dates, number of days following tagging with locations, duration of operation (message days), and minimum distances travelled by 8 fin whales tagged in the northwestern Mediterranean Sea during August 2003.
TAG 10842: individual moved into the Atlantic Ocean
Fig. 6. Balaenoptera phy sa lus. Argos locations of 7 individuals tagged with
satellite-monitored radio transmitters off the Provençal coast from 1 August to 20 August 2003. Tags (see Table 5): = 10838, = 23029, = 10838, = 23032, = 23042, = 10836, = 10842, = 23041. The tag 23032 is not shown, as only 2 locations were obtained from this individual over a 43.3 d period and within
sured along the length of BP8 and BP10 (1.3 and 1.9 ‰, respectively) suggest a broader foraging area for these individuals than for the other ones (range: 0.6 to 1.1 ‰). However, their δ13C suggest that these
individuals spent most of their time in the Mediter-ranean basin feeding alternatively on spring and fall resources and exhibited short shifts marked by signif-icant δ13C depletion. These depleted δ13C values are
intermediate between the Mediterra nean and At -lantic krill δ13C values, suggesting possible short
excursions in the Atlantic Ocean or the nearby Strait of Gibraltar. The less-depleted δ13C values observed
in the baleen plates compared to the ex pected Atlantic Ocean δ13C values can be explained either
by the fact that those excursions were not long en -ough to allow the plate to equilibrate with the At -lantic prey δ13C values or that the fin whales
restricted their Atlantic excursions to the Atlantic side of the Strait of Gibraltar, an historical Spanish whaling ground in the 1920s and 1950s and consis-tent with the data provided by satellite tracking (San-pera & Aguilar 1992; Fig. 6). In this hypothesis, the ‘Gibraltar-Atlantic’ prey δ13C values would be
inter-mediate between Mediterranean and Atlantic values. As fin whales display maternally directed site fidelity, we can question the effect of the past intensive whal-ing on the migration patterns of this population. In the absence of such intensive whaling we would expect much higher variations in stable isotope val-ues with time in the baleen of these whales.
As only 2 (BP10, and, to a lesser extent, BP8) out of the 10 baleen plates exhibited such ‘cyclic’ patterns in δ13C, this behavior does not seem to prevail in this
fin whale population. Interestingly both fin whales from the Malaga area show indications of such migratory pattern, suggesting that fin whales en -countered in this region may be in transit between the Mediterranean Sea and the Atlantic Ocean. Indeed the satellite tracking data of the individual that left the Mediterranean Sea (TAG 10842) revealed that this fin whale migrated to the Atlantic Ocean along the Spanish coastline (Fig. 6). In addi-tion to satellite tracking that allows precise locaaddi-tion of individual fin whales over relatively short periods of time (mo), the stable isotopes measured along the baleen plates provide an insight on the main foraging regions over long-term periods (Hobson et al. 2004). However, precise reconstructions depend on BP growth rate data. A first attempt at estimating growth rate on Mediterranean fin whale is made using BP3. The concomitant changes of both δ15N and δ13C
between 20.5 and 17.6 cm on BP3 (Figs. 2 & 3) could result from a shift in trophic level due to prey change
or correspond to the weaning transition period from maternal milk to prey (Hobson & Schell 1998, Hob-son & Sease 1998). Though small isotopic changes are observed (~1 ‰), our δ13C shifts and depleted
δ15N observed at ~20.5 cm might suggest weaning
age (7 mo in fin whales; International Union for Con-servation of Nature (IUCN) 1991) was reached, the juvenile shifting to nutritional independence and feeding at a lower trophic level than adults (Jenkins et al. 2001). However there is a very real possibility that some substantial, unknown amount of wear may have oc curred for BP3, suggesting that the cal-culated growth rate of ~20.1 cm yr–1(32.2 – 20.5 cm =
11.7 cm / 7 mo × 12 mo yr–1) correspond to a lower-limit growth rate for this female BP3–BP4. Interest-ingly, BP3 growth rate (~20 cm yr–1) is within the
range of those ob served for adult Minke whales (12.9 cm yr–1; Mitani et al. 2006); bow head whales
(20 cm yr–1or less; Schell et al. 1989a,b), and
south-ern right whales (2.7 cm yr–1; Best & Schell 1996). Applying our minimum growth rate estimate, BP3 whale would be ~1.6 yr old. Because fin whales are believed to reach sexual maturity at ~6 to 12 yr, it is likely that the baleen of the adult female BP3 (Table 1) did in fact experience significant erosion at the distal end; otherwise the length of the ba leen for a whale of at least 6 yr of age should have been ~120 cm at a minimum. In conclusion, it is likely that erosion would cause the underestimation of BP3 baleen growth rates, and hence this estimate is to be viewed as a minimum growth rate value. Using the minimum growth rate value (20 cm yr–1), the multi
δ13C cycles observed on BP10 and BP8 suggest that
these individuals were regularly alternating between different foraging grounds, with individuals travel-ling once or twice a year from the Mediterranean Sea in the direction of the Atlantic Ocean, and we specu-late these whales remained in the Gibraltar Strait – Atlantic continuum.
A 3 ‰ order enrichment is expected between the δ15N signature of Meganyctiphanes norvegica and
fin whales if the whales are feeding exclusively on this prey. We found an enrichment of 2.6 to 3.5 ‰ (mean ± SD = 3.2 ± 0.8) between Mediterranean krill and baleen plates, and 0.2 to 1.8 ‰ between Atlantic krill and baleen plates. If M. norvegica was the year-round predominant prey of our study of fin whale populations, the observed δ15N oscillations should
primarily reflect migratory patterns or seasonal change in krill δ15N signature. Furthermore, our krill
data show an increase of 0.9 to 1.6 ‰ during spring to late summer transition in the Mediterranean Sea and Atlantic Ocean, respectively. Similarly Bode &
Alvarez-Ossorio (2004) reported a zooplankton δ15N
increase by more than 3 ‰ during the spring–sum-mer transition, partly due to the nitrate depletion during phytoplankton growth. Accordduring to that hypo -thesis, and considering a 3.4 ‰ δ15N enrichment per
trophic level, most fin whales in the present study could have only fed on krill in Atlantic in winter when krill δ15N is depleted. However the
geographi-cal source given by the δ13C does not support that
hypothesis (see also the following 2 subsections). However, an enrichment of < 3.4 ‰ was suggested in several studies (Ostrom et al. 1993, Abend & Smith 1997). An 2.4 ‰ enrichment factor for the δ15N would
lead to different interpretations of the migration pat-tern. For instance BP1 and BP2 δ15N values would
suggest the ingestion of only Atlantic krill and many values of the other BPs would indicate that whales feed on both Mediterranean Sea and Atlantic Ocean. Again the geographical source given by the δ13C
does not corroborate such a scenario.
Hence potential mechanisms of decoupling carbon and nitrogen isotope signatures should be suggested. According to Hobson et al. (2004), migration and fast-ing could be such a mechanism. If whales migrate in winter and fast in Atlantic waters, highest δ15N are
expected, and carbon from stored fats is used for baleen formation. It might show that Mediterranean summer diet δ13C values determine the long-term
substrate values for baleen formation. These hypo -theses imply that Balaenoptera physalus has a well-identified fasting period during winter. To our knowl-edge, no pattern of seasonal period of fasting has been reported in the literature.
Minagawa & Wada (1984) found a 3.4 ‰ enrich-ment factor for δ15N when using whole crustacean, as
was the case in the present study. Furthemore, Hob-son et al (1996) found a mean value of 3 ‰ enrich-ment factor for δ15N between the prey and keratinous
tissues such as whiskers, nails, and hair. We might ex -pect a similar enrichment factor between the whole krill prey and keratinous baleen plates of fin whales. Hence we suggest that a 3.4 ‰ enrichment factor is close to the actual number and believe that Meganyc-tiphanes norvegica is the predominant prey of this population of fin whales; therefore it follows that the observed stable isotope oscillations of BP10 and 8 pri-marily reflect migratory patterns.
We cannot exclude that Mediterranean fin whales are also feeding on other unknown prey species. Ac -cording to Canese et al. (2006), zooplankton sam-pling collected in winter near Lampedusa, where fin whales fed, indicates the presence of Nyctiphanes couchi. However we can rule out that Mediterranean
fin whales mainly feed on small mesopelagic fishes such as sardines or anchovies, as the whales occupy the same mean trophic level as these fish species (mean δ15N ranging from 7.69 to 7.87; Pinnegar et al.
2003).
Nonetheless, higher δ15N values were exhibited in
BP1, suggesting that part of this whale’s diet could be composed of prey from higher trophic levels over ex -tended periods of time. However, taking into account the year of stranding (1975), the BP1 δ15N values can
also suggest that the nitrogen isotopic signature at the base of the food chain was higher 27 yr ago.
Pinnegar et al. (2003) and Pauly et al. (1998) re -ported a decline in the mean trophic level of landings for the western Mediterranean Sea and interpreted it as ‘fishing down the marine food web’, mostly through diversification and (or) substitution in the species being targeted (marketed), as might be ex -pected where the supply of the preferred target spe-cies has begun to dwindle (Pinnegar et al. 2002). In addition to this decline, the temporal decrease in δ13C and δ15N may also provide some evidence of
significant environmental changes affecting the Mediterranean Sea.
Schell (2000) reported a depletion of δ13C in Bala
-ena mysticetus plates from the Bering Sea between 1947 and 1997. The δ13C depletion of the Bering Sea
whales (–0.05 ‰ yr–1) during the last 30 yr is about
twice as much as the one previously reported for the Indian Ocean (–0.02 yr–1; Gruber et al. 1999) and the
one found in the plates from the Mediterranean fin whales in the present study (–0.02 ‰ yr–1) between
1975 and 2002. The δ13C signature of the baleen
plates over the study period suggests increasing δ13C
values between 1975 and 1980 and 1996 and 2002, and decreasing δ13C between 1980 and 1996 (Fig. 5).
Interestingly, Demirov & Pinardi’s (2002) simulations of the interannual surface Mediterranean circulation from 1979 to 1993 identify 2 periods, 1981 to 1987 and 1988 to 1993, which differ in precipitation and winter wind regimes. Moreover, Conversi et al (2010) show important changes of the plankton at the end of the 1980s in the Mediterranean basins and provide analyses linking local, regional, and basin scale hydrological properties with 2 major indicators of large scale climate, the North Atlantic Oscillation (NAO) index and the Northern Hemisphere Temper-ature index, suggesting that the Mediterranean shift is part of a larger scale change affecting the northern hemisphere.
The driving force explaining the general carbon isotopic depletion patterns may reflect global hemi-spheric changes. Schell (2000), assuming constant
dissolved CO2 concentration, attributed the δ13C de
-pletion in the Bering Sea to a 30 to 40% decrease in the marine productivity. An alternative hypo -thesis was proposed by Cullen et al. (2001) who sug-gested that increased CO2 levels could also explain
the δ13C depletion. Indeed, the atmospheric CO 2
levels in creased significantly due to fossil fuel burn-ing, land changes, and cement manufacture (IPCC 2007) all resulting in a significant decrease of the δ13C
atmosphericCO2(Keeling et al. 2001). However, in a
recent study, Williams et al. (2011) interpreted the δ13C shift of the Bering Sea as a response to the
increased upwelling intensity linked to the Aleutian low intensification.
In region off the upwelling the 13C depleted atmo
-spheric anthropogenic CO2is partially absorbed by
the ocean surface waters, thus decreasing the iso-topic composition of the marine inorganic carbon pool. Known as the Suess effect (Gruber et al. 1999, Tanaka et al. 2003), this anthropogenic CO2 input
affects the isotopic signature of primary producers and consequently of marine food web, thus possibly explaining in part the observed baleen plate δ13C
shift noted herein.
Higher marine CO2content may favour the
photo-synthetic rate, but such conditions would lead to a δ13C decrease and δ15N increase (predominance of
as similatory nitrate reduction increases phytoplank-ton δ15N). This phenomenon has a direct effect on the
isotopic signature of primary producers and conse-quently on the marine food web, explaining the baleen plate δ13C shift evidenced on a global scale
(Cullen et al. 2001). However, the present δ15N
val-ues (–0.07 ‰ yr–1) were as significantly depleted as those observed in the Bering Sea (–0.06 ‰ yr–1; see
Schell 2000 and comment by Cullen et al. 2001). This decrease in δ15N is intriguing, but poorly
docu-mented as an ecosystem indicator (Lee et al. 2005). Atmospheric N2would be used as a nitrogen source
for primary production (diazotrophy), otherwise the microbial loop system may become more active, recy-cling isotopically light NH4+used by phyto plankton.
However, the most likely mechanism to explain such a rapid change in the Mediterranean Sea would be a major shift of the nutrient balance in response to increased anthropogenic input by coastal run off, river discharge and atmospheric nitrogen compounds. Though additional nitrate may stimulate the biological pump, especially for the Mediterranean Sea, which is often considered as a nitrate depleted sea, this anthro-pogenic forcing can also significantly de crease the productivity of the ecosystem by altering the Redfield ratios (increase of the N:P and de crease of the Si:N
ra-tios; Béthoux et al. 2002) and consequently modify the marine community (Turner et al. 2003). Data from the Gulf of Lions shows an N enrichment with respect to P due to the Rhone River influence (Diaz et al. 2001). The changes in N:P:Si ratios observed since the early 1960s (Béthoux et al. 2002) could lead to a decreased photosynthetic rate or a phytoplankton shift from a dia tom-dominated ecosystem towards a non-siliceous one and a more ‘regeneration- dominated’ community (Marty et al. 2002).
Superimposed on this declining trend, the potential impact of the decadal changes of the NAO cannot be ruled out, causing drier (normal) Mediterranean con-ditions during the negative (positive) phase. Since 1980, except in 1996, the NAO has been positive. As a result, the isotopic decline between 1980 and 2002 cannot be attributed to the NAO alone. A complex combination of circulation alteration, temperature increase (Goffart et al. 2002, Conversi et al. 2010) and nutrient availability, anthropogenic impact are likely affecting marine communities of the Mediterranean sub-basins.
The combination of satellite tracking and stable iso-tope signature methods reveals some major aspects of Mediterranean fin whale foraging, indicating that most individuals might be year-round residents of the northwestern Mediterranean Sea and that the largest predator of the Mediterranean Sea has a trophic level equivalent to that of anchovies and sardines.
The observed decrease in δ15N is an important eco
-system indicator supporting the assumption of a changing nitrogen cycle with still unclear effects (Duce et al. 2008). More efforts need to be directed toward understanding the nitrogen biogeochemical cycle. Conversely, the change in δ13C reported is
consistent with previously well-described studies. The de crease in primary production level or shifts in the primary producers are likely to influence the Medi terranean food web and consequently fin whales. How ever, the long term consequences re -main unknown.
Acknowledgements. This research was supported through
grants from the Office of Naval Research, awards N0014-02-1-0885 and N0-176A, and by the Ministère de l’Environ-nement et du développement durable Direction Nature & Paysage (Parc National de Port-Cros). We thank the Centre de Recherche sur les Mammifères Marins and ‘French stranding network’ and the Centro de Recuperación de Especies Marinas Amenazadas de Andalucía (CREMA); J. M. Bompard, J. L. Fabre, and J. Salazar, who provided baleen plates; L. Irvine and M. L. Mate for field assistance during tag deployment, T. Follett for figure preparation; and Y. Cherel and G. Boehlert for their comments on earlier man-uscript drafts. We thank the 2 anonymous re viewers who