Publisher’s version / Version de l'éditeur:
Vous avez des questions? Nous pouvons vous aider. Pour communiquer directement avec un auteur, consultez la première page de la revue dans laquelle son article a été publié afin de trouver ses coordonnées. Si vous n’arrivez pas à les repérer, communiquez avec nous à [email protected].
Questions? Contact the NRC Publications Archive team at
[email protected]. If you wish to email the authors directly, please see the first page of the publication for their contact information.
https://publications-cnrc.canada.ca/fra/droits
L’accès à ce site Web et l’utilisation de son contenu sont assujettis aux conditions présentées dans le site LISEZ CES CONDITIONS ATTENTIVEMENT AVANT D’UTILISER CE SITE WEB.
3rd International / 9th Construction Specialty Conference (CSCE) [Proceedings],
pp. 1-10, 2011-06-14
READ THESE TERMS AND CONDITIONS CAREFULLY BEFORE USING THIS WEBSITE. https://nrc-publications.canada.ca/eng/copyright
NRC Publications Archive Record / Notice des Archives des publications du CNRC :
https://nrc-publications.canada.ca/eng/view/object/?id=5388add4-95ca-498d-83ec-e4e096ac77ea
https://publications-cnrc.canada.ca/fra/voir/objet/?id=5388add4-95ca-498d-83ec-e4e096ac77ea
NRC Publications Archive
Archives des publications du CNRC
This publication could be one of several versions: author’s original, accepted manuscript or the publisher’s version. / La version de cette publication peut être l’une des suivantes : la version prépublication de l’auteur, la version acceptée du manuscrit ou la version de l’éditeur.
Access and use of this website and the material on it are subject to the Terms and Conditions set forth at
Production simulation for prefab housing facilities
Produc t ion sim ula t ion for pre fa b housing fa c ilit ie s
N R C C - 5 3 9 9 7
X i e , H . ; S h e n , W . ; H a o , Q . ; Y u , H . ; T a n g , Y .
A u g u s t 2 0 1 1
A version of this document is published in / Une version de ce document se trouve dans:
3rd International / 9th Construction Specialty Conference (CSCE), Ottawa, ON.,
June-14-17, 2011, pp. CN-189-1 – CN-189-10
http://www.nrc-cnrc.gc.ca/irc
The material in this document is covered by the provisions of the Copyright Act, by Canadian laws, policies, regulations and international agreements. Such provisions serve to identify the information source and, in specific instances, to prohibit reproduction of materials without written permission. For more information visit http://laws.justice.gc.ca/en/showtdm/cs/C-42
Les renseignements dans ce document sont protégés par la Loi sur le droit d'auteur, par les lois, les politiques et les règlements du Canada et des accords internationaux. Ces dispositions permettent d'identifier la source de l'information et, dans certains cas, d'interdire la copie de documents sans permission écrite. Pour obtenir de plus amples renseignements : http://lois.justice.gc.ca/fr/showtdm/cs/C-42
Production Simulation for Prefab Housing Facilities
Helen Xie1, Weiming Shen1, Qi Hao1, Haitao Yu2, Yiliang Tang1 1
Institute for Research in Construction, National Research Council 800 Collip Circle, London, Ontario N6G 4X8
2
Landmark Home (Edmonton) Inc., Edmonton, Alberta
Abstract: In order to compete in the residential housing market, prefab builders are required to build
custom homes at a faster pace. As a result, they are facing many challenges in their production facilities including various product configurations with different product flows that have an impact on their productivity. Computer simulation is an ideal technology for exposing underlying problems in the production line and identifying the optimal solutions. This paper presents a practical simulation tool that has been developed for prefab builders to conduct what-if analyses for productivity improvements. A simulation model is built with control logics of the process flows. A statistical analysis module is developed to identify and analyze critical process parameters. A database is modeled to contain configuration information for production lines, processes and products that can accommodate various changes that are required for load balancing in production lines. The tool can simulate various house configurations and panel sequences, and provide animation for production processes. It can be used in both the production planning and operation stages to enhance productivity through load balancing and mixed model sequencing. Further developments can be realized on automatically mixed model sequencing to achieve production optimization.
1. Introduction
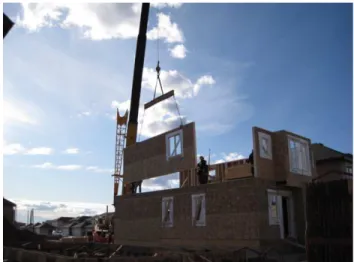
In the panelized prefab housing sector, timber-framed panels are built on a production line inside a prefab facility and erected on-site (as shown in Figure 1). This industrialized home building technology has many advantages over conventional construction methods (Friedman and Cammalleri 1993). Panels assembled under factory-controlled conditions yield a higher quality product, generally resulting in more energy efficient homes. Due to the quick and efficient on-site assembly, the effect that poor weather conditions can have, particularly in cold or damp climates, is reduced, which again leads to a higher quality product. The lead time usually required to build a home is also reduced which results in increased customer satisfaction.
Despite the advantages of prefab housing, to compete in the current market, prefab builders are required to build custom homes at a faster pace. Due to various panel sizes associated with custom homes and the fact that both interior walls and exterior walls are built in the same production line, the panel production process has to deal with unbalanced workloads on the prefab production line. The unbalanced workload causes starvation and/or blockages on the production line, negatively affecting productivity. Simulation is an ideal technology for exposing underlying problems in the production line and identifying the optimal solutions. Although extensive research in assembly line performance has been conducted, little attention has been paid to the panelized prefab production line. This paper presents a practical simulation tool that has been developed for prefab builders to conduct what-if analyses for productivity improvements.
The rest of the paper is organized as follows. Section 2 discusses the characteristics of the prefab production line and its performance evaluation. Section 3 provides a literature review on production line balancing and model sequencing, and a simulation-based approach. Section 4 describes the proposed simulation tool. Section 5 presents simulation what-if analyses. Section 6 provides a brief conclusion and discusses future research directions.
CN-189-2
Figure 1: Prefab panels erected on-site
2. Problem Description
According to a classification of assembly lines (Boysen et al. 2008), a panelized prefab production line is a mixed-model asynchronous assembly line. The prefab production line consists of multiple stations arranged in a serial manner along the flow of the line, where panels are transferred from station to station. Since all stations on the line are stationary, its tasks should be completed at the current station before a panel can be transferred to the next station. There is no buffer between stations.
Panels of various types, configurations and sizes are assembled through the same production line and the different panel characteristics typically lead to variations in processing times. Wall panels are usually distinguished by their interior walls and exterior walls. They are also differentiated by having open and closed walls. Processing times for each panel on each station are different: additional tasks may be preformed depending on the panel types; different times may be required depending on panel configurations and sizes. Processing times under manual work are often subject to stochastic deviations, as the performance of workers depends on a variety of factors, like motivation, work environment or mental and physical stress (Tempelmeier 2003).
Moreover, stations on the production line are not identical due to specialized equipment that is used (Falkenauer 2005). Hence, it is not always possible to move tasks performed at one station on to another station. As a result, workload (or mean processing time) among stations is unbalanced.
The flow of panels on the production line also depends on panel characteristics. An open wall often exits the production line early since panel enclosure is not required. An exterior wall needs to go through additional stations for foam insulation. In some cases, parallel stations are arranged for alternatively processing identical work contents to compensate for large processing times on a single station.
Setup time should be considered since panels with different widths require fixture adjustments. The panel sequence in the production line effects the setup time.
In the asynchronous assembly line, a panel is transferred to the downstream station as soon as all required tasks are completed and the downstream station is available. Each station decides on transference individually (Buzacott and Shanthikumar 1993). A panel is launched into the production line using a pull strategy. Whenever a panel is completed and moved to the next station, a new panel is launched at the first station.
The objective of this work is to improve productivity performance on the prefab production line. Typical productivity performance measures throughput (number of units produced per unit time), equipment utilization (percentage of time a machine is actually busy), and average flow times (average time a unit spends in the system), among others (Altiok 1997). Through the literature review in the following section, we will identify the approach to improving productivity.
3. Literature Review
In a mixed-model assembly line, due to large product variety, blocking and starvation are the main factors causing loss of productivity. Blocking causes stoppages at work stations due to a lack of space in the downstream stages. Similarly, starvation may exist, causing idleness in stations due to a lack of jobs to process in the upstream stages. The effective utilization of a mixed model assembly line requires line balancing and model sequencing. Line balancing involves the assignment of tasks to stations to evenly distribute the total daily or shift workload between stations, while respecting precedence constraints. Model sequencing involves the assignment of the order of models entering the assembly lines, to level the workload (total assembly times) at each station and keep a constant rate of usage of every part used in the line (Miltenburg 1989).
Research has been carried out considering line balancing and model sequencing separately, with line balancing first and then model sequencing following (Bard et al. 1992). The rationale is that the decisions of line balancing and model sequencing are made in different time frames. The line balancing decision typically has a long to mid-term planning horizon of several months, and a daily model mix is not known at the point in time (Boysen et al. 2009). On the other hand, the short-term decision problem of model sequencing is heavily interdependent on the long to mid-term assembly line balancing problem. Some studies have proposed simultaneous consideration of line balancing and model sequencing (Kim et al. 2000; Uddin et al. 2010).
Both of the above approaches assume that line balancing can be achieved. However, in prefab production lines, the processing times of stations are very different in length due to specialized equipment restrictions. Therefore, it is very difficult to achieve effective line balancing for them (Zhao and Ohno 1997). With unbalanced mean processing times, it is inevitable for blocking and starvation to occur on such production lines. However, stochastic processing times make it difficult to model the blocking and starvation in real life complex production systems. The approximation approach was used in modelling blocking and starvation for large scale problems, but processing times are considered as deterministic (Zhao and Ohno 1997).
Much of the research done on the stochastic assembly line design problem has used a simulation approach (Smunt and Perkins 1985). Pappert et al. (2010) proposed a framework for simulation based assembly line workforce scheduling. Seppanen (2005) presented an Arena-based operator-paced assembly line simulation model. Xie et al. (2007) described a simulation approach on model sequencing for mixed model assembly lines. Das et al. (2010) developed a simulation approach to evaluating assembly line balancing with variable operation times. Nasereddin et al. (2007) described an automated approach for developing discrete event simulation models for the modular housing industry. This paper uses a simulation modelling approach for line balancing and model sequencing on the prefab production line considering unbalanced mean processing times.
4. Simulation Modelling
The objectives of the proposed simulation tool are to achieve: • Realistic simulation to reflect the actual process;
• What-if analyses for line balancing by adjusting resource and model sequencing with a workload- oriented approach under unbalanced mean processing times.
CN-189-4
The goal of the simulation program is to provide a supporting tool for line balance analysis and panel sequence optimization. To this end, it is essential to accurately record the time spent by each panel at each station. However, it is often a challenge to know the exact time when manual labour work is involved in the process. When there is a blockage or starvation in the production line, in addition to the processing times, the time spent in a station usually includes waiting time and idle time, which is difficult to obtain using an analysis model. The advantages of the simulation program are two-fold: the ability to model the processing time variance by a probability distribution and the ability to model the waiting time and idle time in the blockage and starvation situation.
A probabilistic simulation model is required to capture the randomness of processing times used in actual operations, which partially leads to a waiting time and an idle time at each station. The simulation model should well represent actual working conditions by simulating processing times, waiting times and idle times. Based on these simulated times at each station, we can derive a cycle time for each panel and ultimately an average cycle time for the production line.
Discrete-event simulation is chosen as it is capable of modeling the variability of the production line. The AnyLogic simulation software tool (AnyLogic 2011) is used as the development platform. A simulation model was developed based on the operational conditions and the following assumptions:
• For each panel, there are several tasks performed at each station. Time probability distribution is applied at the task level instead of the station level. The rationale is that all panel types use the same production line, and a station may perform a different set of tasks depending on panel types. The time difference will be significant at a station for different panel types. The probability distribution applied at a task level will de-couple the effects on the time variation for each task from the effects of mixed panel types requiring a different set of tasks.
• The task times can be obtained by either field time studies or calculations, according to equipment specifications. Since the simulation model is built before the actual productions, normal task times for various tasks are derived from equipment specifications. These normal task times are valuable for pre-launch load balance analyses. As the production is phased in, the normal task times can be easily modified in a database to reflect the actual production status. • An unscheduled equipment breakdown and scheduled preventive maintenance can be simulated
by suspending a station operation. The rationale is that these events are unlikely to have occurred in the simulation period, which usually ranges from one day to one week. Hence, these events would be better simulated in a manually controlled manner.
4.1 Simulation Logic
This simulation model uses entities (products) to simulate panel movement through the production line, while stations represent the working station/equipment which performs tasks on the entities (products). Entities (products) are created by product sources where panel properties and instructions on which stations they should flow through and the task lists and task times at each station are then assigned. Stations are designed mainly to simulate the time delay for performing tasks. The model uses pull strategy for modeling the production line, where a product is restrained from entering a station until the previous product is released to the next station.
The simulation model is built in such a way that panels of different types move along their flow paths. Some of the flow paths are fixed, and panels always move from one station to another station. Some other flow paths are dynamically determined by panel types and properties. The third category is stochastic, and panel movements are determined by station availability or priority.
Panel flow paths are controlled by either connectors or specified built-in stations. For the fixed flow path, a connector is used to connect two stations.
On the dynamic flow path, a “Fork” station is designed based on a generic station. It uses one input and two outputs, and makes exit decisions based on incoming panel types and properties. A “Merge” station combines two sub-products to form one product. The “Merge” station is used for panels requiring windows. A window frame has to be ready before a panel and the matched window frame can be assembled.
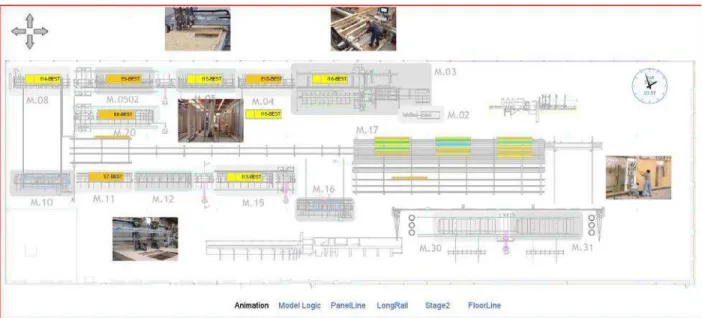
On the stochastic flow path, a “Resource” station is used to deal with resource constraints (work crew) so that the tasks at a station are not performed until a work crew is available. The resource station is applied to such stations where only one work crew is available for working at two parallel working stations. The animation interface for the prefab panel production is shown in Figure 2.
Figure 2: Prefab panel production animation
4.2 Task Times
One of our major tasks is to estimate the task time, according to equipment specifications. The process to calculate the task time for each panel at each station is rather complex, since there are various panel types, which require different process flows with a different set of stations involved. In addition, each station may include a different set of tasks depending on the panel types. The time for each task also depends on the panel properties.
A probability distribution is applied to each individual task for each panel when a panel flows through the stations. This approach provides flexibility to accurately record times for panels requiring different tasks in the same station. Currently, since this simulation model is built before the actual production, it is impossible to collect any experimental data. Hence, we choose the triangular probability distribution in the absence of real data.
Information related to a task time and its probability distributions are defined in a database. Since the task time is closely related to the panel properties, which are variables for each panel, a unit task time with related factors for every task at every station is provided in this table. An operator is also specified to link with a particular formula required for calculations. A task probability distribution type and its related parameters can also be defined in this table. Currently a triangular distribution is selected for the simulation. The values in triangle_a and triangle_b are the percentage of the range applied to the task time, instead of the unit task time. The data in this table may be modified in validating the simulation
CN-189-6
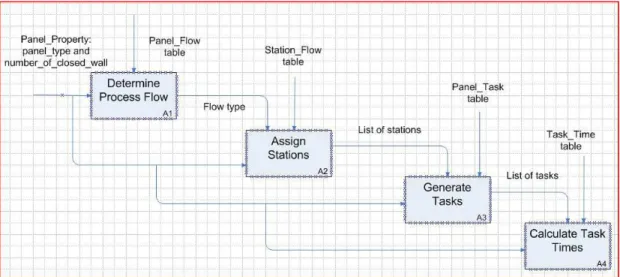
model with actual production. Additional tasks can also be added as long as a proper operator is assigned. The process to calculate the task times is shown in Figure 3.
Figure 3: Calculating task times
4.3 Process Parameters
Process parameters contain information related to time, sequence, station utilization, etc. The time information may include task times, task time probability distributions, processing times, waiting time, idle time, and cycle time. Task times, probability distributions, and sequence are system inputs. Processing time, waiting time, idle time, cycle time and station utilization are system outputs.
During a simulation run, the system records data for statistical analyses. For each station, the system records the processing time (working time in program interface) and waiting time for each panel passing through a station. The processing time is the simulated time (with probability) taken for performing all the tasks at this station. The waiting time is the simulated time that the panel waits until the next station becomes available. In addition, the system also records the start time and end time for each panel. A total idle time and station utilization can then be derived from the recorded data. Idle time is the time a station waits for the next panel to arrive. The system also records the station’s stop time, which simulates repair/maintenance time. A station can be suspended or resumed manually by pressing a suspend/resume button.
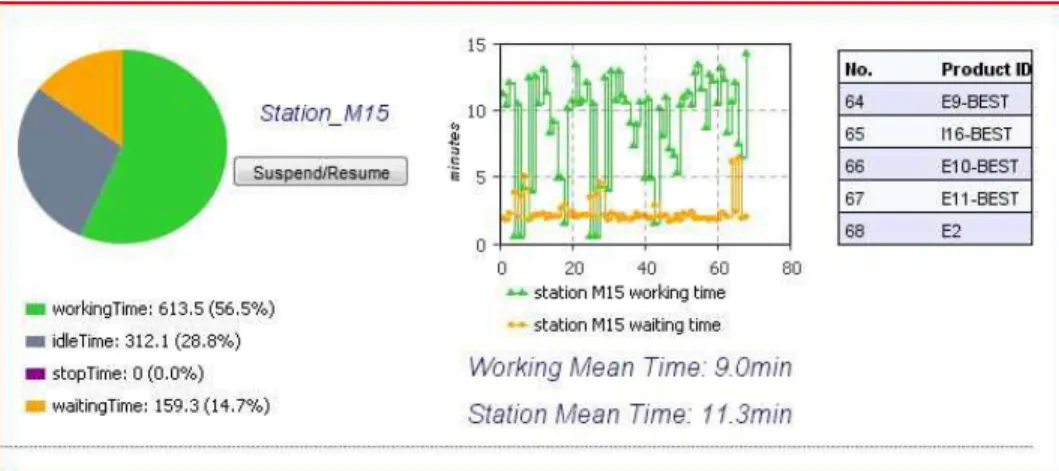
Statistical information at the station level is shown in figure 4. On the left side, a pie chart presents working time, waiting time, idle time and stop time. Station utilization is the working time divided by the total of working time, waiting time, idle time and stop time. It is presented in the bracket following the working time.
A line graph in the middle presents working time and waiting time for each panel passing through the station. It also presents working mean time and station mean time. The working mean time represents the average working time for all panels in this station. The station mean time represents the average working time and waiting time for all panels in this station. The table on the right side shows the latest five panels that passed through the station with their sequence numbers and panel IDs.
Figure 4: Statistical analyses for a station
Cycle time is one of the most important performance measures for a production line. It represents the productivity of the production line. For each panel, a cycle time is calculated by dividing the total time it spent in the line by the number of stations it passes. The system cycle time is the average cycle time for all panels that passed through the system.
Figure 5: Throughput and time in system distribution
Throughput and statistics on time spent in system distribution are also presented in the statistical analysis results (Figure 5). The throughput represents the total number of panels produced in the simulation. The time spent in system distribution represents the time a percentage of panels are spent in the production line. In this graph, the majority of the panels spent between 50-200 minutes in the production line. This is another performance indicator of the production line.
4.4 Terminating and Steady-State Simulations
When analysing simulation output data, a distinction is made between terminating simulations and steady-state simulations. A terminating simulation is one for which the desired measures of system performance are defined relative to the interval of simulated time. A steady-state simulation is one for which the measures of performance are defined as limits as the length of the simulation goes to infinity (Lay and Kelton 1982). Ideally, the production line simulation is a steady-state simulation. However, in reality, we intend to get the simulation results by simulating a number of houses due to the fact that each house is custom-built. Hence, we consider the simulation of the production line as a terminating simulation. In such a case, simulation outputs explicitly depend on the state of the simulated system at time 0. It is recognized that there are other ways to compensate for the initial conditions, such as creating a dummy file containing initial panels as the initial conditions of the simulation. However, the dummy file
CN-189-8
may not truly reflect the initial conditions for the simulation. In this study, we assume that all stations are available and there are no remaining panels before the first panel enters the line. To compensate for this initial condition, we start to time each station when the first panel enters the station, and end it as soon as the final panel leaves the station.
5. Simulation What-if Analyses
Performance can be improved through line balancing and panel sequencing with cycle times as the performance measure. Since the prefab panel production line consists of several pieces of specialized equipment, and with this restriction, the mean processing times are unbalanced among the stations. However, line balancing can be improved by allocating more resources working on the bottleneck station. The cycle time reduction can also be achieved through panel sequencing. With the simulation tool, what-if analyses can be carried out for various panel sequences to find a better sequence. A sequence policy can be derived with production data.
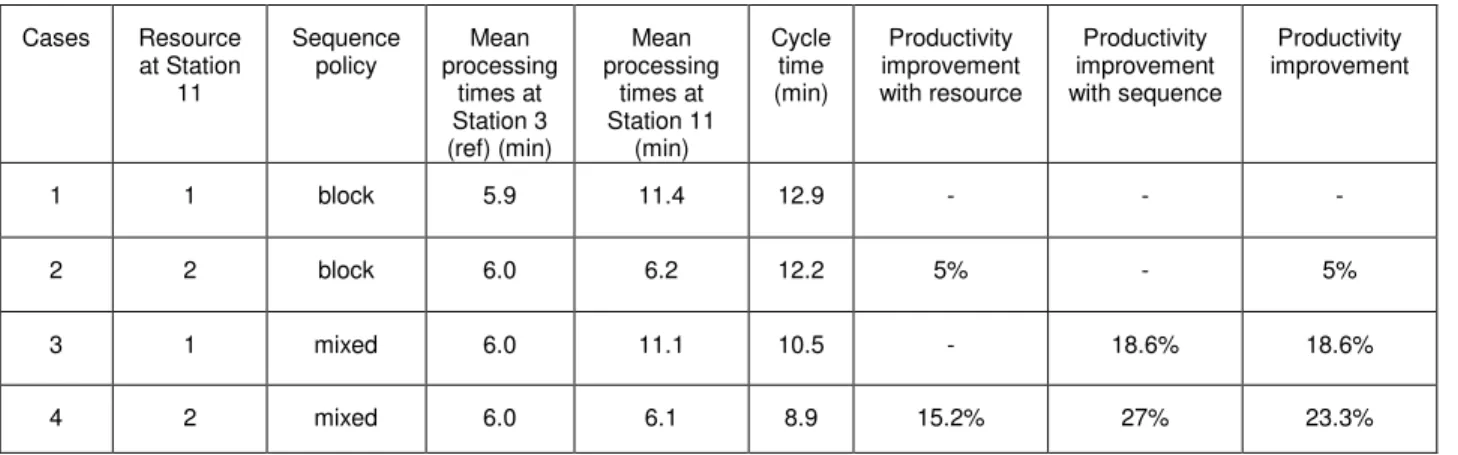
A simulation was carried out for a typical prefab house consisting of 24 interior and exterior wall panels. Four cases were tested with resource factors and sequence policies (Table 1). Station 3 is a reference station. Station 11 is a bottleneck station. The resource factors of one worker and two workers were tested at Station 11. Two sequencing policies were also tested. A block policy means that the interior walls and exterior walls are processed in a block. A mixed policy means the interior and exterior walls are processed alternately.
Table 1: What-if analyses for resources and sequences
Cases Resource at Station 11 Sequence policy Mean processing times at Station 3 (ref) (min) Mean processing times at Station 11 (min) Cycle time (min) Productivity improvement with resource Productivity improvement with sequence Productivity improvement 1 1 block 5.9 11.4 12.9 - - - 2 2 block 6.0 6.2 12.2 5% - 5% 3 1 mixed 6.0 11.1 10.5 - 18.6% 18.6% 4 2 mixed 6.0 6.1 8.9 15.2% 27% 23.3%
Preliminary results were observed with the following findings: 1) Resource factors
With the block sequence policy, productivity improves 5% with increasing a worker at the bottleneck station. With the mixed sequence policy, productivity improves 15.2% with increasing a worker at the same station.
2) Sequence policies
With one worker at Station 11, productivity improves 18.6% with the mixed policy. With two workers at Station 11, productivity improves 27% with the mixed policy.
In summary, the results show that the cycle time and productivity are improved significantly by applying both strategies on increasing resources at the bottleneck station and using the mixed sequence policy. The benefits of productivity gains overweigh the costs of additional resources in cost benefit analysis.
6. Conclusions and Future Research
The prefab production simulation tool provides a tool supporting “what-if” analyses for performance evaluation and improvement. The main criteria for the performance measures are productivity. Productivity improvement can be achieved through balancing the workload among stations and optimizing the panel sequence. This program also provides flexibilities to allow modification of shop floor configurations for accommodating certain changes. The simulation output provides both visual and tabular presentations for post-simulation studies and explorations. Currently, the cycle time reduction by panel sequences is performed through “what-if” analyses. The future research can be expanded to automatic mixed model sequencing to achieve production optimization. While the simulation tool has already been used by our industrial partner during the prefab facility design and equipment selection, it will also play an important role during the production launch of the new prefab facility. R&D efforts are underway for integrating this simulation tool with custom home design, enterprise resource planning (ERP), inventory management, and logistics systems.
Reference
Altiok, T. 1997. Performance analysis of manufacturing systems. Springer-Verlag, New York. AnyLogic, 2011. Anylogic Simulation Software Tool. www.xjtek.com.
Bard, J.F., Dar-El, E.M. and Shtub, A. 1992. An analytic framework for sequencing mixed model assembly lines. International Journal of Production Research, 30: 35-48.
Boysen, N., Fliedner, M. and Scholl, A. 2008. Assembly line balancing: Which model to use when?
International Journal of Production Economics, 111: 509-528.
Boysen, N., Fliedner, M. and Scholl, A. 2009. Sequencing mixed-model assembly lines: Survey, classification and model critique. European Journal of Operational Research, 192: 349-373.
Buzacott, J.A. and Shanthikumar, J.G. 1993. Stochastic models of manufacturing systems. Prentice Hall, Englewood Cliffs, NJ USA.
Das, B., Sanchez-Rivas, J.M., Garcia-Diaz, A. and Macdonald, C.A. 2010. A computer simulation approach to evaluating assembly line balancing with variable operation times. Journal of
Manufacturing Technology Management, 21: 872-887.
Falkenauer, E. 2005. Line balancing in the real world. In Proceedings of the The International Conference
on Product Life Cycle Management PLM' 05, Geneva 2005, B. Bouras, B. Gurumoorthy and R.
Sudarsan Eds. Inderscience, 360-370.
Friedman, A. and Cammalleri, V. 1993. Prefabricated wall systems and the North American home building industry. Building Research and Information, 21: 209-215.
Kim, Y.K., Kim, J.Y. and Kim, Y. 2000. A Coevolutionary Algorithm for Balancing and Sequencing in Mixed Model Assembly Lines. Applied Intelligence, 13: 247-258.
Law, A.M. and Kelton, W.D. 1982. Simulation modeling and analysis. McGraw-Hill Book Company, New York.
Miltenburg, J. 1989. Level schedules for mixed-model assembly lines in just-in-time production systems.
Management Science, 35: 192-207.
Nasereddin, M., Mullens, M.A. and Cope, D. 2007. Automated simulator development: A strategy for modeling modular housing production. Automation in Construction, 16: 212-223.
Pappert, F.S., Angelidis, E. and Rose, O. 2010. Framework for simulation based scheduling of assembly lines. In Proceedings of the 2010 Winter SImulation Conference, B. Johansson, S. Jain, J. Montoya-Torres, J. Hugan and E. Yucesan Eds., 1690-1698.
Seppanen, M.S. 2005. Operator-paced assembly line simulation. In Proceedings of the The 2005 Winter
Simulation Conference, M.E. Kuhl, N.M. Steiger, F.B. Armstrong and J.A. Joines Eds., 1343-1349.
Smunt, T.L. and Perkins, W.C. 1985. Stochastic unpaced line design: Review and further experimental results. Journal of Operations Management, 5: 351-373.
CN-189-10
Tempelmeier, H. 2003. Practical considerations in the optimization of flow production systems.
International Journal of Production Research, 41: 149-170.
Uddin, M.K., Soto, M.C. and Lastra, J.L.M. 2010. An integrated approach to mixed-model assembly line balancing and sequencing. Assembly Automation, 30: 164-172.
Xie, H., Shen, W., Neelamkavil, J. and Hao, Q. 2007. Simulation and optimization of mixed-model assembly lines using software agents. In Proceedings of the Proceedings of 2nd International Conference on Changeable, Agile, Reconfigurable, Agile, Reconfigurable and Virtual Production (CARV 2007), Toronto, ON, July 22, 2007.
Zhao, X. and Ohno, K. 1997. Algorithms for sequencing mixed models on an assembly line in a JIT production system. Computers & Industrial Engineering, 32: 47-56.