The use of uniaxial accelerometry for the assessment of
physical-activity-related energy expenditure: a validation
study against whole-body indirect calorimetry
Hideaki Kumahara
1,2, Yves Schutz
1*, Makoto Ayabe
2, Mayumi Yoshioka
3, Yutaka Yoshitake
4,
Munehiro Shindo
5, Kojiro Ishii
2and Hiroaki Tanaka
51
Institute of Physiology, Faculty of Medicine, University of Lausanne, Lausanne, Switzerland 2
Laboratory of Human Performance and Fitness, Graduate School of Education, Hokkaido University, Sapporo, Hokkaido, Japan
3
Molecular Endocrinology and Oncology Research Center, Laval University Medical Center and Laval University, Quebec, Canada
4Department for Interdisciplinary Studies of Lifelong Sport and Physical Activity, National Institute of Fitness and Sports in Kanoya, Kanoya, Kagoshima, Japan
5Laboratory of Exercise Physiology, Faculty of Sports and Health Science, Fukuoka University, Fukuoka, Japan
(Received 4 July 2003 – Revised 19 September 2003 – Accepted 27 September 2003)
Assessing the total energy expenditure (TEE) and the levels of physical activity in free-living conditions with non-invasive techniques remains a challenge. The purpose of the present study was to investigate the accuracy of a new uniaxial accelerometer for assessing TEE and physical-activity-related energy expenditure (PAEE) over a 24 h period in a respiratory chamber, and to establish activity levels based on the accelerometry ranges corresponding to the operationally defined metabolic equivalent (MET) categories. In study 1, measurement of the 24 h energy expenditure of seventy-nine Japanese subjects (40 (SD12) years old) was performed in a large respir-atory chamber. During the measurements, the subjects wore a uniaxial accelerometer (Lifecorder; Suzuken Co. Ltd, Nagoya, Japan) on their belt. Two moderate walking exercises of 30 min each were performed on a horizontal treadmill. In study 2, ten male subjects walked at six different speeds and ran at three different speeds on a treadmill for 4 min, with the same accelerometer. O2consumption
was measured during the last minute of each stage and was expressed in MET. The measured TEE was 8447 (SD 1337) kJ/d. The accel-erometer significantly underestimated TEE and PAEE (91·9 (SD5·4) and 92·7 (SD17·8) % chamber value respectively); however, there was a significant correlation between the two values (r 0·928 and 0·564 respectively; P, 0·001). There was a strong correlation between the activity levels and the measured MET while walking (r20·93; P, 0·001). Although TEE and PAEE were systematically underestimated during the 24 h period, the accelerometer assessed energy expenditure well during both the exercise period and the non-structured activi-ties. Individual calibration factors may help to improve the accuracy of TEE estimation, but the average calibration factor for the group is probably sufficient for epidemiological research. This method is also important for assessing the diurnal profile of physical activity. Accelerometer: Daily energy expenditure: Physical activity: Respiration chamber
The energy expenditure (EE) associated with physical activity has a negative relationship with the prevalence of obesity and its related diseases (i.e. diabetes, hypertension, CVD etc.), and it plays a major role in the prevention and treatment of these diseases (Weinsier et al. 1998; Levine et al. 1999; Ravussin & Bogardus, 2000). When treatment strategies, including nutritional education, for those dis-eases are developed, quantitative information related to
physical activity is required to provide more effective goals. Hence, information on physical activity is con-sidered to be useful, not only for researchers and healthcare workers, but also for the general public, in order to prevent and treat these diseases more effectively.
Activity monitoring based on an accelerometry sensor is one of the useful methods for obtaining objective infor-mation on physical activity patterns and for estiinfor-mation
* Corresponding author: Dr Yves Schutz, fax þ 41 21 692 55 95, email [email protected]
Abbreviations:EE, energy expenditure; MET, metabolic equivalent; PAEE, physical-activity-related energy expenditure; PAEEAcc,
physical-activity-related energy expenditure estimated by the accelerometer; PAEEAcc-excl.TEF, physical-activity-related energy expenditure estimated by the
accelerometer excluding thermic effect of food; PAEEChamber, physical-activity-related energy expenditure measured by the respiratory chamber;
PAEEChamber-excl.TEF, physical-activity-related energy expenditure measured by the respiratory chamber excluding thermic effect of food; SEE,
standard error of the estimate; TEE, total energy expenditure; TEEAcc, total energy expenditure estimated by an accelerometer; TEEChamber, total
energy expenditure measured by the chamber; TEF, thermic effect of food. qThe Authors 2004
of the related EE (Schutz et al. 2001; Ebina et al. 2002), since it can continuously measure the intensity, duration and frequency of activities. Previous activity monitors (Bouten et al. 1994; Freedson et al. 1998) have been designed to detect accelerations due to body movements, such as walking and running. However, the EE associated with certain movements (upper body) are not adequately assessed, especially when slow or small erratic movements were performed when sedentary and during very low levels of activity (Bouten et al. 1994; Nichols et al. 1999). One possible cause is a calculation algorithm that may have inherent limitations, since the equation was derived from regression equations of acceleration v. EE during struc-tured activities such as walking and running (Bouten et al. 1994; Fehling et al. 1999). Previous studies (Bray et al. 1994; Chen & Sun, 1997) indicated that EE was underesti-mated by most devices in comparison with respiratory chamber values, because of the difficulty in evaluating sedentary activities. Since running and walking activities constitute major movements in man, as do sedentary and low-intensity activities (Bouten et al. 1996; Meijer et al. 2001), EE should be accurately assessed under volitional activity (structured exercise) as well as under involuntary activity (non-structured activity) to evaluate the total EE (TEE) in free-living conditions.
Recently, an activity monitor based on a uniaxial accel-erometry sensor was made commercially available (Lifecor-der; Suzuken Co. Ltd, Nagoya, Japan). This activity monitor is based on a previous activity monitor developed by the same company (Kenz-accelerometer; Suzuken Co. Ltd) (Yamada & Baba, 1990; Bassett et al. 2000). Although both devices adopt quite similar accelerometric sensors and algorithms for calculating EE, the new device is superior for several reasons. It is small (0·062 £ 0·046 £ 0·026 m, 40 g) and the external plastic cover makes the unit very rugged. Data, including total EE, total step frequencies and raw data based on accelerometry, can be stored for 6 weeks. The data can be downloaded via a personal compu-ter, and then a summary report can be generated. An internal real-time clock also helps to discriminate activity patterns. It is also noteworthy that the device has a unique algorithm for assessment of EE, especially non-structured activities (described later). In studies using the older device (Kenz-accelerometer; Suzuken Co. Ltd), Yamada & Baba (1990) reported that the device assessed EE during running and walking well when compared with indirect calorimetry, and it also effectively measured EE in free-living conditions when compared with physical activity recall (Suzuki et al. 1997). To further expand the benefits of this device and to use it to quantify energy EE in free-living conditions, the new device needs to be validated against indirect calorimetry.
The respiratory chamber is a precise and accurate method for quantifying daily EE under controlled conditions, during which free-living activities can be mimicked (i.e. walking on the treadmill; Jequier & Schutz, 1983). The primary purpose of the present study was to investigate the accuracy of the activity monitor for the assessment of EE over 24 h in a respiratory chamber. Epidemiological studies showing the relationship between physical activity and obesity often categorize activities into metabolic
equivalent (MET) intensities, i.e. classifying it to light (, 3·0 MET), moderate (3·0 – 6·0 MET) and vigorous (. 6·0 MET) intensity activity (Pate et al. 1995). A secondary purpose of the present study was to develop and categorize the various activities based on accelerometry into corresponding EE levels expressed as MET.
Methods Subjects
In study 1, twenty-eight healthy Japanese males and fifty-one healthy Japanese female subjects (18 – 64 years old) participated in this study. Eighty-five percent of the sub-jects had been living in Switzerland for . 6 months and the others were considered to be tourists. The latter group were all asked to maintain their normal diet. The effect of jet lag was minimized since the measurements were performed 2 – 13 d after moving to Europe. Ten Japa-nese healthy males subjects (21 – 32 years old) who live in Japan participated in study 2.
The study protocol was approved by the Ethical Committee of the University of Lausanne. After the experiment was explained, each subject signed an informed consent statement.
Study design and variables
Study 1: experiment in the respiratory chamber. In order to investigate the validity of the assessment of daily EE using an activity monitor based on a uniaxial accelerome-try sensor (Lifecorder; Suzuken Co. Ltd), the following study was performed. The subjects stayed in a large respir-atory chamber for 24 h (floor surface area 13 m2, volume 31 m3). The physical activity was not restrained but it was spontaneous, excluding the two prescribed walking exercises on the horizontal treadmill (3·9 and 5·1 km/h, 30 min each). However, access to the treadmill was not permitted except during the imposed walking session. The habitual daily activities in the chamber included watching television, reading, deskwork, going to the toilet and washing, hobby-like-activities and walking around. The activity monitor was rigidly fixed on the belt during the daytime (for 16 h). The sleeping period was controlled (for 8 h), and the sleeping metabolic rate was
averaged when sleeping over a 6 h interval, with
confirmation of no physical activity by Doppler radar (Schutz et al. 1982).
Both O2 consumption and CO2 production were
measured, and EE was then calculated. The configuration of the chamber and the method of gas analysis have been described by Jequier & Schutz (1983). The subjects ingested three standard experimental meals (breakfast, lunch and dinner). The energy intake (8399 (SD 1266) kJ/d) was not significantly different from the 24 h EE measured by the respiratory chamber (TEEChamber).
The % body fat was assessed by a skinfold thickness method and an independent bioelectrical impedance method. The body density was estimated from the sum of triceps and subscapular skinfold thicknesses and a Japanese formula (Nagamine & Suzuki, 1964), and the
% body fat was then calculated using the equation of Brozek et al. (1963). A handle (arm-to-arm) type device (model HBF-302; Omron Hatsusaka Co. Ltd, Tokyo, Japan) was used as the impedance method. This device displays the % body fat from personal data (i.e. age, height and weight) and bioelectrical impedance. The skinfold thickness and % body fat were averaged and reported in the results section. In a subsample of fifty-nine subjects, the body composi-tion estimate was compared with the air-displacement plethysmography method (BodPodw; Life Measurement Instruments, Concord, CA, USA) (Fields et al. 2002) and there was a strong correlation (r 0·89, P, 0·001).
Study 2: experiment using a motorized treadmill. Study 2 was performed in order to determine a more precise relationship between the accelerometry output measured by the activity monitor and EE during ambulatory physical activities. The subjects performed 4 min of each of the fol-lowing exercise conditions using a motor-driven treadmill: walking at 2·4, 3·3, 4·2, 5·1, 6·0 and 6·9 km/h, and running at 7·8, 8·7 and 9·6 km/h (the slope was horizontal). Each grade condition was separated by a 2 min rest period.
VO2was measured during the last minute of each
steady-state condition from the mixed expired gases collected by the Douglas bag method using a mouthpiece and a nose-clip. The volume of expired air was quantified with a
twin-drum-type respirometer (CR-20; Fukuda Irika,
Tokyo, Japan), and both the O2 and CO2 concentrations were analysed using MS (Arco; Arco System, Tokyo, Japan). The analyser was calibrated before the test using verified gases of known concentration. MET were calcu-lated by dividing the steady-state VO2 by 3·5 ml/kg per
min (equivalent to 1·0 MET), since, in contrast to study 1, RMR could not be measured.
Accelerometer features
The activity monitor measures acceleration in the vertical (z) direction. According to technical details provided by the manufacturer (Suzuken Co. Ltd), it samples the accel-eration at 32 Hz and assesses values ranging from 0·06 to 1·94 g (1·00 g is equal to the acceleration of free fall). The acceleration signal is filtered by an analogue bandpass filter and digitized. A maximum pulse over 4 s is taken as the acceleration value, and the activities are categorized into eleven activity levels (0·0, 0·5, and 1·0 – 9·0; level 0·0 corresponds to , 0·06 g) based on the pattern of the accelerometric signal. The activity levels are subsequently converted by an algorithm to calculate EE (kcal) based on the following principle: when the sensor detects three acceleration pulses or more for four consecutive seconds, the activities are recognized as physical activity, and then are categorized into one of nine activity levels (levels 1·0 – 9·0). EE due to these activities (EEAct) are calculated and counted every 4 s, using body weight (W) and a factor Ka which depends upon the activity level:
EEActðkcalÞ ¼ Ka £ W ðkgÞ: ð1Þ
The factor Ka is not provided here, since it is the proprie-tary information of the manufacturer and is therefore confidential.
If an acceleration pulse due to physical activity (i.e. cor-responding to the activity levels 1·0 – 9·0) is not immedi-ately succeeded by another acceleration pulse, then it is not counted as 0·0 but a level of 0·5 is arbitrarily ascribed for 3 min. It is assumed that the subject is standing up and maintaining that state (or sitting down). The latter posture involves a higher EE than resting supine position. In brief, isolated spurts of acceleration are assumed to be due to acute changes in posture (lying down, sitting and standing), since walking and moving around are typically rhythmic activities. EE due to very small trunk movements and pos-ture effect (EEminorAct, i.e. sitting to standing-up position, light desk-work etc.) are calculated from the BMR multiple by a constant Kx:
EEminorActðkcalÞ ¼ Kx £ BMR: ð2Þ
The value of the constant Kx is not given here, since it is considered to be confidential by the manufacturer.
The TEE assessed by the device (TEEAcc) is
calculated from the sum of BMR, thermic effect of food (TEF ¼ (1/10)TEE), EEAct and EEminorAct:
TEEAcc¼ BMR þ ð1=10ÞTEEAcc
þ EEActþ EEminorAct:
ð3Þ The BMR is calculated from body weight (W), height (H),
sex and age using a standard Japanese formula
(Health Promotion and Nutrition Division, Health Service Bureau, Ministry of Health and Welfare, 1996) as follows:
BMR ðkcalÞ ¼ Kb£ BSA £ T £ ð1=10 000Þ;
where Kbis the standard Japanese value which corresponds to age (kcal/m2 per h) (Health Promotion and Nutrition Division, Health Service Bureau, Ministry of Health and Welfare, 1996), T is time (h) and BSA is body surface area (cm2) estimated using a Japanese formula (Fujimoto et al. 1968).
BSA ðcm2Þ ¼ W0·444ðkgÞ £ H0·663ðcmÞ £ 88·83:
Data analysis and statistics
In study 1, the activity levels of the accelerometer were determined over 4 s, and the value was then averaged over 15 min. The EE values derived from both the acceler-ometer and the respiratory chamber expressed as kcal were converted into kJ using the standard conversion factor, i.e. 1·000 kcal ¼ 4·184 kJ. The measured EE was normalized for body weight (kJ/kg per h), and also was expressed as measured EE:measured sleeping metabolic rate (i.e. physi-cal measured activity ratio).
Physical-activity-related EE (PAEE) measured by the respiratory chamber either including or excluding TEF (PAEEChamber and PAEEChamber-excl.TEF respectively) and that obtained by the activity monitor (PAEEAcc and PAEEAcc-excl.TEF respectively) were calculated using the following formulas:
PAEEAcc¼ TEEAcc2 calculated BMR by the algorithm
and
PAEEChamber ¼ TEEChamber2measured sleeping
metabolic rate:
A comparison between the values from these formulas was performed supposing that TEF calculated by the algorithm ((1/10)TEEAcc) accurately assessed the true value:
PAEEAcc-excl:TEF ¼ TEEAcc2 ðcalculated BMR by the
algorithm þ TEF as ð1=10ÞTEEAccÞ
ðsee equation 3Þ and
PAEEChamber-excl:TEF¼ TEEChamber2 ðmeasured sleeping
metabolic rate þ TEFÞ:
In order to obtain a valid comparison of PAEE among methods, the TEF was calculated using an approach similar to that used for the accelerometer algorithm, i.e. 10 % total energy intake. Since the subjects were close to energy equilibration (energy intake ¼ TEE), this does not lead to a significant deviation from the data calculated based on TEE.
Linear regression equations were calculated for
TEEChamber v. TEEAcc and PAEEChamber v. PAEEAcc. Bland – Altman plots (Bland & Altman, 1986) were also made to compare the difference between measured and estimated values. Furthermore, linear regression between the activity levels and measured EE was calculated for individuals as well as pooled data of all subjects (n 79) in the daytime. Standard error of the estimate (SEE) and correlation coefficients using Pearson’s r were calculated. In addition, paired t tests were used to compare the mean differences between the measured and estimated EE.
In study 2, one-way ANOVA was performed to investi-gate the statistical differences due to the effect of treadmill speed in MET and in the activity levels. Scheffe´’s F post hoc analysis was used to determine the presence of any sig-nificant differences.
All statistical analyses were performed using the StatView (version 5.0.1; SAS Institute, Cary, NC, USA). Statistical significance was considered to be present at P, 0·05, unless noted otherwise.
Results
The physical characteristics of the subjects of study 1 and 2 are shown in Table 1.
Total energy expenditure in the respiratory chamber Measured TEEChamberaveraged 8451 (SD1338) kJ/d for the whole group (men 9656 (SD1119), women 7789 (SD926) kJ/d). Measured PAEEChamberaveraged 2557 (SD537) kJ/d in the whole group (men 2867 (SD 423), women 2387 (SD 519) kJ/d). Measured TEEAcc was 7750 (SD 1186) kJ/d (men 8912 (SD 884), women 7111 (SD 775) kJ/d) and measured PAEEAcc was 2319 (SD 453) kJ/d (men 2605 (SD422), women 2163 (SD391) kJ/d). TEEAccwas signifi-cantly lower than TEEChamber(2 702 (SD 502) kJ/d, 95 %
CI 2 814, 2 589 (P, 0·001); i.e. 91·9 (SD 5·4) %
TEEChamber); however, there was a highly significant corre-lation between the two (r 0·928; P, 0·001, SEE 503 kJ/d) (Fig. 1). PAEEAcc was also significantly lower than
PAEEChamber (2 238 (SD 468) kJ/d, 95 % CI 2 342,
2 133 (P, 0·001); i.e. 92·7 (SD 17·8) % PAEEChamber), yet there was a significant correlation between both (r 0·564; P, 0·001, SEE 446 kJ/d) (Fig. 2). Moreover, the differences between the measured and the estimated values were normally distributed (Figs. 1 and 2). When PAEE was calculated taking the TEF into account, it remained significantly lower when using the accelerometer (2 172 (SD 453) kJ/d, 95 % CI 2 274, 2 71; i.e. 94·9 (SD 28·4) % of the chamber value), but a significant correlation was still found (r 0·423; P, 0·001,SEE 431 kJ/d) with the measured value.
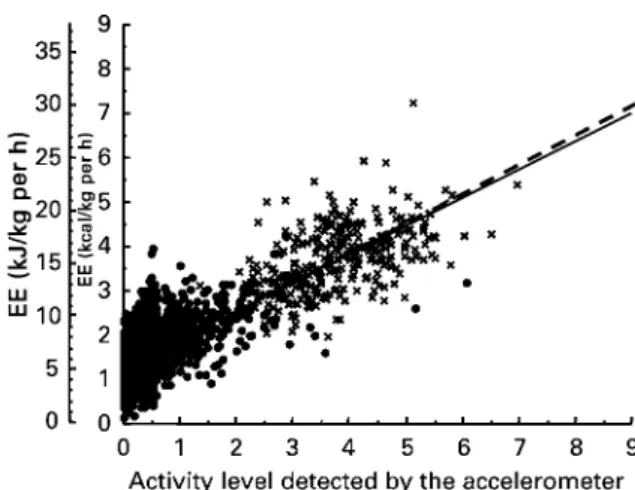
The individual correlations between the activity levels estimated by the accelerometer v. the measured EE (aver-aged over 15 min periods in the daytime) were significant (r 0·611 – 0·956). Fig. 3 shows the relationship between the activity levels and the measured EE of the pooled sub-jects (n 79) over the daytime. A highly significant relation-ship was seen between both measurements, not only including the walking periods (r 0·808; P, 0·001, SEE 1·780 kJ/kg per h), but also when obligatory walking was excluded (r 0·477; P, 0·001, SEE 1·684 kJ/kg per h). The regression equation was based on all activities (during the daytime) as follows:
EE ðkJ=kg per hÞ ¼ 2·659x þ 5·33;
Table 1. Physical characteristics of the Japanese subjects* (Mean values and standard deviations)
Study 1 Study 2
Total (n 79) Men (n 28) Women (n 51) Men (n 10)
Mean SD Mean SD Mean SD Mean SD
Age (years) 39·7 12·4 39·4 13·6 39·8 11·9 24·4 3·4
Height (m) 1·628 0·081 1·707 0·060 1·584 0·053 1·733 0·062
Weight (kg) 58·8 11·9 67·5 10·6 54·1 9·8 71·5 8·4
BMI (kg/m2) 22·0 3·2 23·0 2·7 21·5 3·4 23·8 1·8
Fat (%) 23·5 6·5 18·4 4·1 26·3 5·9
or expressed in kcal:
EE ðkcal=kg per hÞ ¼ 0·636x þ 1·27;
where x is the activity level (range of score 0·5 – 9·0). Similarly, when measured EE was expressed as the physical activity ratio there was a highly significant relationship between the ratio and the activity levels (r 0·801,SEE0·440), and the following regression equation was developed:
physical activity ratio ¼ 0·640x þ 1·27; where x is the activity level.
Treadmill exercise
Since a one-way ANOVA (9 £ 10, P, 0·001) revealed a significant speed effect on MET (P, 0·001) and on the activity levels (P, 0·001), Scheffe´’s F post hoc analysis was performed to determine the presence of any significant differences. The mean values and standard errors of MET and activity levels measured by the activity monitor for each speed are presented in Fig. 4. MET between 2·4 and 3·3 km/h and between 3·3 and 4·2 km/h were not signifi-cantly different. However, there was a significant differ-ence at 4·2 – 9·6 km/h. On the other hand, the activity level was significantly different at 2·4 – 7·8 km/h, while it
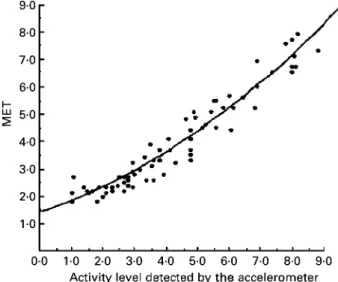
was not significantly different at . 7·8 km/h. Fig. 5 shows the relationship between the activity levels and MET. The quadratic equation regression (r2 0·929, SEE 0·463 MET) was calculated at a speed # 7·8 km/h, since Fig. 1. (A), Relationship between the total energy expenditure measured by the respiratory chamber (TEEChamber) v. that measured by the
accelerometer (TEEAcc; Lifecorder, Suzuken Co. Ltd, Nagoya, Japan); (B), the difference between the two values is plotted v. the mean value
of the two for each subject (n 79, study 1; Bland– Altman plot (Bland & Altman, 1986)). For details of subjects and procedures, see Table 1 and p. 236. X, Male subjects; W, female subjects. (A), —, line of best fit; – – –, identity line. (B), —, mean difference between the two methods; – – – , 95 % limits of agreement (þ or 2 2SD). TEEAccwas significantly lower than TEEChamber(2701 (SD502) kJ/d; P, 0·001);
however, there was a significant correlation (r 0·928; P, 0·001, standard error of the estimate 503 kJ/d).
Fig. 2. (A), Relationship between the physical-activity-related energy expenditure measured by the respiratory chamber (PAEEChamber) v. that
measured by the accelerometer (PAEEAcc; Lifecorder, Suzuken Co. Ltd, Nagoya, Japan); (B), the difference between the two values is plotted
v. the mean value of the two for each subject (n 79, study 1; Bland – Altman plots (Bland & Altman, 1986)). For details of subjects and pro-cedures, see Table 1 and p. 236. X, Male subjects; W, female subjects. (A), —, line of best fit; – – –, identity line. (B), —, mean difference between the two methods; – – – , 95 % limits of agreement (þ or 2 2SD). PAEEAccwas significantly lower than PAEEChamber(2238 (SD468)
kJ/d; P, 0·001); however, there was a significant correlation (r 0·564; P, 0·001, standard error of the estimate 446 kJ/d).
Fig. 3. Relationship between the daytime activity levels recorded by the accelerometer (Lifecorder; Suzuken Co. Ltd, Nagoya, Japan) and the energy expenditure (EE) of the pooled subjects (n 79, study 1). For details of subjects and procedures, see Table 1 and p. 236. £ , Treadmill walking periods; —, regression line for the relationship for all activities (r 0·808; P, 0·001, standard error of the estimate 1·780 kJ/kg per h); – – – , regression line for the relationship for all activities excluding treadmill walking (r 0·477; P, 0·001, standard error of the estimate 1·684 kJ/kg per h).
the activity level did not follow the energy expenditure over this velocity. The equation was as follows:
MET ¼ 0·043x2þ 0·379x þ 1·361;
where x is the activity level. The estimated MET from the recorded activity level was calculated by the equation, then categorized into one of three activity level defined as light (, 3·0 MET), moderate (3·0 – 6·0 MET) and vigorous (. 6·0 MET) activity (Table 2).
Discussion
Validity of assessment of energy expenditure measured using the accelerometer
The present study showed that TEEAcc was significantly underestimated by a mean value of 8 %. However, a highly significant relationship was demonstrated between
TEEAcc and the measured values in the chamber as
shown in Fig. 1. In addition, the inter-individual variability of the relative error showed small deviation: the CV was 5·9 %. These results indicated that inter-individual differ-ences in TEE can be assessed well by the accelerometer.
It was considered that the cause of the underestimation of TEE may partly stem from underestimation of basal EE, though the formula used was intended for Japanese individuals, so that ethnic differences are not the cause for such a difference: the predicted basal EE was found to be underestimated by 7 (SD 9) % (464 (SD 539) kJ/d) as compared with the measured sleeping metabolic rate, and this error contributed 66 % of the total error involved over 24 h. We tried to apply several basal EE prediction equations replacing that used by the accelerometer algor-ithm: those of Harris & Benedict (1919) and of the Food and Agriculture Organization/World Health Organization/ United Nations University (1985). The two formulas gave more accurate results than the value obtained with the accelerometer algorithm: the recalculated TEE values averaged 96·5 (SD6·3) and 98·0 (SD5·8) % of the measured value respectively. The net improvements in the accuracy of estimation were therefore 4·6 and 6·0 %, although the values were still significantly lower than the measured ones. Note that the mean basal EE with these two formulas were not significantly different from measured sleeping metabolic rate. The tables of Fleisch (1951) and of Robert-son & Reid (1952) classically used in the UK were also employed to recalculate basal EE. The body surface area estimation was based on a Japanese formula (Fujimoto et al. 1968). The two basal EE calculated still underesti-mated the measured sleeping metabolic rate: the estiunderesti-mated TEE values did not improve and represented 94·0 (SD 5·4) and 91·4 (SD 5·5) % true TEE value, using the Fleisch (1951) and the Robertson & Reid (1952) tables respectively. In addition, when the body surface area was based on the
classical Du Bois & Du Bois (1916) formula,
Fig. 4. Changes in the activity levels detected by the accelerometer (Lifecorder; Suzuken Co. Ltd, Nagoya, Japan) and the measured metabolic equivalents (MET) v. walking speeds (study 2). For details of subjects and procedures, see Table 1 and p. 237. Values are means with their standard errors shown by vertical bars (n 10). —, Variation of activity levels; – – – , variation of MET. One-way ANOVA (9 £ 10, P, 0·001) revealed a significant effect of speed on both MET and the activity level of the accelerometer. Mean values were significantly different from those measured as the previous lower speed: *P, 0·05, ***P, 0·001.
Fig. 5. The relationship between measured metabolic equivalents (MET) and the activity levels recorded by the accelerometer (Life-corder; Suzuken Co. Ltd, Nagoya, Japan) at a velocity ranging from 2·4 to 7·8 km/h (n 10) (study 2). For details of subjects and pro-cedures, see Table 1 and p. 237. The quadratic equation regression was calculated as follows: r20·929; P, 0·001, standard error of the
estimate 0·46 MET.
Table 2. The different activity levels of the acceler-ometer* classified into category of metabolic equivalents (MET)†
Activity levels Estimated MET
Light intensity 1·0 1·8 2·0 2·3 3·0 2·9 Moderate intensity 4·0 3·6 5·0 4·3 6·0 5·2 Vigorous intensity 7·0 6·1 8·0 7·1 9·0 .8·3
* Lifecorder; Suzuken Co. Ltd., Nagoya, Japan.
† The MET values were estimated using a formula derived from study 2 (for details, see p. 237).
estimated TEE averaged 96·1 (SD6·0) and 93·1 (SD5·6) % true value respectively. Note that the % body fat of a sub-group of Japanese subjects (n 22) was the same as a white group strictly matched for gender, age, height and weight (H Kumahara, H Tanaka and Y Schutz, unpublished results). On the other hand, PAEEAcc was also significantly
underestimated compared with the measured value,
accounting for 34 % of the total difference in TEE. When PAEE was calculated, taking into account the TEF (i.e. PAEEChamber-excl.TEF v. PAEEAcc-excl.TEF), it remained significantly underestimated.
Previous studies found that TEE was also significantly underestimated by 13 % using uniaxial accelerometers (Caltrac; Hemokinetics Inc., Madison, WI, USA) (Bray et al. 1994) and by 17 % using a triaxial accelerometer (Tritrac-R3D; Hemokinetics Inc.) (Chen & Sun, 1997), but the physical activity included use of a stationary bicycle, which is not sensed by accelerometry, compared with measured TEE in a respiratory chamber. Basal EE was overestimated by 7 – 9 %. Most of the previous com-mercially available activity monitors have difficulty in detecting small changes in EE due to sedentary and low-intensity activities since the device output is not proportional to the increase in EE (Bouten et al. 1994). Consequently, EE is largely underestimated by such accelerometers, since PAEE measured within the confine-ment of a respiratory chamber was restricted to relatively sedentary activities. Moreover, since low-level activity (i.e. , 3 MET) accounts for 65 – 82 % total daily activity in free-living conditions (Meijer et al. 2001), EE due to spontaneous activity should be also fully assessed in order to accurately evaluate TEE in free-living conditions. In our present study, the activity levels measured by the activity monitor showed a highly significant correlation with the measured EE, not only during the active part of the day (r 0·807; P, 0·001), but also during sedentary activities, when walking periods were excluded (r 0·477; P, 0·001).
The SEE calculated from these relationships were
1·784 kJ (0·426 kcal)/kg per h (i.e. 0·43 MET) during the active part of the day and 1·684 kJ (0·402 kcal)/kg per h (i.e. 0·40 MET) during sedentary activities, giving a greater CV at lower activity levels. These absolute values were lower than those reported in previous studies (Meijer et al. 1989; Bouten et al. 1994; Freedson et al. 1998; Nichols et al. 1999) using a triaxial accelerometry sensor, even though in the present study the activities in the chamber were not strictly regimented activities as com-pared with previous structured ones (i.e. walking and run-ning). Bouten et al. (1994) indicated that the integral of the acceleration in the three directions (antero-posterior, medio-lateral and vertical planes) is more valid than a uni-axial acceleration (only vertical plane) when sedentary movements are considered. Because each of the three acceleration directions contributes to EE, depending on the type of activity such as sitting, standing and walking, only uniaxial acceleration direction will fail to distinguish EE associated with the various types of small movements. In the present study, the activity levels were calculated from the amplitude of accelerations and step frequency during a time period by means of the manufacturer’s
algorithm (unknown). Consequently, it was supposed that the algorithm might work adequately to detect variations of EE. The calculation of EE due to small movements (corresponding to activity level 0·5) is obviously different from active movements such as walking (corresponding
to activity levels 1·0 – 9·0): the EE due to small
movements are calculated based on a physiological hypothesis (see equation 2) in contrast to that of active movements that are based on a biomechanical hypothesis (see equation 1). It therefore probably helps to distinguish different EE due to type of activity.
Some studies (Levine et al. 1999; Martinez-Gonzalez et al. 1999; Esparza et al. 2000) have indicated that the EE induced by very small movements (i.e. involuntary activity) may have an important relationship to lifestyle-related diseases. Therefore, an evaluation of physical activity on a long-term basis is required and is assessed not only for volitional activities (structured exercise), but also involuntary activities (non-structured activity) to prevent and to treat obesity and its related diseases. Since the accelerometer could assess the PAEE well, the device is likely to detect not only ambulatory movements, but also spontaneous low-level activities.
Classification of the activity levels corresponding to intensity of metabolic equivalents
In the present study, we demonstrated that activity levels measured by the accelerometer increased in proportion to increase in MET for 2·4 – 7·8 km/h. However, no significant difference was observed for 7·8 – 9·6 km/h, despite the fact that MET directly increased in proportion to the speed, as shown in Fig. 4. It is interesting to note that all subjects started to run at 7·8 km/h. It is likely that the activity moni-tor can detect changes of the speeds during walking; how-ever, this is less successful during running. Yamada & Baba (1990) also recognized that the activity levels failed to follow treadmill speeds accurately above 8·0 km/h. This result thus indicated that the acceleration in the verti-cal plane is not able to correctly estimate EE during
run-ning. One possible reason for this is that the
accelerometry sensor of our device detects vertical accel-eration due to body movement up to 1·94 g. In fact, the centre of gravity during running as measured by the
accelerometry sensor attached to the waist readily
exceeded the threshold of the present sensor (i.e. 1·94 g) (P. Terrier, personal communication). As a result, our sensor was unable to assess variations in acceleration due to changing running speed, because the magnitude of the acceleration during running may exceed the highest limit recorded by the accelerometer. Therefore, we must pay attention to the wide range of measurements regarding the acceleration signal as well as the accuracy of measurement of this variation. We need a device that can measure physical activities with a high accuracy from light to moderate intensities, since vigorous intensity activities (like running) constitute a small percentage of the total daily activity in the free-living population (Meijer et al. 2001).
Regarding the relationship between the activity levels assessed by accelerometry and MET during treadmill
exercises, a simple linear regression equation fitted well in study 1, whereas in study 2, a quadratic curvilinear regression equation was more appropriate. The probable reason for this is a change in net energetic efficiency of running, and a possible effect of straight extrapolation of the relationship in study 1 (Fig. 3), in which the maximum activity level in the chamber was not much greater than 6·0. The correlation of the quadratic relationship between activity level and MET was highly significant (r2 0·929, SEE 0·463 MET). Using a classical uniaxial accelerometer (Caltrac; Hemokinetics Inc.), Haymes & Byrnes (1993) showed that the strength of the relationship between the accelerometry output and measured EE was also high (r2 0·76, SEE 1·23 MET) during walking (speed 3·2 – 8·0 km/h). Another study using a triaxial accelerometer device (Tracmor; Maastricht, The Netherlands) (Levine et al. 2001) reported that since the relationship for the group of subjects was not significant, individual regression equations are needed for each subject to determine EE based on the accelerometry output.
The MET values were calculated from the regression equation shown in Table 2. The data showed an obvious difference between the activity levels and this helped to distinguish different intensities of physical activity. It appears to be classified broadly into levels , 3·0, 4·0 – 6·0 and . 7·0, which corresponded to light (, 3·0 MET), mod-erate (3·0 – 6·0 MET) and vigorous (. 6·0 MET) intensity activity respectively. When the MET values were calcu-lated from a regression equation derived from study 1 (Fig. 3) (i.e. calculated as 4·184 kJ (1 kcal)/kg per h equiv-alent to 1·0 MET), the values that corresponded to the activity levels for a range from 1·0 to 6·0, by step of one unit, were 1·9, 2·5, 3·2, 3·8, 4·4 and 5·1 MET respectively. Similarly, a regression equation for estimating the physical activity ratio (i.e. EE/sleeping metabolic rate) was devel-oped in study 1. The calculated values corresponding to each activity level were almost identical. These values from study 1 are similar to the values in study 2. This information can be used to detect the difference in activity levels and objectively assess the duration and/or intensity levels in various physical activities. In addition, this device is useful for assessing the effect of lifestyle interventions related to physical activity and for providing clinical prescription for prevention and/or treatment of lifestyle-related diseases.
In conclusion, the findings of the present study suggest that our accelerometer based on uniaxial accelerometry (Lifecorder; Suzuken Co. Ltd) is useful for the assessment of the total daily physical activity and EE in free-living con-ditions. The average group calibration factor found can be applied to approximate the real value, but it would be easier to improve the algorithm of the accelerometer to diminish the relative error. However, individual calibration factors may be still needed to provide more accurate esti-mation. Furthermore, the classification of activity levels corresponding to MET categories is considered to be a useful objective tool for epidemiological studies designed to measure the intensity of physical activity. However, the inability to detect external work as well as topographical transition (i.e. carrying a load or walking on a slope) (Bassett et al. 2000; Terrier et al. 2001) remains a
limitation in the application of this technique in obtaining accurate results when the results are expressed in terms of EE.
Acknowledgements
We thank the participants for their cooperation and the following Japanese associations: The Japan Club of
Geneva, The Swiss – Japanese journal Gru¨ezi and
The Swiss Happy Net. We would also like to thank those who helped in the recruiting process of the subjects. We are grateful to assistant teacher Takuya Yahiro and the staff at the Laboratory of Exercise Physiology, Faculty of Sport and Health Science, Fukuoka University, for their assistance, as well as Philippe Terrier at the Institute of Physiology, Faculty of Medicine, University of Lausanne,
for providing important advice. This research was
supported by Medical Frontier Strategy Research grants H13-21th-31 from the Japanese Ministry of Health Labour and Welfare.
References
Bassett DR Jr, Ainsworth BE, Swartz AM, Strath SJ, O’Brien WL & King GA (2000) Validity of four motion sensors in measur-ing moderate intensity physical activity. Med Sci Sports Exerc 32, S471 – S480.
Bland JM & Altman DG (1986) Statistical methods for assessing agreement between two methods of clinical measurement. Lancet 1, 307 – 310.
Bouten CV, Verboeket-van de Venne WP, Westerterp KR, Verduin M & Janssen JD (1996) Daily physical activity assess-ment: comparison between movement registration and doubly labeled water. J Appl Physiol 81, 1019 – 1026.
Bouten CV, Westerterp KR, Verduin M & Janssen JD (1994) Assessment of energy expenditure for physical activity using a triaxial accelerometer. Med Sci Sports Exerc 26, 1516 – 1523.
Bray MS, Wong WW, Morrow JR Jr, Butte NF & Pivarnik JM (1994) Caltrac versus calorimeter determination of 24-h energy expenditure in female children and adolescents. Med Sci Sports Exerc 26, 1524 – 1530.
Brozek J, Grande F, Anderson JT & Keys A (1963) Densitometric analysis of body composition: Review of some quantitative assumptions. Ann NY Acad Sci 110, 113 – 140.
Chen KY & Sun M (1997) Improving energy expenditure esti-mation by using a triaxial accelerometer. J Appl Physiol 83, 2112 – 2122.
Du Bois BS & Du Bois EF (1916) Clinical calorimetry: a formula to estimate the approximate surface area if height and weight be known. Arch Med 17, 863 – 871.
Ebina N, Shimada M, Tanaka H, et al. (2002) Comparative study of total energy expenditure in Japanese men using doubly labeled water method against activity record, heart rate moni-toring, and accelerometer methods. Jpn J Phys Fitness Sports Med 51, 151 – 164 (In Japanese: English abstract).
Esparza J, Fox C, Harper IT, et al. (2000) Daily energy expendi-ture in Mexican and USA Pima indians: low physical activity as a possible cause of obesity. Int J Obes Relat Metab Disord 24, 55 – 59.
Fehling PC, Smith DL, Warner SE & Dalsky GP (1999) Comparison of accelerometers with oxygen consumption in older adults during exercise. Med Sci Sports Exerc 31, 171 – 175.
assessment via air-displacement plethysmography in adults and children: a review. Am J Clin Nutr 75, 453 – 467.
Fleisch A (1951) Le me´tabolisme basal standard et sa de´termination au moyen du “Metabocalculator” (Basal standard metabolic rate and its determination by means of the “Metabo-calculator”). Helv Med Acta 18, 23 – 44.
Food and Agriculture Organization/World Health Organization/ United Nations University (1985) Energy and Protein Require-ments. Report of a Joint FAO/WHO/UNU Expert Consultation. Technical Report Series no. 724. Geneva: WHO.
Freedson PS, Melanson E & Sirard J (1998) Calibration of the Computer Science and Applications, Inc. accelerometer. Med Sci Sports Exerc 30, 777 – 781.
Fujimoto S, Watanabe T, Sakamoto A, Yukawa K & Morimoto K (1968) Studies on the physical surface area of Japanese. 18. Calculation formulas in three stages over all ages. Nippon Eiseigaku Zasshi 23, 443 – 450 (In Japanese: English abstract). Harris JA & Benedict FG (1919) A Biometric Study of Basal Metabolism in Man. Publication no. 279. Washington, DC: Carnegie Institute Washington.
Haymes EM & Byrnes WC (1993) Walking and running energy expenditure estimated by Caltrac and indirect calorimetry. Med Sci Sports Exerc 25, 1365 – 1369.
Health Promotion and Nutrition Division, Health Service Bureau, Ministry of Health and Welfare (1996) Recommended Dietary Allowances for the Japanese, 5th revision pp. 20 – 24. Tokyo: Dai-ichi shuppan Co. Ltd.
Jequier E & Schutz Y (1983) Long-term measurements of energy expenditure in humans using a respiration chamber. Am J Clin Nutr 38, 989 – 998.
Levine JA, Baukol PA & Westerterp KR (2001) Validation of the Tracmor triaxial accelerometer system for walking. Med Sci Sports Exerc 33, 1593 – 1597.
Levine JA, Eberhardt NL & Jensen MD (1999) Role of nonexer-cise activity thermogenesis in resistance to fat gain in humans. Science 283, 212 – 214.
Martinez-Gonzalez MA, Martinez JA, Hu FB, Gibney MJ & Kearney J (1999) Physical inactivity, sedentary lifestyle and obesity in the European Union. Int J Obes Relat Metab Disord 23, 1192 – 1201.
Meijer EP, Goris AH, Wouters L & Westerterp KR (2001)
Physical inactivity as a determinant of the physical activity level in the elderly. Int J Obes Relat Metab Disord 25, 935 – 939. Meijer GA, Westerterp KR, Koper H & ten Hoor F (1989) Assessment of energy expenditure by recording heart rate and body acceleration. Med Sci Sports Exerc 21, 343 – 347. Nagamine S & Suzuki S (1964) Anthropometry and body
compo-sition of Japanese young men and women. Hum Biol 36, 8 – 15. Nichols JF, Morgan CG, Sarkin JA, Sallis JF & Calfas KJ (1999) Validity, reliability, and calibration of the Tritrac accelerometer as a measure of physical activity. Med Sci Sports Exerc 31, 908 – 912.
Pate RR, Pratt M, Blair SN, et al. (1995) Physical activity and public health. A recommendation from the Centers for Disease Control and Prevention and the American College of Sports Medicine. J Am Med Assoc 273, 402 – 407.
Ravussin E & Bogardus C (2000) Energy balance and weight regulation: genetics versus environment. Br J Nutr 83, S17 – S20.
Robertson JD & Reid DD (1952) Standards for the basal metabolism of normal people in Britain. Lancet 1, 940 – 943. Schutz Y, Ravussin E, Diethelm R & Jequier E (1982)
Spontaneous physical activity measured by radar in obese and control subject studied in a respiration chamber. Int J Obes 6, 23 – 28.
Schutz Y, Weinsier RL & Hunter GR (2001) Assessment of free-living physical activity in humans: an overview of currently available and proposed new measures. Obes Res 9, 368 – 379. Suzuki I, Kawakami N & Shimizu H (1997) Accuracy of calorie
counter method to assess daily energy expenditure and physical activities in athletes and nonathletes. J Sports Med Phys Fitness 37, 131 – 136.
Terrier P, Aminian K & Schutz Y (2001) Can accelerometry accurately predict the energy cost of uphill/downhill walking? Ergonomics 44, 48 – 62.
Weinsier RL, Hunter GR, Heini AF, Goran MI & Sell SM (1998) The etiology of obesity: relative contribution of metabolic fac-tors, diet, and physical activity. Am J Med 105, 145 – 150. Yamada S & Baba Y (1990) Validity of daily energy expenditure
estimated by calorie counter combined with accelerometer. J Univ Occup Environ Health 12, 77 – 82 (In Japanese: English abstract).