Br. J. Nutr. (1976), 35, 281 28 I
Thermic effect of glucose in obese subjects studied by
direct and indirect calorimetry
BY PH. PITTET, PH. CHAPPUIS, K. ACHESON,
F. DE
TECHTERMANN AND E. JGQUIERDivision of Clinical Physiology and Institute of Physiology, University of Lausanne, I 01 I Lausanne, Switzerland (Received 8 August 1975
-
Accepted 8 September 1975)I . T h e thermic effect of a glucose load (50 g) was studied in ten control and eleven obese female subjects, using both direct and indirect calorimetry simultaneously. Experiments were done under conditions of thermal equilibrium (28O and 3 0 % relative humidity).
2. Thermal balance (heat production measured by indirect calorimetry minus heat losses measured directly) was negative in the control group during the fasting period (heat deficit
-
14.2 _+ 5.0 kJ/m2 per h), whereas that of the obese group was in equilibrium ( + 1.4 t4.8 kJ/ma per h).3. After the glucose load, metabolic rate increased 1 3 . 0 f 1.5 and 5 2 1.3 % in the control and obese groups respectively.
4. In contrast to the metabolic rate, total heat losses were not significantly altered in either group after the glucose load. Total heat losses of the obese group were significantly lower than those of the control group throughout the experimental period.
5. During the experiments the amount of heat stored was increased in both groups. Thermal balance in the control group became positive while that of the obese group remained positive.
6. During the fasting period, the control subjects oxidized more carbohydrates (90.4
mglmin) than lipids (68.8 mglmin), whereas obese subjects oxidized more lipids (103.7 mglmin) than carbohydrates (50.2 mg/min). After the glucose load, the oxidation rate of carbohydrates was increased in both groups to 158-1 mg/min in control subjects and 95-6 mg/ min in obese subjects.
7. The mean skin temperature of the control subjects was significantly higher than that of
the obese subjects and remained higher throughout the postprandial period.
8. These results indicate that: (a) during the fasting period, the energy sources utilized and the thermal balance of the two groups were different; (b) the thermic effect of glucose was less in the obese subjects and, therefore, might be a factor contributing to their low energy expenditure.
It is widely believed that people become obese because they eat relatively more than non-obese individuals. Thus obesity has for many years been attributed to gluttony.. However, this is frequently not the situation (Johnson, Burke & Mayer, 1956;
Stefanik, Heald & Mayer, 1959).
Many other criteria are involved in the development of obesity: e.g. social, economic and genetic profiles, muscular activity and biochemical characteristics. Galton & Bray
(1967) have reported that the activity of the glycerophosphate cycle is reduced in the adipose tissue of obese subjects, suggesting a more efficient use of energy than in control subjects. Miller & Mumford (1966), and Stirling & Stock (1968) suggest that the development of obesity is likely to be due to a thermogenic defect rather than an aberration in appetite, while Linton, Conley, Kuechenmeister & McClusky (1972)
suggest that obese individuals take longer to recognize their feeling of satiety and discomfort with continued eating. Cabanac & Duclaux (1970) have also reported a deficiency in the satiety response to sucrose in obese subjects.
282
PH. PITTET
AND OTHERSI976
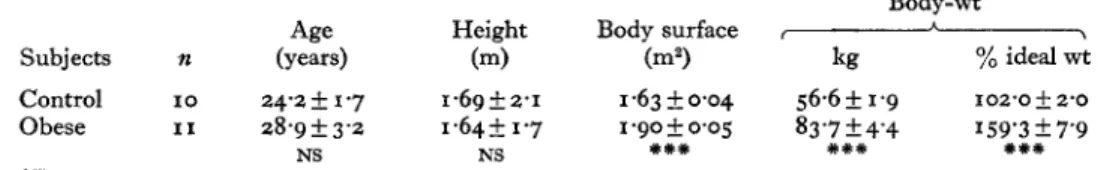
Table I . Main physical characteristics of the two groups of female subjects used in the study
(Mean values with their standard errors)
Body-wt
Age Height Body surface A \
Subjects n (years) (m) bZ) kg % ideal wt
Control 10 24.25 1.7 1.69 5 2.1 1.6350.04 56.6f 1.9 102'0 & 2'0
Obese I 1 28.9&3.2 1.645 1-7 1.90 0.05 83.7 & 4.4 159'3 5 7'9
Ns, not significant.
Differences between mean values for the two groups were statistically significant (unpaired t test) :
# X + X I * *++
NS NS
*++
P < O . O O I .The thermic effect of nutrients represents a loss of energy for the body. Since frankly obese subjects can maintain their weight with a lower energy intake than lean subjects, it was of interest to study whether the thermic effect of glucose might be lower in obese subjects than in lean controls.
We studied oxygen consumption, the oxidation rate of lipids, carbohydrates and proteins, total heat losses and thermal balance in two groups of female subjects, after an oral load of 50 g glucose.
E X P E R I M E N T A L
Two groups of females who were unfamiliar with the equipment were studied in a direct calorimeter as described previously (Pittet, Gygax & Jkquier, 1974).
The first group consisted of eleven obese females, with no evidence of endo- crinological disturbances, and the second was a group of ten healthy, lean female subjects. Their main physical characteristics are given in Table I. Each subject had fasted for 12 h, overnight, and was allowed to rest for I h in a constant temperature room at 28" and 30
yo
relative humidity, before measurements were made. The sub- ject, wearing a minimum of underclothing, was introduced into the calorimeter which was regulated to the same ambient conditions as those of the constant temperature room. Initial (fasting) measurements were taken for40
min or until stable values were obtained. The subject was then given an oral dose of50 g glucose and the measure-
ments were continued for a further 150 min. The following measurements were made continuously throughout the experiment:Internal temperature. This was measured using a tympanic and a sublingual probe.
Mean skin temperature. This was estimated by weighting eight different skin tem- peratures according to the procedure of Hardy & Du Bois (1937).
Metabolic rate and respiratory quotient (RQ). These were estimated from determina- tions of ventilation, and the concentrations of 0, and carbon dioxide in the expired air, using an open-circuit system (Gomez, JCquier, Chabot, Buber & Felber, 1972).
Although the RQ can be influenced by changes in ventilation over short periods (i.e. hypo- or hyperventilation) its integration over 30 min periods corrects for these changes and results in a mean RQ which reflects the true oxidation rate of energy substrates.
The amount of protein (estimated in terms of amino acids) metabolized was cal-
https:/www.cambridge.org/core/terms. https://doi.org/10.1079/BJN19760033
VOl. 35
Thermic eflect
of
glucose in obese subjects
283
culated from the urinary nitrogen excretion (Du Bois,
1924).
The ‘non-protein’ RQwas then determined and the tables of Lusk
(1924)
were used to compute the amount of carbohydrate and lipid (as fatty acids) oxidized during the experiment. Total heat losses were measured by gradient-layer direct calorimetry (Spinnler, JCquier, Favre, Dolivo & Vannotti,1973)
which enabled the separate measurement of‘
dry’
heat losses (radiation+
convection) and‘
evaporative’
heat losses (insensible perspiration and sweating) to be made.Statistical analyses were done using Student’s t test for paired and unpaired results. The threshold of significance was
P
< 0.05.R E S U L T S
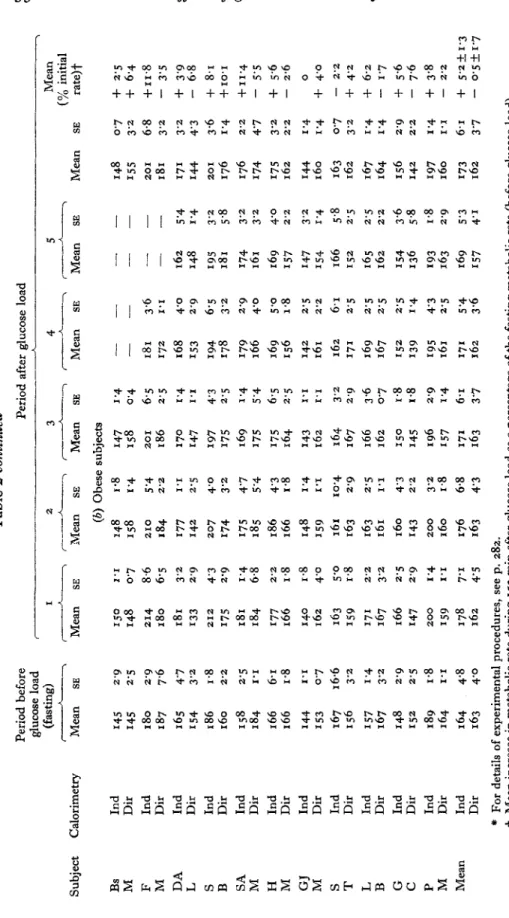
Metabolic rate and heat losses
After the glucose load, the metabolic rate, measured over a period of 150 min, increased significantly in both groups (Table 2). I n the control group, this increase was 13.0
%
of the initial (fasting) value, whereas in the obese group it was only 5.2%,
i.e. about half the thermic effect found in the control group. This difference in metabolic rate stimulation was highly significant (Table 3).During the
150
min after the glucose load neither the total nor the ‘evaporative’ heat losses (which represent about29
%
of the total heat loss) were changed in either group.However, it is important to note that during the fasting period the total heat losses were significantly higher in the control group (Table
3)
and that they remained higher throughout the postprandial period.Oxidation rate of
the
d$ferent substratesThe mean oxidation rates of the different substrates are shown in Fig. I and Table
4.
During the fasting period the control group oxidized mainly carbohydrate
(90.4
mg/ min) whereas the principal energy source utilized by the obese group was lipid(103‘7 mg/min). The oxidation rates (mglmin) of the other substrates were: control group, 68.8 and
34.8
for lipid and protein respectively; obese group, 50.2 and26.8
for carbohydrate and protein respectively.After the glucose load, the oxidation rate of this substrate (carbohydrate) increased significantly in the control group ; lipid utilization decreased slightly and protein metabolism remained virtually unchanged. Although there were similar over-all changes in substrate metabolism in the obese group, the fasting level for the oxidation rate of carbohydrate was approximately half that in the control group for the fasting period and, after the glucose load, the value for the oxidation rate of carbohydrate was similar to that in the control group for the fasting period.
Another point of interest is that the high level of utilization of lipid by the fasting obese subjects remained high after the glucose load.
\D b
$
8.0TO.I - s. I 0.EI+
s.0+
9.12+ s.0+
6.01+ 1.E - L.L+
1,s - 6.61+
n
5
5;
k 2.0+
6.01 + L.Pl+ 1.0 - 1.0 - 8."+ 0.E+
E.II+ 9.E-
S.EI+
s.1 - 6.L+
9.6 0.061 6.5 8.002 6.1 9.881 8.E S.661 1.1 L.661 2.s E.102 8.0 0.161 0.1 z.soz 1.2 E.S61 E.6 S.9Ez 8.0 E.281 S.E 9.161 6.E Z.LI-2 L.I S.S91 9.8 9.'8' 6.1 9.6L1 E.6 0.661 2.2 1.161 0.E L.222 6.1 9.012 6.0 9.881 8.1 0.OL.I as uaam 9.5 8.681 9.L L.661 0.1 6.261 0.9 9.861 1.2 o.E61 0.1 0.161 2.1 L.161 0.6 9.LEz S.E 6.611 6.1 2.681 6.1 1.6S1 E.6 6.6Sr L.0 E.gL1 2.E 2.681 1.E 8.602 6.0 6.SSI 8.6 0.802 6.6 8.602 8.1 E.881 E.6 L.991 8.E L.O&Z 9.E 1.802 0.6 2.061 L.S 8.661 6.1 0.161 o.E 6.602 6.1 1.861 8.L 8.SOZ 5.0 s.681 P.E 6.Soz 2.1 E.E61 9.E 2.822 L.0 s.E81 6.6 S.881 L.1 6.881 9.6 0.612 6.1 6.891 6.2 S.281 6.S 6.261 8.1 z.S91 6.2 6.602 6.1 6.E81 1.1 8.981 6.6 6.812 BS uaam v 6 L.6 E.161 6.5 8.902 2.1 0.L81 6.6 S.Eoz 6.0 6.961 L.2 6.212 6.0 1.661 6.0 L.ooz 6.2 L.802 0.6 9.zPz L.0 s.181 L.1 8.661 $.I Z&I 6.6 E.822 6.1 6.891 E.6 6.961 6.S 2.661 0.s o.SL1 S.z 6.622 6.1 0.LOZ 0.1 0.681 6.1 0.681 6.E 6.881 2.9 2.902 6.S S.Soz L.I 0.E61 1.L 2.002 2.6 9.202 2.1 L.061 6.0 0.181 8.1 E.061 0.s 6.862 L.0 5.181 8.E 0.002 9.1 8.88' 1.9 S.ozz 1.1 L.S91 6.2 S.6L1 0.9 2.661 S.z 0.661 E.6 1.ZL.I 2.2 0.912 8.9 0.202 0.6 9.ElZ z.S E.061 8.S 0.S61 E.1 I.Sg1 L.2 0.581 L.I 0.E61 E.9 6.Eoz 8.1 E.061 5.21 8.E02 0.1 0.002 2.2 L.SZZ S.E 2.S61 9.I 8.88' 1.1 L.S91 6.2 I.ZLI 1.1 S.tL1 6.2 0.6L1 2.2 2.691 1.1 E.102 L.0 s.181 6.9 8.612 2.E 0.861 1.s 1.922 as ueapq I E.S 0.261 0.s 8.LLI E.1 9.LgI 6.E 0.P91 5.2 8.E6I s.2 6.281 S.I 1.L61 6.6 S.061 6.0 6.Soz z.E EL61 L.0 0.281 6.1 8.ZLI 9.1 8.88' 1.1 L.Sg1 L.6 6.291 1.1 S.6LI 6.2 C.6LI 6.E E.681 6.0 6.861 8.s 6.661 1.s 1.922 6.2 1.S61 https:/www.cambridge.org/core/terms . https://doi.org/10.1079/BJN19760033 Downloaded from https:/www.cambridge.org/core. University of Basel Library , on 30 May 2017 at 20:19:22
Table
2
continued
Subject Bs M F M DA L S B SA M H M GJ M S T L B G C P M Mean
Calorimetry
Ind Dir Ind Dir Ind Dir Ind Dir Ind Dir Ind Dir Ind Dir Ind Dir Ind Dir Ind Dir Ind Dir Ind Dir
Period before glucose load (fasting) Period after glucose load I __h_7 Mean
150 148 214 180 181 133 212 I75 181 184 I77 166 140 162 163 I59 171 167 166 147 200 I59 178 I 62
SE I 'I 0.7 8.6 6-5 3'2 2'9 4'3 2.9 1'4 6.8 2'2 1.8 I .8 4'0 5'0 I 4 2'2 3'2 2.5 2.9 I '4 1'1 7.1 45 2 3 7-
----
4 5 .. Mean SE Mean (b) Obese subjects148 158 210 184 I77 142 207 I74 I75 185 I 86 166 148 I59 161 I 63 163 161 I 60 I43 200 I 60 176 163
I *8 1 '4 5 '4 2'2 1'1 2.5 4'0 3'2 4'7 5 '4 4'3 1.8 I '4 1'1 10.4 2.9 2.5 1'1 4'3 2'2 3'2 I .8 6.8 4'3 SE J '4 0.4 6.5 2.5 I '4 I 'I 4'3 2.5 1 '4 5.4 6.5 2'5 1'1 1.1 3'2 2'9 3.6 0.7 I .8 I 4 2.9 1 '4 6.1 3'7 Mean 148 I55 20 181 171 I44
I
20
I
176 176 I74 175 162 144 I 60 163 162 167 164 156 142 I97 I 60 I73 162 SE 0.7 3'2 6.8 3'2 3'2 4'3 3'6 I '4 2'2 4'7 '2 3 2'2 1 '4 1 '4 0.7 3'2 '4 I 1'4 2.9 2'2 1 '4 1'1 6.1 3 '7 Mean (% initial rate)+
+
2.5+
6.4+
11.8-
3'5+
3'9-
6.8+
8.1+
10'1 f11.4 - 5'5+
5.6 - 2.6+
40+
4'2+
6.2-
1.7+
5.6-
7.6+
3.8 0 - 2'2 - 2'2+
5'2kI.3-
0.5k1.7*
For details of experimental procedures, see p. 282.t
Mean increase in metabolic rate during 150 min after glucose load as a percentage of the fasting metabolic rate (before glucose load). w cn YF
P
N h'%
a
N 3'286
PH. PITTET
AND OTHERSI976
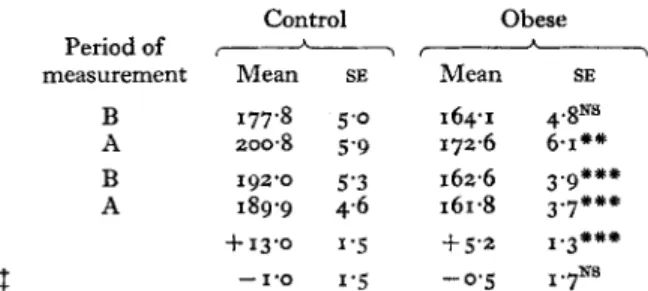
Table 3 . Comparison of the metabolic rates and of the total heat losses, before and after an oral loadof 50 g glucose, for a group of ten female control subjects and for a group of eleven female obese subjectst
(Mean values with their standard errors)
Control Obese
Periodof &
measurement Mean SE Mean SE
Metabolic rate (kJ/m2 per h) B 177.8 5.0 164.1 4.8Ns
A 2008 5.9 172.6 6-1'" Total heat losses (kJ/m2 per h) B 192.0 5.3 162.6 3.9'""
A 189.9 4.6 161.8 3.7'" Change in metabolic rate (yo initial rate)l f13.o 1.5 f 5'2 I.3'#"
Change in total heat losses (% initial rate)$ -1.0 1'5 - 0 . 5 1 . 7 ~ ~
Ns, not significant; B, before glucose load (fasting period); A, during 150 min after glucose load. Differences between mean values for the two groups were statistically significant (unpaired t test) :
t
For details of subjects, see Table I , and for details of experimental procedures, see p. 282.1
Mean change during 150 min after glucose load as a percentage of the fasting value (before glucose'"
P<o.oog;"**
P<O.OOI.load).
Temperatures
The values for the internal and skin temperatures are given in Table
5 .
After the glucose load, the internal temperature of the control subjects tended to increase(+ o - I S O ) , whereas the mean skin temperature remained unchanged.
In the obese subjects, the glucose load did not cause any significant increase in either the internal or the skin temperature.
The results given in Table
5
indicate that the internal temperature of the control subjects was significantly higher than that of the obese subjects during the post- prandial period. Furthermore, the mean skin temperature of the control groupwas
significantly higher than that of the obese group and remained higher throughout the postprandial period.
Thermal balance
All control subjects were in negative thermal balance (heat production minus heat losses) during the fasting period (-
142
+_ 5.0 kJ/m2 per h), i.e. their heat losses were greater than their heat production (Fig. 2). After the glucose load the amount of heatstored increased significantly and the thermal balance became positive (
+
10.8 5.6kJ/mz per h). However, the obese subjects were already in slight positive balance in the preprandial state (+
1.4
k $8 kJ/m2 per h). This positive balance was further re- inforced after the glucose load (+
10.8
& $8 kJ/m2 per h).Energy-free meal
The possibility that the effects we have found were caused by the glucose carrier were minimal. However, three control experiments were done using three of the lean control subjects to study the effect of an oral load of the same volume but without glucose, i.e. 150 ml water
+
lemon juice. No significant changes in metabolic rate orhttps:/www.cambridge.org/core/terms. https://doi.org/10.1079/BJN19760033
VOl.
35
Thermic effect
of
glucose
in obese subjects
C L P C L P
-
Fasting After glucose-
.E 150 E
.
vp
100 c 0 .- 4 . 8 50 9t;
0 C L P C L P-
Fasting After glucose-
Fig. I. Mean oxidation rates (mglmin) of different substrates (C, carbohydrates; L, lipids; P, proteins) during a 40 min control period (fasting) and during 150 min after an oral dose of 50 g glucose, for (a) group of ten female control subjects and for (b) group of eleven female obese subjects. The increase in the glucose oxidation rate after the glucose load was statistically significant for both groups : P < O ~ O I . Vertical bars represent the standard errors of the mean
values.
total heat losses were found (Table 6). The negative thermal balance obtained in the fasting period persisted throughout the experiment. Mean skin temperature was not modified but the internal temperature decreased significantly during the experiment (Table 7) confirming the negative thermal balance. The fasting oxidation rates of the substrates were similar to those obtained in the first part of this experiment and were not significantly modified after ingestion of the energy-free meal (Table
7).
On the basis of these results, we can conclude that an energy-free meal of 150 ml water
+
lemon juice had no significant effect on metabolic rate. Therefore the findings reported in the first part of this study were due to the glucose load.288
PH. PITTET
AND OTHERSI976
Table
4.
Mean oxidation rate (mgimin) of carbohydrate, f a t t y a c i h (lipid) and amino acids (protein), obtained by indirect calorimetry and from urinary nitrogen measurements before and after an oral load of 50g
glucose, for a group of ten female control subjects andfor a group of eleven female obese subjectsf
(Mean values with their standard errors) Metabolites oxidized
A
f ,
Carbohydrate Fatty acids Amino acids
Subjects measurement Mean SE Mean SE Mean SE
Periodof ,pA& -------, Control B 90'4 3'4 68.8 6.1 34.8 3'0 A 159.1 8.6*"* 51.8 5 . ~ ' ~ 29.6 3.gN8
ttt
ttt
NS Obese B 50.2 7'5 103'7 6.0 26% 4'4 A 95.6 I I . ~ * * * 88.6 7 . 0 ~ 30.0 5.9N8N8, not significant; B, before glucose load (fasting period); A, during 150 min after glucose load. Changes in mean oxidation rates for each metabolite for period A were statistically significant: Differences between mean values for oxidation rates for the two groups for period B and for period A $ For details of subjects, see Table I , and for details of experimental procedures, see p. 282.
# P<o.or;
**
P<0.005; * I * P<o.oor.were statistically significant (unpaired t test):
ttt
P < 0.001.Table 5 . Internal temperature (Tint) (") and mean skin temperature
(TCut)
(") measured during the40
min controlperiod (fasting) (initialT)
and during theJina110 min ($nu1 T) of the 150 min period after an oral dose of5 0
g glucose, for a group of ten female controlsubjects and for a group of eleven female obese subjects? (Mean values with their standard errors)
Initial T Final T Change in T
-&-
Mean SE Mean SE Mean SE
36.80 0.10 36.98 0.10 0.18 0.05 36.71 0.05 36.72 0.04 0.01 0.04 # # Tint NS 33;32 0.08 33;72 0.09 0.00 0 0 2
I
)
Tcut Control Obese Control Obese 33'29 0'11 33.41 0'11 0'12 0.05T h e change in T for Ts,,, and for T,,t for both groups was not statistically significant (paired t test).
NS, not significant.
Differences between mean values for Tjat and for Tcut for the two groups were statistically sig-
t
For details of subjects, see Table I, and for details of experimental procedures, see p. 282.nificant (unpaired t test):
*
Pio.05; # * P < O . O Z .D I S C U S S I O N
Obesity is not always the consequence of an absolute excess of energy intake; this excess can be relative if it is accompanied by a decreased energy expenditure. The main factors contributing to decreased energy expenditure in obese subjects are ( a ) de- creased physical activity, ( 6 ) increased energy efficiency of the utilization of nutrients or (c) a lack of thermogenic stimulation, or both b and c.
https:/www.cambridge.org/core/terms. https://doi.org/10.1079/BJN19760033
VOl.
35
Thermic effect of glucose
in obese subjects
Fasting After glucose
+8 +4 h c N E - 0
s
m, 0 - 4.
aJ bn Y YI c1 aJ I - 8 -12 -16289
Fig. 2. Mean thermal balance (heat storage (kJ/m2 per h), i.e. heat production minus heat losses) during a 40 min control period (fasting) and during 150 min after an oral dose of 5 0 g glucose, for a group of ten female control subjects (0) and for a group of eleven female obese subjects (El). The change in thermal balance after the glucose load was statistically sig- nificant: for control group, P < 0.001 ; for obese group, P < 0-05. Vertical bars represent the
standard errors of the mean values.
It
is not the aim of this paper to discuss factors a and b extensively. Decreased physical activity in the obese individual has often been described. Bjorntorp (1966) has found that lipogenesis from glucose is twice as high in the obese as in'
normal-weight'
subjects. There are a few biochemical pathways in intermediary metabolism which can modify energy efficiency, i.e. synthesis of fatty acids from glucose, and oxidation of the glucose produced (Ball & Jungas, 1964), the esterification-hydrolysis cycle for fatty acids (Ball, I 965), and the glycerophosphate-dihydroxyacetone cycle (Galton & Lack of thermogenic stimulation in the obese individual can be accounted for by a weak, dietary-induced thermic effect, and by a low metabolic response to cold.
The results of this study indicate that at an ambient temperature of 2 8 O , obese
subjects have smaller heat losses than control subjects. These results are in agreement with those of Gygax, Pittet & JCquier (1972) and JCquier, Gygax, Pittet & Vannotti
(1974), who reported similar findings at ambient temperatures of 28 and 20'; after 2 h
exposure at 20°, the control subjects tended to stimulate their metabolic rate, but the obese subjects did not.
Our results indicate that, although both obese and control subjects stimulate their metabolic heat production after an oral load of 50 g glucose, this thermic effect was
lower in the obese group (only half that of the control group).
The fasting oxidation rates of the different substrates were different in the obese subjects when compared with the control subjects. The latter oxidized more carbo- Bray, 1967).
Table 6. Heat production (kJ/m2 per h) obtained by indirect calorimetry (Id) and heat losses (kJ/m2 per h) measured by direct calorimetry (Dir) during a 40 min control period (fasting) and during Jive 30 rnin periods after the ingestion of an energy-free meal (150 ml water
+
lemon juice), for three female control subjectse (Mean values with their standard errors) , cd Period before energy-free Period after energy-free meal I meal (fasting) I 2 3 4 5 MeanF
F
2
*
*---**-
(% initial Subjects Calorimetry Mean SE Mean SE Mean SE Mean SB Mean SE Mean SE Mean SE rate)? J Ind D Dir Bo Ind F Dir Bu Ind F Dir Mean Ind Dir Thermal balance1 173.8 0.6 175.6 3.8 171.7 2.0 178.4 2.8 180.3 4.4 180.8 4.5 177.4 1.7+
2.1 179'9 0'8 179.9 0.8 178.4 0.7 180.6 1.0 176.4 0.8 175.6 1.6 178.1 0.9-
1.0 169.5 2.3 171.5 3.8 168.4 46 172.7 7'1 176.8 2.6 172.7 4'4 172'4 1.3+
1'73
173.4' 2'0 174'1 2'1 174'1 1'0 182.0 0.9 177'3 0.5 182.8 2'0 178.1 1.7+
2'7 156.2 8.1 156.5 8.9 151.5 2.3 156.4 5.0 155.2 3.2 153.7 3'7 154.7 0.9 - 1'03
177'7 2'0 176.7 2.5 175.1 1.7 179.2 0.9 178.5 1.1 176.9 0.8 177.3 0.7-
0.2i3
166.5 5.3 167.9 5.8 163.9 6.3 169.2 6.6 170.8 7.8 169.1 8.0 168.2 6.9 f 1.0E!
177'0 1'9 176.9 1.7 175.9 1.3 180.6 0.8 177.4 0.6 178.4 2.2 177.8 0.3+
0.5 -10.5 5'5 -9'7 6.6*
For details of experimental procedures, see p. 282.t
Mean increase in metabolic rate during 150 min after energy-free meal, as a percentage of the fasting metabolic rate (before energy-free meal). $ The difference between heat production and heat losses. https:/www.cambridge.org/core/terms. https://doi.org/10.1079/BJN19760033VOl.
34
Thermic eflect of glucose in obese subjects
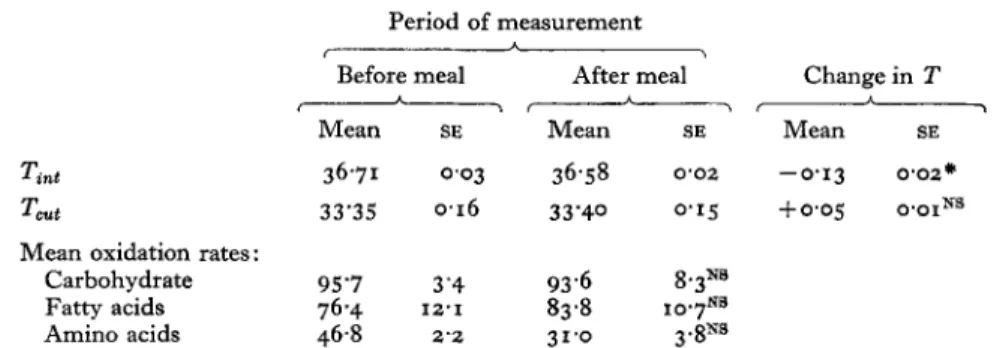
291Table 7. Internal temperature (Tint) (") and mean skin temperature
(T&
(") measured during the40
min control period (fasting) and during the Jinal 10 min of the 1 5 0 minperiod after the ingestion of an energy-free meal
(150
ml water+
lemonjuice), and meanoxidation rate ( ~ / m i n ) of carbohydrate, fatty acids (lipid) and amino acids (protein) obtained by indirect calorimetry and from urinary nitrogen measurements before and after the meal, for three female control subjectst
(Mean values with their standard errors) Period of measurement
*
< ,
Before meal After meal Change in T
&&-
Mean SE Mean SE Mean SE
Tint Tcut
36.71 0.03 36.58 0.02 -0.13 0 . 0 2 ~
33'35 0.16 33'40 0.15 + 0 ' 0 5 O'OINS
Mean oxidation rates:
Carbohydrate 95'7 3'4 93.6 8.3NB
Fatty acids 76.4 12.1 83.8 1 0 . 7 ~ ~
Amino acids 46.8 2 2 31.0 3.SNB
Changes in mean oxidation rates for each metabolite after the energy-free meal were not statistically NS, not significant.
The change in T for Tint was statistically significant:
*
P<o.or.t
For details of experimental procedures, see p. z8z. significant.hydrate
(90-4
mglmin) than lipid(68-8
mg/min), whereas the fasting obese subjects oxidized more lipid(103.7
mg/min) than carbohydrate(50.2
mglmin). After the glucose load there was an increase in glucose metabolism in both groups, but it was much lower in the obese than in the control subjects.Felber, Moody & Vannotti (1965) reported a decrease in the glucbse tolerance of non-obese subjects when the concentration of circulating free fatty acids is increzsed by an infusion of lipids preceding the glucose load. Gomez et al.
(1972)
suggested that this glucose intolerance was probably due to inhibition of carbohydrate oxidation rate by metabolites of free fatty acids as described by Randle, Hales, Garland & Newsholme(1963) in muscle tissue. A similar mechanism could account for our results in obese
subjects.I n our ambient conditions, the thermal balance obtained indicated that the two groups were in a different starting state. The fasting control subjects were in negative thermal balance, their heat losses were greater than their metabolic heat production and their temperatures tended to decrease. On the other hand, fasting obese subjects were in thermal balance, their metabolic heat production was slightly higher than their heat losses and their body temperature was stable.
The ingestion of the glucose induced an important modification in the thermic state of the control subjects: from a negative level, i.e. from a deficit of heat, they reached a positive thermal balance.
292
PH. PITTET
AND OTHERSI976
change in their thermic state. Glucose ingestion only induced a reinforcement of a pre-existing, equilibrated thermal balance.
Thus, the results of this study suggest that an inefficient stimulation of thermo- genesis might be a factor contributing to the low energy expenditure of the obese individual. This decreased dietary-induced thermic effect may be due in part to in- hibition of glucose oxidation by fatty acid metabolites.
It
remains to be determined whether the equilibrated thermal balance of the obese individual is involved in inhibiting the thermic effect found after glucose ingestion. The thermic effect of protein and lipid should also be carefully studied in the obese individual.The authors thank Mrs
M.
Marmier andM.
Oberti for their skilful technical assistance. Financial support from the Nest16 Company, Vevey, Switzerland, is grate- fully acknowledged.R E F E R E N C E S Ball, E. G. (1965). Ann. N . Y. Acad. Sci. 131, 225.
Ball, E. G. & Jungas, R. L. (1964). Recent Prog. Horm. Res. 20, 183.
Bjorntorp, P. (1966). Acta med. scand. 179, 229.
Cabanac, M. & Duclaux, R. (1970). Science, N . Y. 168, 496.
Du Bois, E. F. (1924). Basal Metabolism in Health and Disease, 1st ed., p. 23. Philadelphia: Lea and Felber, J.-P., Moody, A. J. & Vannotti, A. (1965). Helv. med. Acta 32, 323.
Galton, D. J. & Bray, G. A. (1967). J. clin. Endocr. Metab. 27, 1573.
Gomez, F., JCquier, E., Chabot, V., Biiber, V. & Felber, J.-P. (1972). Metabolism 21, 381.
Gygax, P.-H., Pittet, Ph. & Jtquier, E. (1972). Experientia 28, 728.
Hardy, J. D. & D u Bois, E. F. (1937). J. Nutr. 15, 5 .
Jtquier, E., Gygax, P.-H., Pittet, Ph. & Vannotti, A. (1974). J . appl. Physiol. 36, 674.
Johnson, M.-L., Burke, B. S. & Mayer, J. (1956). Am. J. clin. Nutr. 4, 37.
Linton, P.-H., Conley, M., Kuechenmeister, C. & McClusky, H. (1972). Am. J. clin. Nutr. 25, 368.
Lusk, G. (1924). J. biol. Chem. 5 g , 4 1 .
Miller, D. S. & Mumford, P. (1966). Proc. Nutr. Sac. 25, 100.
Pittet, Ph., Gygax; P.-H. & Jkquier, E. (1974). Br. J. Nutr. 31, 343.
Randle, P. J., Hales, C. N., Garland, P. B. & Newsholme, E. A. (1963). Lancet i, 785.
Spinnler, G., Jtquier, E., Favre, R., Dolivo, M. & Vannotti, A. (1973). J. appl. Physiol. 35, 158. Stefanik, P.-A., Heald, F.-P. & Mayer, J. (1959). Am. J . din. Nutr. 7, 5 5 .
Stirling, J. L. & Stock, M. J. (1968). Nature, Lond. 220, 801.
Febiger.
Printed in Great Britain
https:/www.cambridge.org/core/terms. https://doi.org/10.1079/BJN19760033