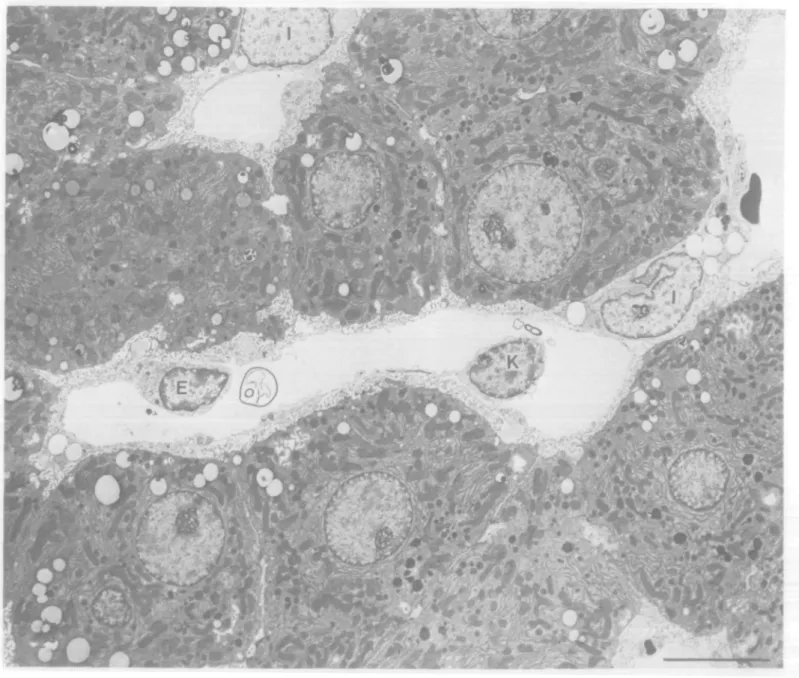
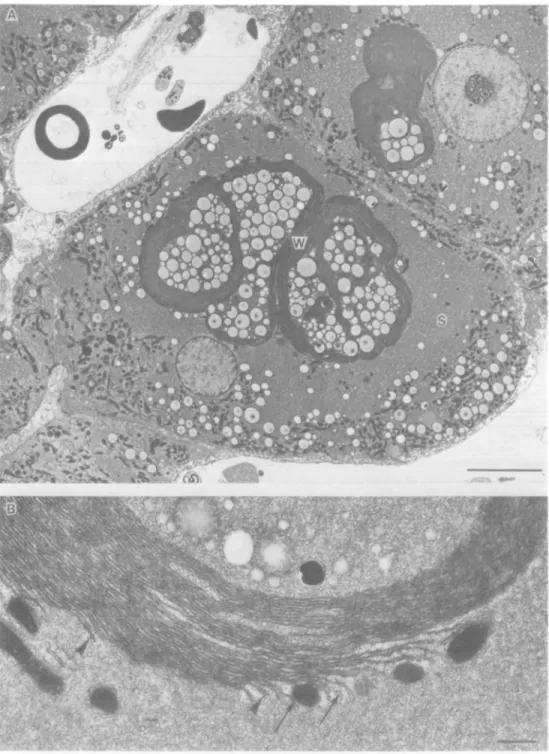
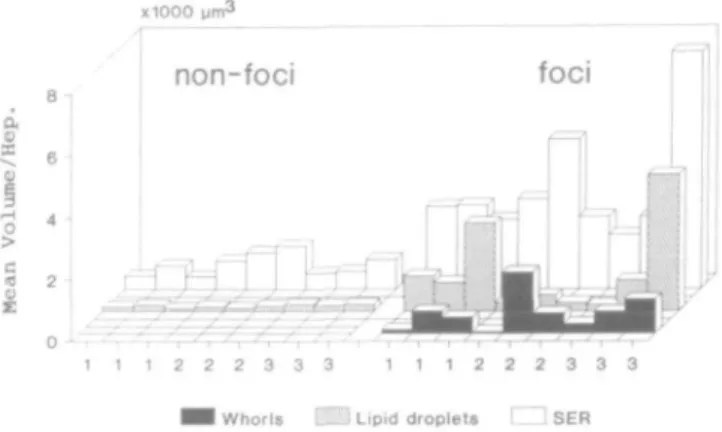
changes m dhemicaily nmdhicedl praneoplastk ffocal
lesnoms m the rat liver: a stereologicail stodly
E.M.Jack, W.Staubli, F.Waechter, P.Bentley, J.Suter,
F.Bieri, S.F.Muakkassah-Kelly and L.M.Cruz-Orive
1 Central Toxicology Unit, Ciba-Geigy Ltd, CH^002 Basel and 'Stereology Unit, Department of Anatomy, University of Bern, CH-3000 Bern, SwitzerlandUltrastructural changes were investigated and quantified,
using a stereological approach, in early
gamma-glutamyl-transpeptidase (GGT)-positive focal lesions, induced in the
rat liver by treatment with a single initiating dose of
diethylnitrosamine (DENA) followed by promotion with
phenobarbitone (PB) for 30 weeks. Within the
extra-hepato-cyte environment of focal tissue, the mean volume occupied
by Ito cells was markedly decreased, whilst that occupied by
endothelial and Kupffer cells was increased, when compared
to unlnvolved tissue from the same rat livers. The bile
canalkuli were dilated, but no significant differences in the
mean volume occupied by the sinusoidal and Disse spaces were
noted. In focal hepatocytes there was a striking
overpro-duction of lipid droplets and proliferation of smooth
endo-plasmlc retkulum (sER). Whorls of concentrically arranged,
parallel ER membranes were found only in the hepatocytes
of preneoplastk foci, in association with the proliferated sER,
and never in the surrounding, uninvolved tissue. The increase
hi mean volume of the sER, lipid droplet and cytoplasmk
matrix compartments, together with the appearance of
whorls, were the major contributing factors to the marked
hypertrophy seen in focal hepatocytes. The mean volume of
the rough endoplasmic reticulum, mitochondrial, lysosomal,
peroxisomal and nuclear compartments per hepatocyte also
increased, but contributed to a lesser extent to the cellular
hypertrophy. It is speculated that whorls may be structural
adaptations, resulting from a possible alteration in the normal
feedback control of cholesterol synthesis, for the production
of sterols and the biogenesis of sER in eosinophilk-ty pe focal
cells. The significance of changes observed in focal tissue, and
the high biological variation noted between foci, is discussed
in relation to the hepatocarcinogenic process.
Introduction
Experimentally induced hepatocarcinogenesis in rodents is
generally regarded as a multistep process (see reviews 1 —4). The
first morphological indications of chemically induced
carcino-genic change in the liver are the appearance of areas or foci of
phenotypically altered cells. Neoplastic nodules and,
sub-sequently, hepatocellular carcinomas develop at later stages in
the chronological progression of hepatocarcinogenesis. Foci are,
therefore, believed to represent preneoplastic stages and may,
'Abbreviations: LM, light microscopy; EM, electron microscopy; rER, rough endoplasmic reticulum; DENA, diethylnitrosamine; PB, phenobarbitone; GGT, gamrna-glutamyltranspeptjdase; sER, smooth endoplasmic reticulum; TGF0, transforming growth factor f}; HMGCoAR, 3-hydroxy-methylglutaryl coenzyme A reductase.
consequently, be important as early indicators of potential
neoplastic change (5).
Foci of altered cells have been widely studied morphologically
and histochemically for differences in enzyme activities using
light microscopy (LM*) (reviewed in 4). In contrast, there have
been few ultrastructural investigations of foci of altered cells
( 6 - 8 ) , probably because of the difficulty in recognizing focal
tissue using electron microscopy (EM). Hirota and Williams (7)
studied foci by EM using iron as an electron-dense marker to
distinguish iron-resistant lesions from the rest of the liver. No
detailed ultrastructural investigation and quantification of
alterations within preneoplastic foci, however, has been reported
before.
In order to characterize early focal changes during
hepato-carcinogenesis, we have adapted a stereological approach to
investigate and quantify alterations within the extra-cellular,
cellular and sub-cellular compartments of preneoplastic lesions.
In addition to stereological ratios, absolute quantities were also
estimated. The limitations of many stereological studies, which
report only ratios when drawing conclusions about the functional
significance of the biological changes, has often been stressed
(9). Foci were chemically induced in the liver of rats using
diemylnitrosamine (DENA) as an initiator and phenobarbitone
(PB) as a promoter, according to the Peraino method (10). To
our knowledge, no previous study has investigated the
ultra-structure of early hepatocarcinogenic changes induced by these
two compounds, which are used in several models of liver cancer
(reviewed in 4). Focal lesions were identified by the presence
of gamma-glutarnyltranspeptidase (GGT) using LM and men
selected for EM. GGT is known to mark 8 0 - 8 5 % of all
pre-neoplastic foci produced by the Peraino protocol (10).
PB as a promoter of liver growth after initiation with a
geno-toxic carcinogen, evokes a pleiotropic response characterized by
an increase in cell proliferation and induction of
drug-metabolizing enzymes (11). Changes in the ploidy levels and in
the percentage of binucleated cells, in response to the mitogenic
effect of PB in DENA-initiated focal lesions, have been recently
reported (12). The effect of PB as a stimulator of cellular
hyper-trophy in the foci was also assessed, revealing a marked increase
in mean hepatocyte volume (12). The sub-cellular changes
underlying mis hypertrophic response evoked by PB in focal
hepatocytes are investigated in this present EM study using the
same material.
Materials and methods
Treatment of animalsGGT-positive foci were induced in newborn female rats (Tif:RAIf strain) using DENA as the initiator and PB as the promoter following the protocol of Peraino
etal. (10). DENA (Fluka AG, Buchs, Switzerland) was administered i.p.
(15 mg/kg body wt in 0.9% NaCl) 24 h after birth. At the age of 3 weeks, the offspring were weaned and fed a casem-enriched (30%) diet, Nafag no. 900 (Nafeg AG, Gossau, Switzerland), which contained 500 p.p.m. PB (Fluka) for 30 weeks. After fasting for 20 h, three animals were anaesthetized with Nembutal (Abbott AG, Zug, Switzerland) and were perfused with 0.9% NaCl and 0.1 % heparin for 2 min, followed by perfusion with 3% paraformaldehyde and 0.4% glutar-aldehyde in 0.1 M phosphate buffer (pH 7.4) for 10 min.
E.M Jack et al.
Stereological analysis
Objectives. As outlined in Figure 1, the following parameters were estimated for
the various compartments in preneoplastic lesions and extra-focal tissue^ from the same rat livers: (1) the volume ratio (Vv), and the mean volume (10, of the
extracellular spaces and the sinusoidal cells per hepatocyte; (H) the volume ratio, and the mean volume, of the organelle compartments per hepatocyte; (iii) the surface ratio (5V), and the mean surface area (S), of the hepatocyte plasma
membrane domains per hepatocyte.
Tissue sampling and processing for stereology.
(i) Each liver lobe was cut into slices (— 5 mm thick) which were then cut into strips (~3.5 mm wide).
(ii) Three strips were systematically chosen per liver and immersed in 3% para-formaldehyde and 0.4% glutaraldehyde in 0.1 M phosphate buffer for 1 h at 4°C and kept in 0.1 M phosphate buffer containing 5% saccharose at 4°C prior to vibratome sectioning.
(iii) Each strip was cut into a series of 100 /im thick vibratome sections ( - 5 x 3.5 x 0.1 mm3).
Civ) Focal tissue was identified in each set of the vibratome sections by its positive staining for GGT (13). GGT-negative tissue was regarded as uninvolved, extra-focal tissue. Two sections were systematically chosen per set of vibratome sections. (v) A block of GGT-positive focal tissue (0.5 x 0.5 x 0.1 mm3) was
trimmed out of one section, and a block of uninvolved tissue of the same size from the other section. Care was taken not to include surrounding, uninvolved tissue when trimming out the foci. For this reason, foci with an area >0.25 mm2
were selected. In non-focal tissue, it was confirmed by LM examination of semi-thin sections, that cells from all lobular zones were included in each block sampled. A total of three blocks of foci and three blocks of extra-focal tissue per animal were selected in this way.
(vi) The blocks were post-fixed in 3% glutaraldehyde in 0.1 M cacodylate buffer, pH 7.4, for 3 h at 4°C, and then in 1% osmium tetroxide in the same buffer for 1 h at 4°C, dehydrated through a series of acetone solutions and embedded in Epon.
(vii) Ultra-thin (70 nm) sections were cut from the top and bottom of each block, using a Reichert 'ultracut' microtome, for ultrastructural stereological analysis. The sections were mounted on 200 mesh copper grids which were coated with a carbon-coated parlodion film, and stained with 5% uranyl acetate and Reynolds lead citrate. The remaining tissue in the block was used for LM to estimate the mean hepatocyte volume (12).
Selection of magnifications and fields. The stereological analysis was made at
three different levels of magnification. Figure 1 shows the various compartments which were analysed for each block of focal tissue and extra-focal tissue per animal, and at which magnification this analysis was made.
One section from the top and from the bottom of the tissue block was examined per magnification level with a Philips transmission electron microscope (EM-300). Fifteen fields on each tissue section were systematically sub-sampled (14). The upper right comer of each of the 15 fields was photographed, at the primary magnifications of X2000, X6800 and X33 000, onto 35 mm film. In this way, a total of 30 micrographs per magnification level were recorded per tissue block. Contact films were made from the 35 mm negatives and the micrographs were
projected in a table projector unit, onto a glass screen displaying a test grid of 57 600 mm2 in area. The final projected magnifications were X6500, X20 000
and X97 000.
Analysis of micrographs. The volume ratio and surface ratio of the various
compartments investigated in the preneoplastic lesions and the extra-focal tissue (Figure 1) were estimated by point counting methods (15). Micrographs at X6500 were examined using a square lattice test system containing 144 points (with an area to test point ratio of 3.9 cm2). Micrographs of X20 000 were examined
using a multipurpose test system containing 168 points and 84 lines of 20 mm in length [with an area to test point ratio of 3.4 cm2, and a test point to test line
length ratio (pit) of 1 cm"1]. Micrographs at X97 000 were examined using a
multipurpose test system containing 42 points and 21 lines of 40 mm in length (with an area to test point ratio of 13.5 cm2, and a test point to test line length ratio of 0.5 cm"1).
(i) Volume ratio (Vy, /jm°). The volume ratio (the ratio of the volume of a
compartment to the volume of the reference space, jim3//im3), also termed the
volume fraction, was estimated for each compartment by dividing the sum of all points that fell on that compartment by the sum of all the points that fell on the reference space. For example, for a given block, the ratio of mitochondrial volume to hepatocyte volume was estimated as follows:
n n
est Vv (mito, hepatocyte) = E Pt (mito)/ E /»,- (hepatocyte)
where E"=, Pt denotes the sum of point counts over n micrographs from the same
block. For the extracellular spaces and sinusoidal spaces, evaluated at xfjOOO, the reference space was the hepatocyte although this was not the containing space. The reference space for the organelles evaluated at X20 000 was the hepatocyte, and at x97 000 the hepatocyte cytoplasm. To convert the volume ratios of the organelles per cytoplasm (evaluated at X97 000) to volume ratios per hepatocyte, the ratios were multiplied by the ratio of cytoplasm volume to hepatocyte volume (estimated at X20 000). For example:
est Vv (sER/cell) = Vv (sER/cytoplasm) x Vv (cytoplasm/cell)
The volume ratios are expressed as a percentage in Tables I and II. (ii) Surface ratio (5V, (im"'). The surface ratio (the ratio of the surface area
of a compartment to the volume of the reference space, pen? I pen?) was estimated by counting the number of intersection points (V) between the membranes and the test lines, and the number of test points (P) which hit the reference space, according to the classical stereological formula 5V = 2/L (15) which, in practical
terms, reads:
est 5V = 2 pit
where pll is the ratio of test points to test line length (real units) and Ej*_ [
n E n E
/,
[ P, Magnification Parameters Reference sp. X6500 _ Kvand V Hepatocyte X20 000 Vy and V; *SV and 5 Hepatocyte X97 000 Vv and V Cytoplasm Foci or Non-foci - Extra-cellular-space Parenchymal C e l l s Parenchymal Sinusoidal-t
Sinusoidal spaceDisse space Bile canaliculi •Hepatocyte I— Whorlst
- — Endothelial cells Kupffer cells Ito cellsRest of cytoplasm Secretory vesicles
t
—— Membrane Nuclei Cytoplasm - • Mitochondria • Lysosomes • Peroxisomes • Lipid droplets• Rest of cytoplasm - - Matrix •sER -rER -Golgi
- Secretory vesicles Fig. 1. Multilevel sampling of compartments, in preneoplastic foci and extra-focal (non-foci") areas from the same liver, for stereological analysis at the EM level. The volume ratio (Vy unr) and the mean surface ratio (5V, fan'1) were estimated by point counting methods. The mean volume (V) and the mean surface area
(S) of each compartment per hepatocyte were calculated by multiplying the volume ratio and surface ratio respectively by the mean hepatocyte volume (the reference space volume) which was estimated independently in a parallel study (12).
and D"=| P, are the total intersection counts and total point counts respectively,
in the n micrographs of the block examined.
(iii) Mean volume (V) and mean surface area (5). Absolute values of the volumes and surface areas per hepatocyte were calculated by multiplying the respective volume and surface ratios J estimated as indicated in (i) and (ii) above] by the mean hepatocyte volume Kriep) (the reference space volume), for example:
x est ^(sER/hep) est P(sER), )im3 per hepatocyte = est
The mean hepatocyte volume was estimated at the LM level using hepatocytes sampled from semi-thick sections which were taken from the same tissue blocks as the ultra-thin sections (12).
Statistical analysis
The biological variation between blocks of focal tissue, and between blocks of non-focal tissue, was derived by subtracting the mean variance within blocks (the stereological error variance) from the total variance between blocks of the volume or surface area estimate (16). Group means within foci and non-foci were compared using a two-tailed Wilcoxon's two-sample rank test (17) with three matched sets (corresponding to the three animals) and three scores for each of the two groups
(namely, three blocks of foci and three of non-foci) within each animal. A P-value of <0.05 was considered statistically significant.
Results
Foci of phenotypically altered cells were induced by treating rats
with PB for 30 weeks after a single dose of DENA. Uninvolved,
extra-focal tissue (Figure 2) was compared to focal tissue
(Figure 3), identified by the presence of the enzyme GGT, to
investigate alterations specific to the early preneoplastic state.
Due to proliferation of the smooth endoplasmic reticulum (sER),
all the foci studied were eosinophilic in nature; no clear cell foci,
which are characterized by glycogen storage, were seen. No
tumours were observed at this stage in the hepatocarcinogenic
process.
For many of the compartments studied, a decrease in the
volume ratio or surface ratio, but an increase in the mean volume
or surface area, was noted in focal tissue (Tables I-ITI). This
was due to the striking increase in the mean hepatocyte volume
(the reference space volume) in focal tissue.
Fig. 2. Extra-focal, uninvolved liver from a rat treated for 30 weeks with PB after a single dose of DENA. The Ito cells (I) within the Disse space, the endothelial cells (E) lining the sinusoids and the Kupffer cells (K) in the sinsuoidal space constitute the non-hepatocyte, sinusoidal cell population of the liver. Bar = 8 /im.
E.M Jack et al.
Fig. 3. GGT-poshive, eosinophilic focal tissue from a rat treated for 30 weeks with PB after a single dose of DENA. (A) Note the increase in hepatocyte
volume compared to non-focal tissue from the same rat liver (Figure 2), the proliferated sER (S) and the presence of whorl-like structures (W) containing lipid droplets and sER, which displace the rest of the organelles to the edge of the cell. (B) Parallel, closely packed ER membranes resembling rER are continuous with the proliferated sER inside and outside (arrows) the whorls, often via a short length of rER (arrowheads). Bar in (A) = 8 ftm; in (B) = 0.5 jun.
Changes in extracellular space and sinusoidal cells (Tables I
and II)
Many focal hepatocytes lost the polyhedral shape characteristic
of cells from normal liver and non-focal tissue. Frequent widening
of the intercellular space was noted between focal hepatocytes.
A decrease in the ratios of the volume of the sinusoidal space,
Disse space and the sinusoidal cells (the endothelial, Kupffer and
Ito cells) to the volume of the hepatocyte was noted in focal tissue
(Table I). The mean volumes of the sinusoidal and Disse spaces
per hepatocyte in focal tissue did not, however, differ significantly
from that of non-focal tissue. The mean volumes occupied by
endothelial and Kupffer cells were greater in focal tissue. In
con-trast, the mean volume occupied by the Ito cells decreased. In
focal tissue, both the ratio of bile canalicular volume to hepatocyte
volume, and the mean volume of the bile canaliculi per
hepatocyte, increased.
The mean surface area of the sinusoidal, intercellular and bile
canalicular plasma membrane domains per hepatocyte increased
in focal tissue (Table II). There were, however, no significant
differences in the proportions of the three membrane domains
between focal and non-focal tissue. A loss of microvilli at the
bile canalicular surface was noted in focal lesions.
Changes in hepatocyte organelles (Table III)
In all the foci studied there was a striking increase in the volume
fraction and mean volume of sER and lipid droplets per
TaWe I. Summary of the stereological analysis of extracellular spaces and sinusoidal cells in GGT-positive focal lesions and extra-focal tissue from the same rat livers
Extracellular spaces Volume ratio, Vv Volume 0*m3), V per hepatocyte
and sinusoidal cells Sinusoidal space Disse space Bile canalicular space Endothelial cells Kupffer cells Ito cells
Values are the means of nine tissue blocks from three animals. The volume ratio is expressed as a percentage. The biological variation between blocks, with the stereological variation removed, is indicated in parentheses.
Differences between focal and non-focal tissue were evaluated by means of a two-sample Wilcoxon's rank test (17), with the three animals regarded as three independent replications: NS, non-significant; *P < 0.05; **P < 0.025; ***P < 0.005.
Table n . Summary of the stereological analysis of the plasma membrane domains in GGT-posirive focal hepatocytes and non-focal hepatocytes from the same rat livers
Non-foci (%) 18.9 8.3 0.5 3.6 1.0 1.3 Foci (%) 9.1 4.3 0.8 2.4 0.8 0.2 Non-foci 1010 (42%) 450 (15%) 30 (0%) 190 (0%) 50 (19%) 70 (0%) Foci 1330 (48%) 600(33%) 130(36%) 330 (22%) 110 (0%) 30 (0%) P NS NS *** • • * • • • •
Plasma membrane domains Surface ratio, Surface area, S per hepatocyte Oun2) % of total plasma membrane
Non-foci Foci Non-foci Foci Non-foci Foci
Sinusoidal Bile canalicular Intercellular
Total plasma membrane
38 14 16 68 30 9 12 51 1990 (0%)" 750 (25%) 840 (12%) 3580 (0%) 4190 (0%)' 1170 (33%) 1680 (47%) 7040 (20%) 5 5 ( l l )b 21 (7) 24 (7) 100 59 (9)b 18(9) 23(6) 100 NS NS NS
Values are the means of nine tissue blocks from three animals.
T h e biological variation between blocks with the stereological variation removed.
bThe standard deviation.
Differences between focal and non-focal tissue were evaluated by means of a two-sample Wilcoxon's rank test (17), with the three animals regarded as three independent replications: NS, not significant; *P < 0.05; **P < 0.025; ***P < 0.005.
Table ID. Summary of the stereological analysis of hepatocyte organelles in GGT-positive focal lesions and extra-focal tissue from the same rat livers
Hepatocyte organelles Volume ratio, Vw
Non-foci (%) 14.5 -3.0 6.4 22.9 1.4 1.5 0.6 1.2 8.1 40.4 Foci (%) 22.2 4.9 3.2 1.2 0.5 7.3 4.8 11.8 0.8 1.0 0.4 0.9 4.9 41
Volume pun ), V per hepatocyte Non-foci 800 (39%) -160 (23%) 340 (16%) 1220 (0%) 80(23%) 80 (12%) 30 (0%) 60 (0%) 430 (26%) 2160(11%) Foci 3270 690 440 170 80 1290 650 1670 120 140 40 120 660 6120 (51%) (76%) (108%) (18%) (37%) (35%) (36%) (87%) (55%) (0%) (56%) P * + • + + • • * • * • * * * * * • NS NS • • * * • sER Whorls: -ER membranes -lipid within -sER/matrix within Lipid droplets rER Mitochondria Lysosomes Peroxisomes Golgi Secretory vesicles Nucleus Cytoplasmic matrix Total hepatocyte 100 100 5360 14 770
Values are the means of nine tissue blocks from three animals. The volume ratio is expressed as a percentage. The biological variation between blocks, with the stereological variation removed, is indicated in parentheses.
Differences between focal and non-focal tissue were evaluated by means of a two-sample Wilcoxon's rank test (17), with the three animals regarded as three independent replications: NS, non-significant; *P < 0.05; **P < 0.025; ***/> < 0.005.
hepatocyte. In addition, whorl-like structures, found in association
with the proliferated sER, were observed (Table HI; Figures 3
and 4). The volume fraction of the other organelles in focal
hepatocytes decreased, although their mean volume slightly
increased. For all the compartments except the nucleus, the
biological variation was greater between blocks of focal tissue
than between non-focal tissue. This was particularly marked in
the sER, lipid droplets and whorl compartments.
Whorl-like structures were found in all foci but never in the
extra-focal tissue (Figure 4). They were located in fields of
proliferated sER which displaced the other hepatocyte organelles
to the cell perimeter. The whorls appeared to be approximately
oval or cylindrical in shape and were made up of tightly packed,
concentric ER membranes which resembled rough endoplasmic
reticulum (rER) and enclosed a lumen containing lipid droplets
and sER tubules (Figure 3). The parallel whorled ER membranes
E.M Jack et al.
X1000 ym3
% of total cell vol. increase
non-foci
foci
n
1 1 1 2 2 2 3 3 3 1 1 1 2 2 2 3 3 3
• I Whorls :!!:'.": Lipid droplet! ' SER
Fig. 4. Changes in the mean volume of sER, lipid droplets and whoris per
hepatocyte (Hep.) from nine GGT-positive focal lesions compared to nine blocks of non-focal tissue from the same rat livers. 1, 2 and 3 denote tissue blocks from animals 1, 2 and 3 respectively.
CD SER/MATRIX 3 LIPID DROPLETS I WHORL ER MEMBRANES
Fig. 5. Comparison of the mean volume of whorl components per
hepatocyte (Hep.) from nine different GGT-positive, eosinophilic focal lesions. The parallel, whorlcd ER membranes enclose a space containing lipid droplets, sER and cytoplasmic matrix. 1, 2 and 3 denote foci from animals 1, 2 and 3 respectively.
were continuous with the rER, and with the proliferated sER both
within the whorls and outside the whorls (Figure 3B). Short
stretches of rER appeared often to link the parallel ER membranes
with the sER membranes. Figure 5 shows the relationship
between the mean volume of whorled membranes, the lipid
droplets, and the sER and matrix within the whorls per hepatocyte
(Figure 5). A close correlation (r = 0.9) was noted between the
whorled membranes and the lipid droplets.
In uninvolved hepatocytes, the rER was arranged in normal
parallel stacks. In focal hepatocytes, however, the rER cisternae
were dispersed and of varying lengths—features that appear to
be associated with the development of liver neoplasia (18).
The mean hepatocyte volume in focal tissue increased by almost
3-fold (12). The contribution of each sub-cellular compartment
to this hypertrophic response is illustrated in Figure 6, by
expressing the increase in the mean volume of each organelle
per hepatocyte as a percentage of the increase in mean hepatocyte
volume.
Discussion
Methodological considerations
The importance of estimating the reference space volume in a
stereological analysis, in order to express parameters not only
as ratios but also in absolute terms, has been often stressed (see
•ER whorl lipid rER mlto. ly»o. perox. golgl ve«. nuc matrix FOCI
Fig. 6. The contribution of each sub-cellular compartment to the increase in
hepatocyte volume (hypertrophy) in preneoplastic focal lesions. The increase in the mean volume of each hepatocyte compartment is expressed as a percentage of the increase in mean cell volume.
ref. 9 for comments about the 'Reference trap') and is illustrated
in this present study. The reference space volume may change
under different experimental conditions, making the interpretation
of ratios alone difficult. This has important implications when
the functional consequences of changes in compartments are being
discussed. A decrease in the volume or surface ratio of a
compartment does not necessarily imply that the volume or
surface area of that compartment has actually decreased.
In the present study, the hepatocyte was defined as the reference
space for the stereological analysis of changes in hepatocyte
organelles in GGT-positive focal tissue compared to non-focal
tissue. The hepatocyte was also used as the reference space for
the analysis of changes in the extracellular spaces and sinusoidal
cells. There are strong indications that preneoplastic foci represent
clonal expansions of single initiated cells (reviewed in 19). It was,
therefore, considered appropriate to express the volumes of
extra-cellular spaces and the sinusoidal cells per volume of uninvolved
hepatocytes (in non-focal tissue) or per volume of focal
hepatocytes (in preneoplastic lesions). The mean hepatocyte
volume was estimated independently from the same tissue blocks
in a parallel study (12). Absolute quantities could, therefore, be
calculated by multiplying the stereological ratios by the mean
hepatocyte volume. Thus a true increase or decrease in the mean
volume or mean surface area of the compartments could be
determined.
Changes in the extra-hepatocyte environment in focal lesions
In preneoplastic foci the bile canalicular lumina were dilated with
a loss of microvilli. These features resembled the pathological
condition of cholestasis in which the excretion of bile is impaired
(20) and have also been described in hepatic neoplastic nodules
and tumours (8,21,22). The volume occupied by the sinusoidal
and the Disse spaces in focal tissue did not differ significantly
from that of non-focal tissue.
Cell-to-cell contact appeared to be reduced between focal
hepatocytes as indicated by a frequent widening of the intercellular
space. It has been speculated that a reduced intercellular contact
in focal lesions could inhibit the intercellular transfer of normal
growth factors and differentiation factors which are required to
maintain homeostasis and would, therefore, favour the persistence
of focal cells and their progression to the neoplastic state (23).
A decrease in the volume occupied by the Ito cells (also termed
fat-storing, lipocytes or stellate cells) was noted in focal lesions.
This is of interest with regard to a recent report that transforming
growth factor /3 (TGF/3), an inhibitor of hepatocyte DNA
synthesis, was found in the sinusoidal cell population. Fausto and
Mead (24) have suggested that TGF/3 functions as a paracrine
inhibitor of hepatocyte DNA synthesis to prevent uncontrolled
proliferation during liver regeneration. In this context, it could
be speculated that a reduction in Ito cells may be involved in
the loss of the normal regulation of cell proliferation in focal
tissue. Ito cells are known to be the major hepatic storage site
of vitamin A (reviewed in 25). Consequently, the observed
change in Ito cells may reflect an altered storage of vitamin A
in focal lesions.
The mean volume occupied by the endothelial and Kupffer cells
was slightly larger than that found in non-focal tissue. When
compared to untreated rat liver (26), the volume occupied by
Kupffer cells (the resident macrophage population), in both focal
and non-focal tissue, appeared to be reduced. This supports the
results of a previous study in which a progressive decrease in
the percentage of Kupffer cells during the hepatocarcinogenic
process was reported (27). Kupffer cells are involved in many
normal hepatic functions (28). A decrease in these functions,
through a reduction in the percentage of Kupffer cells, may be
of importance in the development of focal lesions.
Sub-cellular changes in focal hepatocytes
The most striking changes in DENA-initiated focal hepatocytes
were the formation of whorl-like structures and an overproduction
of sER and lipid droplets. In contrast to the focal hepatocytes,
no whorls were ever observed in uninvolved, non-focal
hepato-cytes. Interestingly, the amount of sER proliferation in non-focal
hepatocytes after 30 weeks treatment with PB (following a single
dose of DENA) was very similar to that reported after
short-term treatment with PB alone (29).
The proliferation of sER, production of lipid droplets and
appearance of whorls, together with the expansion of the
cytoplasmic matrix, were the major contributing factors to the
almost 3-fold increase in the mean focal hepatocyte volume which
was estimated in a parallel study in focal tissue (12). The mean
volumes occupied by the rER, mitochondrial, lysosomal,
peroxisomal and nuclear compartments also increased
signifi-cantly per focal hepatocyte, but contributed to a lesser extent to
the cellular hypertrophy.
Extensive proliferation of sER has been noted in other studies
of preneoplastic and neoplastic stages of liver cancer (6 - 8,22,30)
and appears to be characteristic of eosinophilic cell types. The
proliferation of sER in GGT-positive preneoplastic lesions, which
is accompanied by increased levels of PB-inducible P450
isoenzymes (31), could be associated with an increased production
of active oxygen through modulation of the cytochrome P450
electron transport chain. The production of oxygen radicals has
been reported in liver microsomal preparations from PB-treated
rats (32). There is evidence that an increased concentration of
active oxygen can promote initiated cells to neoplastic growth
(33).
In this present study, the whorl-like structures were always
found in association with proliferated sER. They were made up
of whorled, parallel arrays of ER membranes that resembled rER
and enclosed a lumen containing accumulations of lipid droplets.
Their membranes were often continuous with the rER. It is
possible that they originate from rER and are packed into whorled
arrays by spiral coiling along the length of the structure, giving
rise to sER intermittently within the whorl and to the proliferated
sER lakes at the opposite end of the whorl. Due to their close
association with proliferated sER, whorls could be regarded as
structural adaptations in focal cells providing a high density of
membranes to accommodate the enzymes and other membrane
components involved in the synthesis of sER.
Whorl-like structures (fingerprints or concentric lamellar
arrays), have been described in association with proliferated sER
(i) in normal steroid secreting tissue such as the adrenal cortex
(34) and the testes (35); (ii) in the liver of rats treated
sub-chronically with various hepatotrophic agents (reviewed in 36)
and in hepatocyte cultures treated with nafenopin, a liver tumour
promoter (37); and (iii) in preneoplastic lesions (6), neoplastic
nodules and/or liver tumours after treatment with various
carcinogens including DENA (38), DENA/2-acetylaminofluorene
(8,21), PB (30) and aflatoxin (22).
Recently, whorls were demonstrated to be reversibly induced
in the liver of rats during short-term treatment with inhibitors
of 3-hydroxy-methylglutaryl coenzyme A reductase
(HMGCoAR). These whorls were shown to be rich in
HMGCoAR (39,40). This enzyme catalyses the rate-limiting step
in cholesterol biosynthesis and, in normal liver, is subject to
multivalent negative feedback suppression by sterols and
non-sterol derivatives (41). HMGCoAR is normally located in the
sER and rER (42). In the light of these recent studies using
HMGCoAR inhibitors, and the occurrence of whorls in normal
tissue that is specialized in steroid production, it is interesting
to speculate that the formation of whorls in the liver could be
associated with an altered cholesterol synthesis. Increased
cholesterol synthesis has been reported in the liver of rats treated
with the hepatocarcinogens DENA and PB (43). Furthermore,
the loss of normal feedback inhibition of cholesterol synthesis
has been well characterized in malignant and premalignant hepatic
tissue (44).
We would, therefore, suggest that whorls in preneoplastic foci
could also contain high levels of HMGCoAR, resulting from an
alteration in the normal feedback inhibition of cholesterol on
HMGCoAR in focal cells. It is possible that whorls may be sites
of elevated HMGCoAR activity for the increased production of
cholesterol, which may, in turn, be involved in the biosynthesis
of sER. The accumulation of lipid droplets within the whorl
lumen could indicate a saturation of cholesterol levels within the
cell, since lipid droplets are known to store cholesterol and/or
its esters (45).
The high biological variation between foci, particularly in lipid
droplet content, possibly reflects focal cell populations at different
stages in development during the course of hepatocarcinogenesis.
Vacuolated (fat-storing) cells, together with clear, eosinophilic
and basophilic cell types, have been described in mixed-cell type
foci which appear at a later stage in liver carcinogenesis than
eosinophilic foci (6). A sequential phenotypic conversion of
altered cells, from early appearing clear and eosinophilic foci
through intermediate, mixed cell and basophilic foci, to neoplastic
nodules and, ultimately, carcinomas, during the
hepatocarcino-genic process has been proposed (reviewed in 1). Clear and
eosinophilic foci show only a slightly increased cell proliferation,
whilst the appearance of mixed and basophilic cell populations
in foci, nodules and carcinomas is associated with a pronounced
and steadily increasing cell proliferation (1). In view of this
concept of sequential cellular alteration, the storage of lipid
droplets and the accumulation of sER membranes observed in
this present study may be regarded as adaptive steps in preparation
for subsequent changes to a more rapidly dividing and
organelle-poor basophilic cell type.
E.M Jack et al.
Acknowledgements
The expert technical assistance of C.Zimmermann and K.Brancfli, and photographic assistance of I.Fdrster is gratefully acknowledged. L.M.C.O. acknowledges support from the SNSF, grant no. 31-8838.86.
References
1. Bannasch.P., Enzmann.H., Hacker.H.J., Weber.E. and Zerban.H. (1989) Comparative pathobiotogy of hepatic preneoplasia. In Bannasch.P., Keppler.D. and Weber.G. (eds), Fait Symposium 51. Liver Cell Carcinoma. Kluwer, Dordrecht, pp. 5 5 - 7 6 .
2. Farber.E. and Sarrr^D.S.R. (1987) Hepatocarcinogenesis: a dynamic cellular perspective. Lab. Invest., 56, 4 - 2 2 .
3. Moore.M.A. and Kitagawa,T. (1986) Hepatocarcinogenesis in the rat: the effect of promoters and carcinogens in vivo and in vitro. Int. Rev. Cytol.,
101, 125-173.
4. Peraino.C, Richards.W.L. and Stevens,F.J. (1983) Multistage hepatocarcino-genesis. In Slaga.T.J. (ed.), Mechanisms of Tumor Promotion. CRC Press, Boca Raton, FL, Vol. 1, pp. 1-53.
5. Bannasch.P. (1986) Preneoplastic lesions as end points in carcinogenicity testing. I. Hepatic preneoplasia. Carcinogenesis, 7, 689—695.
6. Bannasch.P., Mayer.D. and Hacker.H.J. (1980) Hepatocellular glycogenosis and hepatocarcinogenesis. Biochim. Biophys. Acta, 605, 217—245. 7. Hirota.N. and Williams.G.M. (1982) Ultrastructural abnormalities in
carcinogen-induced hepatocellular altered foci identified by resistance to iron accumulation. Cancer Res., 42, 2298-2309.
8. Ogawa.K., Medline.A. and Farber.E. (1979) Sequential analysis of hepatic carcinogenesis. A comparative study of the ultrastructure of preneoplastic, malignant, prenatal, postnatal, and regenerating liver. Lab. Invest., 41, 22-35. 9. Braendgaard.H. and Gundersen.H.J.G. (1986) The impact of recent stereo-logical advances on quantitative studies of the nervous system. J. Neurosci.
Methods, 18, 3 9 - 7 8 .
10. Penrino.C, Cames,B.A., Stevens,FJ., StafifekJt,E.F., RusseDJJ., PrapuolenisA, BlomquisU-A., Vessdinovitch.S.D. and Maronpot,R.R. (1988) Comparative developmental and phenotypic properties of altered hepatocyte foci and hepatic tumors in rats. Cancer Res., 48, 4171-4178.
11. Schuhe-Hermann.R. (1987) Initiation and promotion in hepatocarcinogenesis.
Arch. Toxicol., 60, 179-181.
12. Jack.E.M., Bentley.P., Bieri.F., Muakkassah-Kelly.S., Staubli.W., SuterJ., Waechter.F. and Cruz-Orive.L.M. (1990) Increase in hepatocyte volume and nuclear volume, and decrease in the population of binucleated cells, in preneoplastic foci of rat liver: a stereological study using the nucleator method.
Hepatology, 11, 286-297.
13. Rutenburg.A.M., Kim,H.. RschbeinJ., Wasserkrug.H.C. and Seligman.R. (1969) Histochemical and ultrastructural demonstration of gamma-glutamyl transpeptidase activity. J. Histochem. Cytochem., 17, 517-526. 14. MuDer.A.E,. Cruz-Orive.L.M., Gehr,P. and Weibd.E.R. (1981) Comparison
of two subsampling methods for electron microscopic morpbometry. J.
Microsc, 123, 3 5 - 4 9 .
15. Weibel.E.R. (1979) Stereological Methods, Vol. 1: Practical Methods for
Biological Morphometry. Academic Press, London.
16. Gundersen.H J.G .and Osterby.R. (1981) Optimizing sampling efficiency of stereological studies in biology: or 'Do more less well!' J. Microsc, 121, 6 5 - 7 3 .
17. Meddis,R. (1984) Statistics Using Ranks: A Unified Approach. Basil Blackwell, Oxford.
18. Winton.D.J., Flaks.B. and Flaks.A. (1988) Quantitative electron microscopy of carcinogen-induced alterations in hepatocyte rough endoplasmk reticulum. I. Chronic effect of 3'MeDAB and short-term effects of azo dyes of different carcinogenic potentials. Carcinogenesis, 9, 987-999.
19. Rabes,H.M. (1989) Cell proliferation and clonal development in hepatocarcino-genesis. In Bannasch.P., Keppler.D. and Weber.G. (eds), Folk Symposium
51. Liver Cell Carcinoma. Kluwer, Dordrecht, pp. 305-313.
20. Phillips.M J . , Poucdl.S. and Oda.M. (1986) Mechanisms of cholestasis. Lab.
Invest.. 54, 593-608.
21. Heijden van der.C.A. and DormansJ.A.M.A. (1981) Short-term induction of neoplastic nodules in the rat liver. II. Study of their development and the effects of withdrawal of 2-acetylaminofluorene. Carcinogenesis, 2, 147-156. 22. Pritchard.DJ. and Butler.W.H. (1988) The ultrastructural features of aflatoxin
B|-induced lesions in the rat liver. Br. J. Exp. Pathol., 69, 793-804. 23. Williams.G.M. (1981) Liver carcinogenesis: the role for some chemicals of
an epigenetic mechanism of liver tumour promotion involving modification of the cell membrane. Food Cosmet. Toxicol., 19, 577-583.
24. Fausto.N. and MeadJ.E. (1989) Regulation of liver growth: protooncogencs and transforming growth factors. Lab. Invest., 60, 4—13.
25. Fahimi.H.D. (1982) Sinusoidal endothelial cells and perisinusoidal fat-storing
cells: structure and function. In Arias.I.M., Popper,H., Schachter.D. and Shafritz.D.A. (eds), The Liver: Biology and Pathobiology. Raven Press, New York, pp. 495-506.
26. Blouin.A., Bolender,R.P. and Weibel.E.R. (1977) Distribution of organdies and membranes between hepatocytes and non-hepatocytes in the rat liver parenchyma: a stereological study. J. Cell Biol., 72, 441-455. 27. Janossy.L , Zalatnai.A. and Lapis,K. (1986) Quantitative light microscopic
study on the distribution of Kupffer cells during chemical hepatocarcinogenesis in the rat. Carcinogenesis, 7, 1365 — 1369.
28. Jones.E.A. and SummerfiekU.A. (1988) Kupffer cells. In Arias,I.M., Jakoby.W.B., Popper.H., Schachter.D. and Shafritz.D.A. (eds), The Liver:
Biology and Palhobiology. Raven Press, New York, pp. 683-704.
29. Stfiubli.W., Hess,R. and Weibel.E. (1969) Correlated morphometric and biochemical studies on the liver cell. II. Effects of phenobarbital on rat hepatocytes. J. Cell Biol., 42, 92-112.
30. Feldman.D., Swarm.R.L. and Becker J. (1981) Ultrastructural study of rat liver and liver neoplasms after long-term treatment with phenobarbital. Cancer
Res., 41, 2151-2162.
31. Buchmann.A., Schwarz.M., Schmitt.R., Wolf,R., Oesch.F. and Kunz.W. (1987) Development of cytochrome P-450-altered preneoplastic and neoplastic lesions during nitrosamine-induced hepatocarcinogenesis in the rat. Cancer
Res., 47, 2911-2918.
32. Kuthan.H. and Ullrich.V. (1982) Oxidase and oxygenase function of the microsomal cytochrome P450 monooxygenase system. Eur. J. Biochem., 126, 583-588.
33. Cerutti.P.A. (1985) Prooxidant states and tumor promotion. Science, 227, 375-381.
34. Black.V.H. (1972) The development of smooth-surfaced endoplasmic reticutum in adrenal cortical cells of fetal guinea pigs. Am. J. Anal., 135, 381-417. 35. Christensen.A.K. (1965) The fine structure of testicular interstitial cells in
guinea pigs. J. Cell Biol., 26, 911-935.
36. Stenger.R.J. (1970) Organdie pathology of the liver. The endoplasmic reticulum. Gastroenlerology, 58, 554—574.
37. Muakkassah-Kelly.S.F., Bieri.F., Waechter.F., Bentley.P. and Staubli.W. (1988) The use of primary cultures of adult rat hepatocytes to study induction of enzymes and DNA synthesis: effect of nafenopin and electroporation.
Experientia, 44, 823-827.
38. Svoboda.D. and Higginson J. (1968) A comparison of ultrastructural changes in rat liver due to chemical carcinogens. Cancer Res., 28, 1703 — 1733. 39. Li.A.C, Tanaka.R.D., Callaway.K., Fogelman.A.M. and Edwards,P.A. (1988) Localizaton of 3-hydroxy-3-mcthylglutaryl CoA reductase and 3-hydroxy-3-methylglutaryl CoA synthase in the rat liver and intestine is affected by cholestyramine and mevinolin. J. Lipid Res., 29, 781—796. 40. Singer.I.I., Scott.S., Kazazis.D.M. and HuffJ.W. (1988) Lovastatin, an
inhibitor of cholesterol synthesis, induces hydroxymethylglutaryl-coenzyme A reductase directly on membranes of expanded smooth endoplasmic reticulum in rat hepatocytes. Proc. Nail. Acad. Sd. USA, 85, 5264-5268. 41. Nakanishi.M., Goldstein,.!.L. and Brown,M.S. (1988) Multivalent control
of 3-hydroxy-3-methylglutaryl coenzyme A reductase. Mevalonate-derived product inhibits translation of mRNA and accelerates degradation of enzyme.
J. Biol. Chem., 263, 8929-8937.
42. Reinhart,M.P., BillheimerJ.T., FausUR- and GaylorJ.L. (1987) SubceUular localization of the enzymes of cholesterol biosynthesis and metabolism in rat liver. J. Biol. Chem., 262, 9649-9655.
43. Gregg.R.G., Davidson,M. and Wilce,P.A. (1986) Cholesterol synthesis and HMG CoA reductase activity during hepatocarcinogenesis in rats. Int. J.
Biochem., 18, 389-393.
44. Siperstein,M.D. (1984) Role of cholesterogenesis and isoprenoid synthesis in DNA replication and cell growth. J. Upid Res., 25, 1462-1468. 45. OntkoJ.A., Perrin,L. and Horne.L.S. (1986) Isolation of hepatocellular lipid
droplets: the separation of distinct subpopulations. J. Lipid Res., 27, 1097-1103.
Received on March 8, 1990; revised on June 11, 1990; accepted on June 18, 1990