State-of-the-Art: LCIA
I II
Life Cycle Impact Assessment Workshop Summary
Midpoints versus Endpoints: The Sacrifices and Benefits
Jane C. Bare 1, Patrick Hofstetter 2, David W. Pennington 3 and Hellas A. U d o de H a e s 4I U.S. Environmental Protection Agency (EPA), National Risk Management Research Laboratory, Cincinnati, Ohio 45268, USA 2ORISE Research Fellow, U.S. EPA, National Risk Management Research Laboratory, Cincinnati, Ohio 45268, USA 3 Laboratory of Ecosystem Management, Ecole Polytechnique F6ddrale de Lausanne (EPFL), CH-1015 Lausanne, Switzerland 4Centre of Environmental Science (CML), Leiden University, P.O. Box 9518, NL-2300 RA Leiden, Netherlands
Corresponding author: Jane C. Bare; e-mail: [email protected]
Abstract. On May 25-26, 2000 in Brighton (England), the third in a series of international workshops was held under the um- brella of UNEP addressing issues in Life Cycle Impact Assess- ment (LCIA). The workshop provided a forum for experts to dis- cuss midpoint vs. endpoint modeling. Midpoints are considered to be links in the cause-effect chain (environmental mechanism) of an impact category, prior to the endpoints, at which charac- terization factors or indicators can be derived to reflect the rela- tive importance of emissions or extractions. Common examples of midpoint characterization factors include ozone depletion potentials, global warming potentials, and photochemical ozone (smog) creation potentials. Recently, however, some methodolo- gies have adopted characterization factors at an endpoint level in the cause-effect chain for all categories of impact (e.g., human health impadts in terms of disability adjusted life years for carcinogenicity, climate change, ozone depletion, photochemical ozone creation; or impacts in terms of changes in biodiversity, etc.). The topics addressed at this workshop included the implica- tions of midpoint versus endpoint indicators with respect to un- certainty (parameter, model and scenario), transparency and the ability to subsequently resolve trade-offs across impact categories using weighting techniques. The workshop closed with a consen- sus that both midpoint and endpoint methodologies provide use- ful information to the decision maker, prompting the call for tools that include both in a consistent framework.
Keywords: Categories of impact; cause-effect chain; decision making; endpoint modeling; global warming potentials; ISO 14042; LCA; LCIA; Life Cycle Assessment (LCA); Life Cycle Impact Assessment (LCIA); midpoint modeling; ozone deple- tion potentials; photochemical ozone (smog) creation potentials
Introduction
In June 1998 in San Francisco (USA), the workshop 'To- wards Global Use of LCA' was held to develop recommen- dations and an action plan that would lead towards greater use of LCA in the context of sustainable development, in- cluding its use in developing countries (UNEP 1999). In November 1998 in Brussels participants of the 'Life Cycle Impact Assessment Sophistication' workshop addressed the need for increased sophistication in LCIA, whilst recogniz- ing the conflict that this might have in terms of the compre- hensiveness and holistic character of LCIA, as well as the
increase in data need in the LCI phase (Bare et al. 1999).
One of the key issues raised - midpoint versus endpoint m o d e l i n g - became the focus of the third international work- shop, held in Brighton on May 25-26, 2000, and summa- rized in this paper.
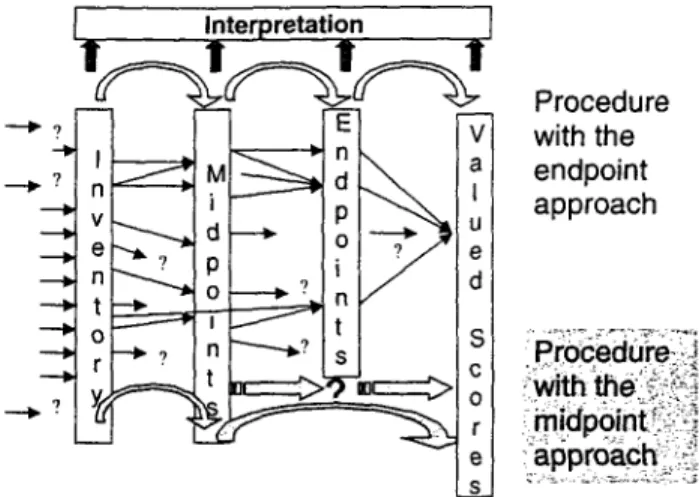
Although the terms have yet to be rigorously defined, mid- points are considered to be a point in the cause-effect chain (environmental mechanism) of a particular impact category, prior to the endpoint, at which characterization factors can be calculated to reflect the relative importance of an emis- sion or extraction in a Life Cycle Inventory (LCI) (e.g., glo- bal warming potentials defined in terms of radiative forcing and atmospheric half-life differences). Examples of meth- odologies based on midpoint characterization factors include Heijungs et al. (1992) and Ecolndicators '95 (Goedkoop 1995). However, particularly in LCA studies that require the analysis of tradeoffs between and/or aggregation across impact categories, endpoint-based approaches are gaining popularity. Such methodologies include assessing human health and ecosystem impacts at the endpoint that may oc- cur as a result of climate change, ozone depletion, as well as other categories traditionally addressed using midpoint cat- egory indicators. Examples of endpoint methodologies in- clude Steen et al. (1992), ExternE (1995), ESEERCO (1995), and EcoIndicators '99 (Goedkoop & Spriensma 1999). Fig. 1 shows the steps that can be involved if a practitioner wishes to take an LCA study from the inventory stage, via impact assessment, to a single comparison metric using weighting techniques (both economic and/or panel ap- proaches). Two different routes are presented, representing the routes taken when using midpoint and endpoint ap- proaches. One of the key differences between midpoint and endpoint approaches is the way in which the environmental relevance of category indicators is taken into account. In midpoint approaches, the environmental relevance is gener- ally presented in the form of qualitative relationships, sta- tistics and review articles; however, it could similarly be quantified using endpoint methods to provide insights to the decision maker. In endpoint approaches there is no need to deal separately with the environmental relevance of the category indicators, because the indicators are chosen at an
I
Interpretation
I
,
ProceO e
9 with then i- ~-ii ~
~ [""~ I endpoint
i ~ i ~
"/''
e v n F ' ' - ' ' ~ l
Pd { ~- ~ ( ~
] * " ' ~dU approach ,
! ~ Z
~=r____.~ s :Pr~
o sFig. 1: Graphical representation of some basic differences between the midpoint (lower row of swinging arrows) and the endpoint approach (upper row of swinging arrows). The small arrows represent models that add infor- mation in a cause-effect framework. The question marks indicate informa- tion that was available but could not be further modeled. Such cases in- c l u d e u n m e a s u r e d e m i s s i o n s , u n c o n s i d e r e d t y p e s of releases (occupational, accidental), and substances where endpoint models have still to be established (e.g. neurotoxic effects on human health)
endpoint level and are generally considered more understand- able to the decision makers. As a result different types of results are presented to the decision maker.
Endpoint modeling may facilitate more structured and in- formed weighting, in particular science-based aggregation across categories in terms of common parameters (for ex- ample, human health impacts associated with climate change can be compared with those of ozone depletion using a com- mon basis such as DALYs - Disability Adjusted Life Years). Proponents of midpoint modeling believe, however, that the availability of reliable data and sufficiently robust models remains too limited to support endpoint modeling. Many believe that extending the models to endpoints reduces their level of comprehensiveness (the number of pathways and endpoints in the cause-effect chains that are represented be- yond well characterized midpoints) and that such extensions will be based on a significant number of additional, unsub- stantiated assumptions and/or value choices, (which may not reflect the viewpoint of other experts and/or the user) to fill in missing gaps. One major concern is that uncertainties (model, scenario and parameter) may be extremely high be- yond well-characterized midpoints, resulting in a mislead- ing sense of accuracy and improvement over the midpoint indicators when presented to weighting panels and decision makers. Many-modelers believe that the additional complex- ity and detail is only warranted if it can be demonstrated to provide an improvement in the decision-making basis. The Brighton workshop was conceived to present both sides of the midpoint versus endpoint argument to an interna- tional group of approximately 50 experts and to allow these participants adequate time to discuss the relative merits and limitations of the approaches. A summary of the presenta- tions, discussions and the outcome is presented below.
1 P r e s e n t a t i o n s
This section provides short summaries of each platform pres- entation. Extended abstracts and slides will be available later in a full report.
Jane Bare of the U.S. Environmental Protection Agency (EPA) opened the workshop with the presentation entitled: Mid- points vs. Endpoints - H o w Do We Decide? She pointed out that there are several reasons for conducting LCIAs, includ- ing LCIAs for enlightenment (which she defined as LCIAs which are used within a larger decision making framework and do not require impact category consolidation) and com- parative LCIAs (which may be presented with the desire to determine which of two or more options is more environ- mentally friendly). Within LCIAs for enlightenment there may be no desire to consolidate the information of the LCIA into a single score. Decision makers may select the LCIA impact categories that are most closely related to their envi- ronmental values or ethics, and/or LCIA impact categories they wish to use for communication. In this case, a mid- point and an endpoint approach may be equally desirable. In comparative LCIAs consistency is important and to pro- vide a consistent decision making framework in situations where trade-offs are necessary, a single score or weighted re- sult may be the goal of the study. Bare then outlined some of the issues with midpoint and endpoint modeling. She proposed that endpoint modeling may facilitate a more structured and informed weighting process, which may include economic tech- niques, but she also stated that a high level of knowledge, data quality, and expert involvement was necessary in forecasting specific endpoint effects. She used the example of ozone de- pletion. While the midpoint modeling of ozone depletion char- acterization factors may in principle encompass the consid- eration of crop damage, immune system suppression, marine life damage, and damage to materials, currently, these endpoints are not included in popular endpoint methodolo- gies such as Ecolndicator '99. She also noted that endpoint modeling may introduce assumptions that are not always com- patible with LCIA, are not transparent to the user and may conflict with the values and/or wishes of the decision maker (e.g., human health may not include all possible endpoints). Bare concluded her talk by suggesting that there are advan- tages and disadvantages to each approach and suggested that both midpoint and endpoint approaches might be used to- gether to provide more information.
Bas de Leeuw of the United Nations Environment Pro- gramme (UNEP) presented 'LCA: Untapped Potential for Sustainable Consumption and Production Policies'. Within this talk he presented the analogy of a car and driver - chal- lenging researchers to determine the 'best science' and build software that would enable practitioners to use these mod- els with a very low level of knowledge. He presented the role of UNEP in the LCA process, including: encouraging the use of LCA, helping to build consensus, and bringing LCA to developing countries. He stated that he believed that the production side has embraced LCA application, but the application of LCA to the consumption side of the problem has not been well studied despite the growing awareness among the public (and hence policy makers) about the 'world behind the product'.
Mark Goedkoop of Pr4 Consulting presented 'The Benefit of Endpoints'. Instead of discussing what is the best, he stressed the focus on what is the most appropriate level of aggregation to communicate with the audiences in a com- pany. As many audiences, especially decision makers, can- not relate to rather abstract midpoints, endpoint modeling is required, as well as midpoint modeling. He noted that an attempt had been made to incorporate all possible value perspectives in the models by allowing endpoint calculation based on Hierarchist, Individualist, and Egalitarian viewpoints. He stated that the weighting process is difficult enough with- out expecting the panelists to model endpoints. He discussed some of the issues with the weighting process including panelists' incorporation of observed, perceived, and predicted damages. He suggested that fewer endpoints were better than too many. Ecolndicators '99 has human health, ecosystem quality, and resources. He suggested that the weighting proc- ess may take a different form if panelists are able to use the weighting triangle instead of estimating deterministic weight- ing factors. Goedkoop acknowledged the many assumptions and large data uncertainty in endpoint modeling and acknowl- edged the incomprehensive nature of the endpoints at this time. Goedkoop concluded by answering some of the questions written by the workshop chairs prior to the workshop. He believed there are gaps in endpoint modeling, but that these gaps are not a fundamental problem. He also felt that there is a need to avoid bias within all types of models. He recom- mended more weighting panels using both endpoint and mid-
point modeling, and recommended that research continue for both approaches, preferably as one consistent system that can supply data at both midpoint and endpoint level.
Hellas Udo de Haes of the Centre of Environmental Science (CML) presented 'The Advantages of Midpoint Modeling'. He considered endpoint modeling to be scientifically chal- lenging, but with a much smaller reach, (i.e., much less en- compassing) and much higher uncertainty compared with midpoint modeling. He referred to midpoint modeling as the traditional approach with a relatively good level of (model parameter) certainty at the level of characterization modeling, and quite encompassing with respect to the reach of the endpoints involved. However, in midpoint models a lot of the uncertainty is not included in the characterization modeling but is in the environmental relevance of the cat- egory indicators providing information about the links be- tween the midpoint indicators and the respective endpoints (e.g. uncertainty associated with missing pathways in the cause- effect chain and not taking the indicator to an endpoint meas- ure). Udo de Haes then proposed a new framework (Fig. 2) for the areas of protection in LCIA, which distinguishes four areas of protection: resources, human health, biodiversity, and life support system. Individual impact categories are related to one or more of these areas of protection. The newly in- cluded area of protection, the life support system, deals with the supporting role of processes in the environment that en- able sustainable life on earth. The use of characterization fac-
v i r o n r n e ~
Resource Availability abiotic resources biotic resources land competition
Life Support System Human Health climate change trop.oxidant form strat, ozone depletion human toxicity acidification radiation nutrification noise, odour soil erosion work environment hydrological c h a n g e Biodiversity land productivity ecotoxicity
hunting
introd.new species land use: species loss Fig. 2: Proposed Framework for four areas of p?otection based on both midpoint and endpoint indicators
tors at the midpoint level is desirable for this category, not as a second best option as long as endpoint modeling is not yet feasible, but because these midpoint indicators reflect the im- pacts on the life support system itself. Categories for which this is pertinent include: climate change, ozone depletion, acidification and eutrophication.
Patrick Hofstetter of the U.S. EPA presented 'Looking at the Full Picture - Implications Associated with Valuation'. He restricted his presentations to cases where trade-offs between category indicators are needed and focused on methods that use stated preferences to do so (panel methods, WTP etc.). Based on descriptive decision analysis literature, he explained how important the selection of impact categories is on the final weighting step. Confronted with the question of how to allocate 100 importance points to a number of impact categories human beings tend to anchor their answers around 100 points divided by the number of impact categories. A review of recent panel studies in LCA confirmed that an- choring may have biased the studies. One step (among oth- ers) to avoid anchoring is to present category indicators that are perceivable and have a meaning, i.e. , preferences may exist. Although endpoint approaches can potentially fulfill this requirement better than midpoint-based methods this is not yet the actual case. Both, midpoint and endpoint indica- tors are presently not based on a careful selection procedure that reflects societal consensus or the involvement of deci- sion makers. Further research may well show that the way mass media and communication deals with environmental problems is finally decisive for the selection of the modeling level. Based on criteria like the 'perceivability of indicators' and the 'possibility to provide more detailed information' Hofstetter also showed how the level of modeling influences the type of weighting methods that can be used. He con- cluded this evaluation with the finding that midpoint ap- proaches appear not to fit with stated preference methods that elicit societal preferences.
In contradiction to Udo de Haes, Hofstetter claimed that from a decision support perspective the modeling at the endpoint level does not have more gaps than midpoint ap- proaches. He suggested that true gaps in knowledge and understanding should rather be captured by a parallel pre- cautionary index than by unstructured lists of suspected ef- fects due to environmental mechanisms captured by mid- point indicators.
Dik van de Meent of RIVM (National Institute of Public Health and the Environment) presented 'Ecological Impact Assessment of Toxic Substances: All the Way to the Endpoint?'. He discussed the four steps to endpoint modeling as follows:
1) from functional unit to release inventory 2) from emissions to concentrations,
3) from concentrations to 'toxic pressure' and 4) from 'toxic pressure' to 'environment stress'.
He discussed ways to deal with unavailable data through estimation techniques, and the high level of correlation among chemicals with the same toxic mode of action. He provided greater detail in the fourth step for specific cir- cumstances within the Dutch environment. He concluded
by answering the chair's questions. He stated that some of the key assumptions included are:
1) Is vegetation representative of the ecosystems?
2) Are heavy metals representative of toxic environment stress ?
3) And was a proper extension made to specific midpoint categories such as ozone depletion and climate change? Finally, he listed the primary uncertainties involved in the extension from midpoint to endpoint in this case.
David Pennington of the U.S. EPA presented 'Midpoint vs. Endpoint Issues: Toxicological Burden on Aquatic Ecosys- tems'. He opened with a discussion that some straightfor- ward approaches based on indicators of implicit concern (usually midpoint indicators such as persistence, bioaccumu- lation and toxic potency scores) can be used to double check the results of models that attempt to more explicitly repre- sent the fate and exposure mechanisms of chemicals in the environment (similar to Hofstetter's parallel precautionary index used to check for gaps). In one cited case study, the limited representation of the aquatic food web in a multi- media model had resulted in misleadingly low characteriza- tion factors for some chemicals. The error was spotted through such a crosscheck. Moving from this methodologi- cal overview, he then discussed the relative merits and com- plexities of the linear versus the tangential gradient as the measure of toxicological potency used in the calculation of characterization factors. It was stressed that both gradients are endpoint measures (change in percentage of stressed spe- cies in the case of ecosystems; the percentage of individuals in the case of human health), that there are limitations asso- ciated with this endpoint basis (e.g., increases in stress on an already stressed group of species and the potential for extinction are not measured), and that a common midpoint in the cause-effect chain of toxicological impacts does not exist to support comparisons in LCA. He concluded that uncertainties (parameter, model and scenario) must be stated before distinctions amongst alternatives can be expressed and that extreme caution is required when adopting com- plex LCIA methodologies, as they may not be scientifically robust and can be built on assumptions that add little addi- tional information, or even increase uncertainty.
Tom McKone of the University of California Berkeley pre- sented 'Midpoint vs. Endpoint Modeling of Human Health'. McKone compared the two levels by saying that one repre- sented greater relevancy (endpoints) while the other represented greater reliability (midpoints). He pointed out that the field of human health modeling is much more complex than most LCA researchers might realize. Human effects can be deterministic (i.e., effect and severity directly related to exposure, as in a sunburn) or stochastic (i.e., effect, but not severity related to exposure, as in cancerous effects). He stated that there is a dearth of information in this area - fewer than 30 chemicals have human carcinogenic data available, while only approxi- mately 200 chemicals have animal carcinogenic test data. For other chemicals and other types of health effects we have to make highly uncertain estimates of dose-response rela- tionships. He concluded that midpoint models provide more opportunities for scientific validation than endpoint models
(e.g., for acidification it is easier to measure pH than to measure affected species) and eventually, midpoint models could be extrapolated into endpoint approaches so long as the resulting loss of reliability is addressed.
Wolfram Krewitt of the University of Stuttgart, presented 'Advantages and Limitations of Endpoint Modeling - Expe- riences from ExternE'. Krewitt pointed out that all models should fit the goal and scope of the study, and in the case of ExternE the context was presented. He gave an example of ExternE endpoint modeling to the Years of Life Lost (YOLL) due to ozone formation per 1000 tons of N O x and pointed out that it is possible to have both negative and positive effects in this example. He discussed uncertainty in many different categories including those of a scientific nature which can be quantified with statistical methods including some data and model uncertainty. He also noted that there were uncertainties related to policy and ethical choices, un- certainty about the future, and idiosyncrasies of the analysis (e.g., interpretation of ambiguous information). For impacts that currently cannot be quantified on the endpoint level (e.g. global warming, impacts on biodiversity), Krewitt sug- gested to use the costs for achieving environmental targets ('standard-price approach') as a measure of society's prefer- ences towards the expected, but unknown impacts. He con- cluded his talk by supporting endpoint modeling to enhance weighting and increase the understanding of the environ- mentaK mechanisms.
Jos~ Potting of Institute for Product Development at the Danish Technical University presented 'Acidification and Terrestrial Eutrophication - Comparison of Different Lev- els of Sophistication'. She compared a number of midpoint approaches, all based on spatially resolved modeling with the RAINS model, but defined increasingly closer towards the endpoint. She showed that spatial differentiation into source regions (and subsequent effects) becomes more im- portant as modeling comes closer to the endpoint. In other words, the uncertainties posed by refraining from spatial differentiation increase by orders of magnitude as modeling comes closer to the endpoint. She identified the lack of dif- ferentiation in source regions as a main drawback of the endpoint-approach in Ecoindicator '99 that is based on a model confined to the - relatively small - Dutch territory. Aggregation of acidification and terrestrial eutrophication (already implemented) together with ecosystem effects (not yet fully implemented) was on the other hand appreciated by Potting as one of the strong features of Ecoindicator '99. She therefore suggested a combination of the spatial differ- entiated or site-dependent midpoint modeling with the site- generic endpoint modeling (for instance by extrapolating the midpoint modeling with RAINS to endpoint by calibrating on Ecoindicator '99). Potting stressed that the state-of-the- art modeling is for some regions (like Europe) closer towards endpoint than in other regions (like North America). She therefore recommended, in line with ISO 14042, to limit characterization to modeling at the point for which accu- rate - spatially resolved - modeling is available (often mid- point modeling), and to consider the extrapolation to endpoint as a part of weighting.
Greg Norris of Sylvatica presented 'Midpoint + Endpoint: Changes in Relative Importance of Pollutant, Location, and Source'. He pointed out the rapidly changing nature of modeling in LCIA, noting how quickly we have moved from potentials to models, and he predicted we would soon be using more sophisticated estimates of uncertainty within our models. He stressed the importance and decision support value of calculating and maintaining uncertainty informa- tion at each stage in the impact assessment, and suggested iterative tests for dominance at each impact assessment modeling stage. In the second portion of Norris's talk he stressed that location is important for some impact catego- ries and should be considered during the inventory stage. Using acidification as an example he pointed out analyses in which location was even more important than pollutant. He pointed to source class as a possible indicator of loca- tion and noted that source class correlated with other im- portant factors including exposure efficiency. He suggested that source class related information may be used to fill in some of the existing holes in LCA.
Edgar Hertwich of the Norwegian University of Science and Technology presented 'Judging Environmental Harm: What Evidence should be Included?'. Hertwich began his presenta- tion by stating that all 'Environmental concerns are public'. And 'There is no satisfactory way to determine social prefer- ences from individual preferences'. He also stated that he thought some expression of uncertainty was imperative, per- haps including uncertainties about mechanisms, magnitudes, and relevance. He stated that within midpoints analysis we know things with more certainty, but within endpoints analy- sis we know things with more relevance. Hertwich warned against compounding uncertainty, i.e., introducing the same uncertainty in additional steps of impact assessment that change a clear preference order of a comparative LCA to overlapping indicator results. Instead he recommended that to maximize the differentiability, one should operate with differences at the inventory level, and again operate with differences at the mid- point level. He recommended keeping both midpoint and endpoint analysis for a number of reasons. He noted that endpoint modeling allows for an easier evaluation of the mag- nitude of effects, while midpoint modeling allows for higher confidence and lower uncertainty.
2 Group Discussions
A summary of the issues discussed within the small break- out groups and then during a moderated discussion session is presented below.
2.1 Definition of the terms midpoint and endpoint
A midpoint indicator can be defined as a parameter in a cause-effect chain or network (environmental mechanism) for a particular impact category that is between the inven- tory data and the category endpoints. Although in general this definition will hold true, such as in categories like cli- mate change and acidification, it may not be fully adequate in others. In particular, this definition was questioned in re- lation to many impact categories (e.g., human health and some ecosystem effects) that were considered to have no
common midpoint in the cause-effect chain at which char- acterization factors could be adequately defined. The paral- lel role of midpoint measures, such as the overall persist- ence of a chemical, as a check of endpoint characterization factors was however stated.
Endpoint characterization factors (or indicators) are calcu- lated to reflect differences between stressors at an endpoint in a cause-effect chain and may be of direct relevance to society's understanding of the final effect, such as measures of biodiversity change. In some impact categories, more than one endpoint measure exists. For example, in the context of ecosystem effects, measures include the Potentially Affected Fraction (PAF) of species and the Potentially Disappeared Fraction (PDF) of species.
2,2 Uncertainty, comprehensiveness and environmental relevance
Uncertainties in LCIA remain high. There was a recognition that at least two types of uncertainty exist: model uncertainty and parameter uncertainty. Model uncertainty reflects the ac- curacy of the model, as determined through evaluation stud- ies. Parameter uncertainty is the uncertainty associated with the input data, as commonly determined using tools like Monte- Carlo analysis. Many participants expressed concern that model uncertainties are often ignored in LCA, and that most efforts to date have focused on parameter uncertainty. There was a recognition that there is also uncertainty re- garding the relevance of the results. This is referred to as scenario or decision rule uncertainty by some researchers (This was also 13resented as 'What we know' vs. 'What we want'). There was an overall belief that endpoint models may be more relevant, but less certain (i.e., higher model and parameter uncertainty). Midpoint modeling may be more certain {i.e., lower model and parameter uncertainty), but less relevant to what the decision makers really want to know.
In the context of relevance, Udo de Haes suggested, 'Life Support Systems' may be seen as having intrinsic value in their own right. For example, GWPs are a midpoint meas- ure in the context of impacts to humans and ecosystems in the event of global warming. The GWPs also relate to the integrity of the global climate as a LSS - an area of protec- tion in its own right, being supportive to life on earth in a broad sense; hence, the GWPs in this context may still be regarded as midpoint indicators, but now with a high envi- ronmental relevance.
One group stated that the inventory table was truly the 'start- ing point' in the model and that one could make some deci- sions at this level, but the hidden uncertainty would be very high, in fact maximal, In some cases it makes sense to stop at the midpoint level from an uncertainty standpoint (no additional differentiation is added by modeling further along the cause-effect chain and, in general, the uncertainty will be increased). A dissenting opinion stressed that some endpoint models may include additional information, which is generally left out of consideration at the midpoint (e.g.,
endpoint models may more easily include the precise time pattern of the emission of ozone depleting gases).
The relative comprehensiveness of the midpoint and endpoint indicators was discussed. In general, midpoint indicators will be more comprehensive because they will be relevant for a wider variety of impacts at endpoint level, although these impacts are not modeled and may not be specified or known. Generally, endpoint models will focus on a smaller number of pathways because of the requirement to model them quan- titatively. Although some 'gaps' are qualitatively 'known', the experts in the associated domains may not be confident about assessment beyond well-characterized midpoints up to endpoint effects. Pathways that carry significant knowl- edge gaps prohibiting quantification can be considered within endpoint modeling by making assumptions within the cause- effect chain modeling itself, by leaving pathways out of con- sideration, or by using parallel precautionary indices. In contrast, midpoint approaches do not address these knowl- edge gaps, but allow their consideration within the weight- ing and decision making phases. It was also noted that for both midpoint and endpoint approaches, participants in a weighting process may not even be qualitatively aware of all of the primary or secondary effects associated with each impact category.
Faced with the benefits and limitations of midpoint and endpoint approaches, it was suggested that both sets of results should be presented, either in parallel or in a tiered approach, within one consistent framework. The user could then see the comparative results at the midpoint level, as well as at the endpoint level. It was noted that this is analogous to the use of endpoint methodologies to provide a default basis for cross- comparison amongst midpoint category indicators.
2.3 Transparency
The more complex the model, the harder it is to maintain transparency and the greater the level of required documen- tation. For example, it is not always obvious which toxico- logical effects are taken into consideration in some endpoint methodologies or which assumptions and value-choices are made in the associated chemical fate and exposure models. It may be clarifying to learn that human health effects on endpoint level due to climate change are considered to be mainly due to the expected increase of malaria, but the value choices encoded into the methodology may not reflect those of the decision-maker. Similar arguments may exist in the context of midpoint indicators, including ozone depletion potentials and global warming potentials, but are probably less abundant. It was suggested that methodologies should be as transparent as possible whilst still providing the de- sired level of accuracy. In the case of complex models, there has to be sufficient consensus within the scientific commu- nity that the approaches are acceptable and that detailed documentation is not required by the general user. De Leeuw stated "It is not necessary to know how the engine works to drive a car".
Based on the level of modeling alone, the level of transpar- ency associated with midpoint indicators can be considered
higher than in endpoint approaches. However, when weight- ing is required to compare and aggregate across impact cat- egories, the implicit links between the midpoint indicators and the endpoint effects may not always be expressed clearly or represented in a structured fashion. This may impact the robustness of the weighting exercise and the final result. This is another reason to support the use of midpoint and endpoint indicators in one consistent framework, where the endpoint indicators provide structured insights to be used at the mid- point level.
2.4 Relationship with decision support
Many of the issues addressed in the Brighton workshop were related to the decision support process.
Communication of the results was recognized as an impor- tant factor. For example, indicators at a midpoint level may be preferred for specific communication purposes (e.g. it may be politically preferable to speak in terms of global warm- ing potentials rather than in terms of DALYs). In general, indicators at endpoint level are sometimes considered to lead to more understandable results; in fact this is connected with the environmental relevance of the indicators, already dis- cussed above. However, indicators at a midpoint level may be more readily communicated in the sense that they will less readily lead to unwarranted conclusions (For instance, global warming potentials will not lead to an unproven sug- gestion that malaria indeed will increase in certain regions, in contrast to results in DALYs which indeed give such a suggestion). In contrast, other practitioners liked the idea of increased specificity of the modeling of associated effects, stating that it may result in increased awareness of the im- plications of consumption.
As endpoint approaches were seen to be most valuable in those cases where aggregation was desired, there was a con- siderable discussion about the value of aggregating results. Some participants pointed out that the degree of aggrega- tion across categories may be dependent upon the point at which one alternative can be demonstrated to be an improve- ment over the other. Other participants suggested that it can be desirable to determine the relative importance of an indi- cator in one impact category compared to another (e.g., glo- bal warming compared to ozone depletion), or even to fully aggregate all impact categories into a single number. Still other participants questioned whether it was necessary to strive for a single number; they argued that it would be suf- ficient to compare options within categories like human health, ecosystem health, and resources, without aggregat- ing these disparate measures. Related to the 'single number approach' some participants cautioned others to spend sig- nificant time analyzing the value of the LCIA within the decision making process. They pointed out that these deci- sions are often not independent of other information, but are simply informative within a larger picture. Similar to the ISO 14042 admonition not to use LCIA as the sole basis for comparative assertions, these participants warned against isolating the results of the LCIA in the single number ap- proach and advocated using specific environmental impact
categories as independent indicators along with other types of information, such aseconomic and social considerations. When aggregation was considered desirable, there was a rec- ognition that conducting comparisons across categories is dif- ficult. Three examples of weighting strategies were discussed: 1) using normalized midpoint indicators
2) the same, but in addition using endpoint measures to provide default insights into the relative importance of certain midpoint categories, or
3) using endpoint indicators.
Many supported the use of both midpoint and endpoint approaches when conducting a weighting exercise. Hofstetter in his presentation, summarized earlier, pointed to the complications associated with panel methods and the severe limitations in current LCA practices related to their use with both midpoint and endpoint factors. Consequently, during the larger group discussions, the present quality of default weighting factors between impact categories was questioned. Participants were challenged to come up with a single example of well conducted, well documented, and bias- free panel results available within the literature. The theory that midpoint results can only be weighted by experts, whereas endpoint results can also be evaluated (or weighted) by non-expert stakeholders, was further questioned by a number of experts. Hofstetter stated that more important than the modeling level is the way environmental issues are cov- ered in mass media because mass media information will in- fluence at which levels individuals develop preferences. In that respect both present midpoint and endpoint approaches may need to be adjusted to the level of actual perception by the public. If non-perceivable indicators are offered in a weight- ing exercise it is likely that preferences do not exist and an- swers will be biased by the provided information and the ques- tion format. Therefore, both midpoint and endpoint results can in principle be useful by non-experts, depending on atten- tion they obtain in the mass media.
A far reaching remark by Hofstetter was that in the weighting stage quantitative and readily available information will have much more influence than qualitative or not presented infor- mation. This would affect both midpoint and endpoint modeling in the moment that they provide qualitative infor- mation on environmental relevance (with the midpoint mod- els) or on the gaps (in the endpoint models). Norris went even one step further, arguing that non-quantified information can- not and should not be included in a weighting process because it will influence the decision in an uncontrollable way. In or- der to get clarity on this important issue there is a high need to learn more from experiences in related science fields.
2.5 Using both midpoint and endpoint indicators
Theoretically, providing they are developed using a consist- ent framework, midpoint and endpoint characterization fac- tors within some impact categories may display linear pro- portionality (e.g., the midpoint measure 'ozone depletion potentials' and the endpoint measure of 'DALYs' related to ozone depletion may be linearly proportional). In cases in
which there is essentially just a multiplication factor between the midpoint and endpoint measures there is still value in communicating, and perhaps utilizing both approaches be- cause different endpoint impacts will use different factors because different endpoint impacts will use different factors and provide different information as needed for Life Sup- port Systems and the various types of communication. This remained a presupposition, however, since there are currently no examples of models which allow consistent analyses to occur at both levels.
To use current midpoint and endpoint approaches together would require the use of models that have incompatible data sets, impact assessment methodologies, and modeling as- sumptions. Analogous to the idea of using midpoint and endpoint approaches in parallel, some practitioners suggested conducting studies using available, multiple methodologies (and even inventory databases) to determine whether this affected the results. Others voiced frustration with available software and warned that decision makers will not accept conflicting models next to each other. Further investigation would then be required to resolve contradictory results. In order to overcome the above stated problems, the aim may well be to develop one framework which includes both mid- point and endpoint approaches in a consistent way. Then for a particular study a choice can be made which level or levels to use for the modeling, depending on the requirements set by the given application. Such a perspective could be considered within the presently envisaged SETACRJNEP program, aim- ing at the identification of best available practice.
3 Conclusions
h consensus was reached by the LCIA experts at the Brighton workshop that both midpoint and endpoint level indicators have complimentary merits and limitations. Decisions can be made using the midpoint indicators, which are more cer- tain but can have a lower relevance for decision support in some cases, or using the endpoint indicators, which were argued to often have a higher relevance but lower certainty. Some practitioners suggested that the midpoint and endpoint indicators should be available in parallel. An interesting per- spective would be to provide both sets of information to deci- sion makers within a consistent framework (midpoint and endpoint indicators provided from a given model of the cause- effect network). In line with this, strong support was expressed for the use of tiered approaches within the LCIA. However, the form of such a tiered approach was not identified. The present workshop has played an important role in clari- fying the difference between the two approaches regarding comprehensiveness and gaps, uncertainty (model and pa- rameter), relevance (or scenario uncertainty), the degree of transparency, value-choices, and an improved understand- ing of the limitations of panel-based weighting methods for comparing across impact categories. This can be seen as a
first step in a longer process, because on all of these issues further research and discussion is needed.
Participants finally expressed a desire to hold future work- shops on these and on related issues in the field of LCIA, such as the treatment of ecosystem effects and environmen- tal quality as it relates to land use issues, the different forms of uncertainty, issues in weighting, and the interaction be- tween risk assessment and LCIA.
Acknowledgments. We would like to express thanks to all who contributed to this workshop including the speakers, small group chairs, participants, and note takers. Participants from many coun- tries around the world were available and provided valuable con- tributions.
David Pennington and Patrick Hofstetter were supported, in part, by an appointment to the Postdoctoral Research Program at the National Risk Management Research Laboratory administered by the Oak Ridge Institute for Science and Education (ORISE) through an interagency agreement between the U.S. Department of En- ergy and the U.S. Environmental Protection Agency.
References
Bare JC, Pennington DW, Udo de Haes HA (1999): Life Cycle Impact Assessment Sophistication, International Workshop, Int. J. LCA 4 (5) 299-306
Empire State Electric Energy Research Corporation (ESEERCO) (1995): New York State Environmental Externalities Cost Study, Volume 1: Introduction and Methods. Oceana Publications Inc., New York
ExternE (1995): Externalities of Energy, European Commission EUR 16520 EN, Volume 1-6 (htrp://www.ExrernE.irc.es)
Goedkoop M ( 1995): Eco-Indicator 95. Final Report, Pre Consult- ants, Amersfoort
Goedkoop M, Spriensma R (1999): The Eco-Indicator'99, A dam- age-oriented method for Life Cycle Impact Assessment. VROM, Zoetermeer (www.pre.nl)
Heijungs R, Guin& JB, Huppes G, Lankreijer RM, Udo de Haes HA, Wegener Sleeswijk A, Ansems AMM, Eggels PG, van Diun R, de Goede HP (1992): Environmental Life Cycle Assessment of products. Backgrounds & Guide, Leiden
Hofstetter P, Braunschweig A, Mettier Th, Mueller-Wenk R, Tietje O (2000): The Mixing triangle: Correlation and Graphical De- cision Support for LCA-based Comparisons. Journal of Indus- trial Ecology 3 (4) 97-115
Steen B, Ryding SO: (1992): Swedish Environmental Research In- stitute, Federation of Swedish Industries, The EPS enviro-ac- counting method, G6teborg
Udo de Haes HA, Jolliet O, Finnveden G, Hauschild M, Krewitt W, Mueller-Wenk R (1999): Best Available Practice Regarding Impact Categories and Category Indicators in Life Cycle As- sessment. Int. J. LCA 4 (2) and (3)
UNEP Industry and Environment (1999): Towards the Global Use of Life Cycle Assessment. United Nations Publication Sales no. 92-807-1740-5, Paris, France