HAL Id: hal-00243034
https://hal.archives-ouvertes.fr/hal-00243034
Preprint submitted on 6 Feb 2008
HAL is a multi-disciplinary open access
archive for the deposit and dissemination of sci-entific research documents, whether they are pub-lished or not. The documents may come from teaching and research institutions in France or abroad, or from public or private research centers.
L’archive ouverte pluridisciplinaire HAL, est destinée au dépôt et à la diffusion de documents scientifiques de niveau recherche, publiés ou non, émanant des établissements d’enseignement et de recherche français ou étrangers, des laboratoires publics ou privés.
Food Safety, Liability and Collective Norms
Eric Giraud-Héraud, Hakim Hammoudi, Louis-Georges Soler
To cite this version:
Eric Giraud-Héraud, Hakim Hammoudi, Louis-Georges Soler. Food Safety, Liability and Collective Norms. 2006. �hal-00243034�
Food Safety, Liability and Collective Norms
Eric Giraud-Héraud
Hakim Hammoudi
Louis-Georges Soler
Juin 2006 Cahier n° 2006-06ECOLE POLYTECHNIQUE
CENTRE NATIONAL DE LA RECHERCHE SCIENTIFIQUE
LABORATOIRE D'ECONOMETRIE
1rue Descartes F-75005 Paris (33) 1 55558215 http://ceco.polytechnique.fr/ mailto:[email protected]
Food Safety, Liability and Collective Norms* Eric Giraud-Héraud1 Hakim Hammoudi2 Louis-Georges Soler3 Juin 2006 Cahier n° 2006-06
Résumé: Afin de renforcer la sécurité sanitaire des produits alimentaires, la grande distribution met en place un certain nombre de normes restrictives sur le référencement des producteurs. Cet article étudie le fonctionnement économique de ces normes, dans le cadre d'une formalisation des relations verticales producteurs-distributeurs. Le modèle d'analyse intègre à la fois un risque endogène de marché (lié à l'adoption ou non des normes sécurisées par les agriculteurs) ainsi qu'un risque de pénalité pour les distributeurs défectueux (en cas de crise sanitaire). Nous montrons comment ce dernier principe de politique publique, dit de "responsabilité", explique en partie l'action coordonnée des distributeurs et peut de fait influencer le risque sanitaire.
Abstract: Over the last few years, retailers have implemented new collective private norms in order to improve food safety and reduce the risks related to microbial contamination and pesticide residues. In this paper, we propose a model of vertical relationships in which a group of retailers imposes more stringent specifications to upstream producers. We consider that the contamination risk is endogenously determined by the efforts made by the producers in order to improve food safety. We also consider that the penalty costs - related to the liability rule in the event of a crisis - decrease accordingly as the requirement level of the collective norm rises. We show how the liability rule influences the level of the collective norm and the contamination risk
Mots clés : Distribution alimentaire, Sécurité sanitaire, Standard privé, Responsabilité. Key Words : Food Retailing, Food Safety, Private Standards, Liability.
Classification JEL: L100, L230, L810, Q130
*
This research currently benefits from the financial support of the French Ministry of Research through the Concerted Action (ACI) grant ''Economic Modeling of Sustainable Development".
1
INRA and Ecole Polytechnique, Laboratoire d’Econométrie, Paris, France ([email protected]).
2
University of Paris 2 and INRA, Paris, France ([email protected]).
3
Introduction
The food safety crises in the 1990s prompted the public authorities to adapt domestic and international regulations related to food safety and protection of consumer health. In order to lower the risk level related to microbial pathogens, pesticide product residues and input into agricultural production, two main types of tools were implemented. The first one was based on the direct regulation of processes or product quality: the tightening of Minimum Quality Standards (MQS). For instance, this has been applied through imposed maximum values of residues, and has been an important tool for public regulation in many countries. The second one was the imposition of liability for damages such the “due diligence” principle defined under the Food Safety Act in Great Britain and later by EU regulations. Adopting a defense argument of “due diligence” allows a firm facing legal action to defend itself by showing that it has taken all reasonable precautions and has exercised due diligence.
In the event a safety crisis occurs, the individual penalty is lower if the firm can prove that it had imposed demanding requirements both inside the firm and on its suppliers.
For their own part, private stakeholders in the food chains, especially the retailers, implemented voluntary actions in order to meet customer expectations in terms of food safety. This was done by creating private standards aimed at achieving improved product safety and quality characteristics. At this point, two main strategies should be distinguished (Codron et al., 2005b).
The first strategy is based on the implementation of private standards defined and owned by individual retailers. These private standards prompted the retailers to establish relatively formalized contractual relationships with producer organizations, and to decrease the utilization of spot markets. As a result, the creation of vertical alliances between producers, manufacturers and retailers has proven to be an important mechanism in the regulation of agricultural product food chains. Several examples may be put forward to illustrate these changes. In Great Britain, Marks and Spencer (M&S) created its own supply chains by directly concluding agreements with producer groups. Carrefour has adopted a similar approach through the creation of its private labels which are now commercialized in the majority of the countries in which this firm is present (e.g. France, Italy, and Portugal). This action is intended to structure the supply chain by obliging suppliers to meet production requirements related to safety, quality and environmental levels, which are more demanding than public regulations. These approaches have been studied by Codron et al. (2005a), Bazoche et al. (2005) and Giraud-Héraud et al. (2006).
Over the last few years a second strategy has appeared, based on the creation and implementation of collective private norms common to groups of retailers. Examples of such groups of retailers dealing with collective food safety norms are given by Fulponi (2006). For instance, the Global Food Safety Initiative (GFSI) represents a grass-roots industry harmonization effort aimed at setting norms for food at a global level. Another example is provided by the EUREPGAP (European Retailers for Good Agricultural Practices) norm, initially created for the fruit and vegetables sectors by a group of retailers including Tesco, Sainsbury and Ahold. This standard functions as a norm for the certification and selection of
suppliers, and imposes requirements mainly related to safety risks and environmental issues (pesticides, contamination, etc.). In order to qualify as a supplier for these retailers, farms must undertake to comply with HACCP principles (Hazard Analysis Critical Control Points) and to fulfill commitments in order to reduce safety and environmental risks. Some of the major concerns of the EUREPGAP norm are focused on product traceability, reduction of chemical residue and physical and microbial contamination in order to guarantee product safety, protection of natural resources and workers’ health. The application of the EUREPGAP norm generally requires an upgrading of the farm operation and therefore financial investment, as well as more stringent production practices, all of which may result in additional costs. This norm, which is applied solely to the B2B part of the activity, remains invisible to the consumers, is not publicized in any manner, and is not used for price differentiation on the final market.
As these collective norms aim to impose more stringent requirements on producers than those defined by existing public regulations, it is possible to consider GFSI or EUREPGAP norms as collective and private norms set up by groups of retailers in order to create new intermediary markets which are (i) safer than the generic spot markets and (ii) which limit the need for supply contracts without necessarily lessening the food quality and safety levels the retailers intend to offer to their customers.
Taken as such, these collective norms raise several issues. How would it be possible for a safer spot market to emerge - one in which retailers would be able to obtain products of a sufficiently high safety level without being obliged to enter into contractual relationships with their suppliers? Could it co-exist with a generic spot market? What could be the impact of the creation of this safer spot market on the various stakeholders of the food chains? From a public point of view, what could be the impact on food safety risks and how could it be influenced by public decisions (if it were not socially efficient)?
Several points related to the economics of food safety have been already studied in the literature. For instance, some papers deal with consumer perceptions regarding food safety (Loureiro et al., 2001), and the impacts of food safety crises on the markets (Salin and Hooker, 2001; Thomsen and McKenzie, 2001; Lloyd et al., 2001). Other papers deal with private firms’ strategies and food safety regulation (Antle, 1995; Elbasha and Riggs, 2003; Hennessy et al., 2001; Henson and Holt, 2000; Crespi and Marette, 2001; Fox and Hennessy, 1999; Starbird, 1997). Regarding regulation issues, interesting approaches have been also put forward by authors working in the field of environmental regulation. For instance, some papers deal with the threat of mandatory controls if no action is voluntarily undertaken by the firms (Segerson, 1997; Lyon and Maxwell, 2003; Lichtenberg and Penn, 2003; Segerson and Miceli, 1998; Barett and Segerson, 1997).
However, to our knowledge and to date, no formal analysis has been conducted on collective norms implemented by firms in order to impose more stringent specifications on upstream producers. As this issue seems to be more and more important in the food sector, it is necessary to assess its impact on food safety risks and chain organization. In the second section of the paper we propose a model of a vertical relationship between producers and retailers in which two intermediary spot markets can be used: a generic spot market and a safer spot market in which a group of retailers imposes more stringent specifications. In order to sell their product in this spot market, the producers must reach a certain level of equipment
and invest if they do not already have the required level of equipment. Compared to the literature, the originality of this model is twofold:
- We consider that the contamination risk is endogenously determined by the efforts imposed on the producers by the retailers in terms of required equipment. We also consider that the risk of contamination determines the size of the total demand. Indeed, as shown by the survey of European retailers conducted by Fulponi (2006), many of them recognize that food safety failures by one firm may have an impact on other firms as consumer trust in retailers and government capacity to ensure safe food decreases in such situations. As a result, the optimal level of the collective standard for the retailers depends on the following trade-off: on the one hand, a high requirement level results in a lower contamination risk, and therefore higher final demand, whereas, on the other hand, a higher requirement level obliges producers to increase investment (without sub-contracting).
- We also consider that the penalty costs related to the liability rule decrease as the requirement level of the collective standard rises. In the event of a crisis, retailers can therefore hope to reduce this penalty if they have adopted and imposed more stringent specifications on the suppliers.
In the third section, we determine the conditions for the co-existence of the generic and the safer spot markets. We show that four equilibriums may arise according to the requirement level of the collective standard. We identify the consequences in terms of contamination risks and we show that, in some cases, the group of retailers may decide to set up a collective standard which does not reduce these risks.
In the fourth section, we assess the effect of the liability principle on the co-existence of both spot markets and on the food safety level. We show that when the retailers have no penalty cost to pay if a crisis occurs, and regardless of the drop in final demand during a time of crisis, profit decreases in relation to the requirement level of the collective standard. For this reason, the retailers adopt a low standard level, and only those producers which are already equipped enter the safer spot market. As the distribution of the producers’ equipment does not change, the overall food safety risk remains the same. Moreover, a free-riding phenomenon may occur in which retailers who do not adopt the collective standard obtain a higher profit than those retailers who do adopt the standard. However, if the penalty costs sufficiently high, the profit of the retailers who adopt the collective standard is higher than that of the others and there is no longer any free-riding phenomenon. Individual retailer profits are maximized, thereby resulting in a higher value of the collective standard, and total contamination risk decreases. We show also that the liability rule influences not only the level of the collective standard, but also the value sharing between producers and retailers. Finally, we identify a contradictory interest between the retailers and the public authorities (or the consumers) about the choice of the coalition size and the level of the collective norm.
In the last section, we summarize the main results and discuss the limits of the paper. Possible further avenues of research are explored.
We consider a vertical relationship between J upstream producers, indiced by j, and R downstream retailers, indiced by r (see figure 1). There is a unique end market, and producers and retailers can use two intermediary markets:
- A “Generic market”, supplying some of the R retailers at the intermediary price
0
ω . This market is supposed to be in conformity with the public food safety regulation. - A “Safe market”, on which the exchanged products are supposed to comply with a private collective norm imposed by the other retailers. This norm leads to more stringent requirements. This spot market supplies these retailers at price ω1.
We denote by (i) G and n respectively, the number of producers and the number of retailers involved in the generic market (we call them “generic producers” and “generic retailers”), and (ii) S and m respectively, the number of producers and retailers involved in the safe market (the “safe producers” and the “safe retailers”). We have G+ =S J and n+ =m R. Without loss of generality, we suppose that the generic market concerns the first G producers (j=1,…,G ) and the first n retailers (r=1,…,n). The safe market concerns the producers from
G+1 to J and the retailers from n+1 to R. Each producer and each retailer is a price taker on
the intermediary markets.1
Figure 1 – The Vertical Structure
1
This assumption can be justified by the internalization of the fruit and vegetable intermediary markets. Indeed, the intermediary spot prices depend on the balance between a large number of suppliers and retailers at the global level. But, on each final national market, the retail sector is often highly concentrated. For this reason, it is more relevant to consider an imperfect competition on the final market.
R Downstream Retailers J Upstream Producers (J=G+S)
[………]
S producers with safer productGeneric Market
price
ω
0 1 2with generic productG producers
n+ x 1 x 2 x xn n n+ Safe Market 1
……….
R End Market q q q q q xprice
ω
The upstream producers are differentiated according to their equipment levels, which is represented by a one-dimensional parametere∈[ , ]e e . Since J is very large, we assume that
e is uniformly distributed within the interval [ , ]e e , according to the density
function f e( ) 1
e e
=
− . Without loss of generality, we suppose that e = and 0 e =1.
The contamination risk linked to each individual producer, whose equipment level is e, is given by ( )σ e where ( )σ e is a decreasing function of e. For the sake of simplicity, we consider that ( )σ e = − and then we have 1 e σ( )e =1 and ( )σ e = . As we consider that each 0 producer always markets the same quantity q (non-elastic supply), the total contamination risk is given by:
1 ( ) ( ) 1 2 2 e e e e e f e de σ =
∫
σ = − + = (1)We consider that σ defines the probability of crisis in the end market. This initial probability can be modified if one or more of the producers changes its equipment over the course of time. Then the density f(e) will shift to a density f’(e) and change the level of σ given by (1). We will refer to σ as the “contamination risk” in the rest of this paper.
In order to enter into one of the two intermediary markets, an upstream producer must reach a certain level of equipmente , which is the “standard” of the selected market. We take s
s
e = for the generic market and 0
s 1
e =e > for the safe market. 0
1
e is called the “safe
standard” and we will later see (in Section 4) how its level can modify the contamination risk. We assume that the fixed cost for each producer of type e, who wants to participate in
the intermediary market of standarde , takes a linear form s Max{ 0 ,es −e }. Therefore, no fixed cost is required for any producer to enter the generic market, and the fixed cost to enter the safe market decreases according to the initial level of equipment.
At the retailer level, a food safety crisis results in penalty costs in application of the due diligence principle. We assume that if a retailer chooses a standard e (s es = or0 es = ), it e1
pays a penalty
s
( e )
Γ if a crisis occurs. Of course
s
( e )
Γ is a decreasing function in
s
e ,
since a high level of e means a high level of precaution taken by the retailer. Therefore, if a s
retailer is not involved in the safe market, it pays the maximum penalty Γ( 0 ) if a crisis occurs.
The final product is considered as a homogeneous product by the consumers who have the same willingness-to-pay, whether the product comes from the generic or the safe market2. In the end market, we consider the linear demand function such D( p )= −c dp (c > 0, d >0).
However, in the event of a crisis, demand is assumed to be null. Thus, if this crisis occurs with a probability σ (0≤ ≤σ 1), expected demand in the end market is
D ( p )σ =( 1−σ )( c dp )− .
2
It means that there is no price differentiation of the final market on the basis of food safety characteristics. Indeed, in many countries, it is forbidden to use these characteristics for product differentiation.
We will consider below a quantity setting game and we denote by
r
x the supply of each
retailer r in the end market (r =1,…,R ). The inverse demand function is then the following:
R r r 1 1 p a x d ( 1 σ ) = = − −
∑
(2) The parameter a c d= is assumed to be sufficiently high in order to obtain high enough prices on the intermediary markets. This means that an upstream producer can always cover the fixed cost to enter the intermediary market he has chosen. All the J producers choose one of
the two intermediary markets, and the total supply is always equal to Jq.
The question is now to assess the evolution of the contamination risk, initially given by (1). In order to answer this question, it is necessary to assess the number S of upstream producers who choose the safe market. In order to address this issue, we study the following two-stage game:
Stage 1: the upstream producers simultaneously decide whether or not to enter the safe market (adopting the standard
s 1 e = or e s e = and paying 0 s Max{ 0 ,e −e }).
Stage 2: the upstream producers simultaneously offer the quantity q on the market they have chosen and the retailers simultaneously decide to supply the end market with a quantity
r
x (r =1,…,R).
The above two-stage game is based on the game developed by D’Aspremont, Gabszewicz & Weymark [1983] in the theory of Industrial Organization. These authors show how this
simple non-cooperative game, in which the producers must simultaneously decide to join the cartel, by anticipating the profits of the competition in the industry, leads to stability properties of the cartel.
At stage 1 of the game, the producers decide to adapt or not their equipment e. This decision determines the contamination risk σ , the expected demand according to (2), and the expected penalty
s
( e )
σΓ . At stage 2, given the value σ , the economic equilibrium is calculated (quantity x , r=1,…,R, and prices r ω and p) considering the price-taker hypothesis
for the producers and retailers on the intermediary market.3
Formally, consider a retailer r (r=1,…,R) that has entered an intermediary market of standard
s
e (es = or 0 es = ). Given the quantities q and e1 x (r=1,..,R) supplied on the intermediary r
and end markets, and given the prices ω (ω ω= 0 or
1
ω ω= ) and p, the profit
j
B of producer j (j=1,…,J) and the profit πr of retailer r (r=1,…,R) are given by :
3
It would be possible to define a Stage 0, in which the level of the collective norm (e1) and the number (m) of
retailers involved in the collective norm implementation would be determined. As this issue raises several questions, we consider, for the moment, both e1 and m as given. We discuss this point in the last part of the
j s r r s B q Max{ 0 ,e e } j 1,..., J ( p ) x ( e ) r 1,...,R ω π ω σΓ = − − = = − − = & (3)
3. Is food safety improved at equilibrium?
As mentioned before, the producers have to decide whether or not to enter the safe market, and to upgrade their initial equipment, according to the expected prices in the generic and the safe markets. Of course, a producer may enter one of the intermediary markets (the generic or the safe market) if there is at least one retailer in this market at the first stage of the game. Consequently, we can identify two first equilibriums:
- E1 equilibrium (Benchmark): there is no retailer in the safe market (m=0),
- E2 equilibrium: there is no retailer in the generic market (m=R).
If 0< <m R, we can compute the subgame equilibriums which give the intermediary and final prices and the stakeholders’ profits, according to the level e of the collective norm. In 1
the appendix it is demonstrated that in stage 1 of the game, two subgame equilibriums may arise:
- E3 equilibrium: the two markets co-exist without modification of the contamination risk,
- E4 equilibrium: the two markets co-exist and the contamination risk is decreased.
The stakeholders’ profits, the conditions of the 4 equilibriums and the final contamination risk are provided in the following subsections (3.1 to 3.4).
3.1. E1 equilibrium (benchmark: m=0)
In this situation, only one intermediary market exists and the contamination risk obviously remains equal to ½. By calculating the Cournot-Nash equilibrium between the retailers, it is easy to determine the supply in the end market, based on the spot market price paid to the upstream producers. As all the upstream producers sell the same quantity q in the generic market, we obtain the equilibrium intermediary price by equalizing supply and demand. Therefore, the intermediary price and the retail price are simply given by:
0 2 Jq( R 1 ) a dR 2 Jq p a d ω = − + = − (4)
The retail price p is not dependent on the number R of retailers since the total quantity
supplied in the market is constant and equal to Jq. However, the level of R influences the
bargaining power between producers and retailers, and then
0
ω increases in R.
Each retailer markets the same quantity xr Jq R
≡ . The profit of each upstream producer and each retailer is given by the following equations:
1 j 1 2 r 2 Jq( R 1 ) B q [ a ] j 1,..., J dR Jq 2 1 ( ) ( 0 ) r 1,...,R d R 2 π Γ + = − = = − = (5)
Due to the level of intermediary price ω0, the profit B increases in R while the retailer’s j
profit 1 r
π decreases in R. If we denote by B the total profit of the upstream producers in the 1
E1 equilibrium, we have B1 =JB . 1j
3.2. E2 equilibrium (m=R)
If m = R, all the upstream producers have to choose between participating to the safe market
and selling nothing (in this case, they get a null profit). We show in the appendix that if this equilibrium arises (and if the parameter a is large enough), all the producers want to enter the
safe market. Consequently, in equilibrium, if e1>0, the contamination risk is decreased4.
Indeed, if m = R, all the producers between 0 and
1
e pay the fixed cost (
1
e − ) to enter the e
safe market. Thus, the producers are now distributed on [0,1], with the following new density:
1 1 1 1 0 if 0 e e f ''( e ) e if e e 1 if e e 1 ⎧ ≤ ≤ ⎪ ⎪ =⎨ = ⎪ ⎪ < ≤ ⎩ (6)
The contamination risk is now:
1 2 1 0 1 ( ) ''( ) 2 e e f e de σ =
∫
σ = − (7) 4Each retailer offers the quantity
r
Jq x
R
= (r=1,...,R). The prices on the intermediary market and on the end market are:
2 1 1 2 1 2 Jq( R 1 ) a dR( 1 e ) 2 Jq p a d ( 1 e ) ω = − + + = − + (8)
The profits of each retailer and each producer are:
2 2 2 2 r 1 1 1 Jq 2 1 ( ) ( 1 e ) ( e ) r 1,...,R R 2 d ( 1 e ) π = − − Γ = + (9) 3.3. E3 equilibrium (0<m<R)
First of all, note that if the two intermediary markets co-exist, the S producers who have entered the safe market are those who have the best initial equipment.5 This means that S is constituted of producers whose equipment level is initially between a value eˆ (0≤ ≤eˆ 1) and
e =1. Therefore S=J (1-eˆ).
E3 equilibrium is obtained for a value of ê such that ê > e1. In this context, there is no
upstream producer who improves his equipment. Indeed all the equipment between ê and e1
is sufficiently high to satisfy the collective norm. As a result, no producer pays a fixed cost to enter the safe market.
At stage 1 of the game, a producer decides to enter the safe market if his expected profit in this market is greater than the benchmark profit. Since there is no additional cost to pay, a producer enters the safe market if and only if the intermediary price of the safe market ω1 is just greater than the intermediary price
0
ω of the generic market. Consequently, in equilibrium, ω1 =ω0 and the producers are indifferent between the two intermediary markets.
On the other hand, the retailers have to choose the quantities to buy in order to supply the end market. Given (
0 , 1
ω ω ), we obtain a Cournot-Nash equilibrium in the end-market between the R retailers. The intermediary prices in the generic and in the safe markets are then determined. The calculation of this equilibrium is provided in the appendix. We show that the number of safe producers is obtained by S=J(1-eˆ) with ˆe n
R
= . Consequently, the
5
This result is shown easily. Indeed, if an upstream producer with equipment e belongs to the safe market, then each producer with equipment e’ > e, wants to enter the safe market (since the fixed costs are smaller for him). Consequently, it cannot exist an equilibrium with a non convex set of producers’ equipments.
intermediary prices are the same as described in (4) for E1 equilibrium. Considering that
ê>e1, we obtain the validity of the E3 equilibrium:
Proposition 1. If 0 e1 1 m R
< ≤ − , there exists an E3 equilibrium in which there is no modification of the contamination risk.
Proof: see appendix.
If there is not a high number of retailers in the safe market, the expected price in this market is low. The number of producers who then accept to enter the safe market is limited. Thus the number of safe producers is composed of initially well-equipped producers and there is no modification of the distribution of e on [0,1]. The contamination risk remains equal to½. In this E3 equilibrium, the quantity marketed by each retailer is the same than in the benchmark E1 equilibrium (xr Jq
R
≡ ). The end price p and the spot prices in each intermediary market are equal to
0 1
ω =ω and are given by (4). The profit 3 j
B of each upstream producer j (j=1,...,J) is equal to 3 1
j j
B =B , given by (5). Each retailer who chooses the standard s e ( s 1 e =e or s
e = ) earns the following profit: 0
3 2 r s Jq 2 1 ( ) ( e ) r 1,...,R d R 2 π = − Γ = (10) 3 r π is equal to 1 r
π for the retailers who choose the generic market (when es = ). Otherwise 0
3 r
π is greater than 1 r
π for the others (when es = ), due to lower penalties if a crisis occurs. e1
Moreover, 3 r
π is not dependent on the number m of safe retailers as the contamination risk is not modified and the intermediary prices do not change in comparison to the benchmark E1 equilibrium.
If we denote by B3 the total profit of the upstream producers in E3 equilibrium, we have
1
3 j
B =JB .
3.4. E4 equilibrium (0<m<R)
Assume that, in equilibrium, the equipment ˆe of the producer indifferent between the generic and the safe market, is such that ˆe< . The producers initially located between eˆ and e1 e1
have to invest and upgrade their equipment. This induces a modification of the statistical distribution of the producers’ equipment, initially uniformly distributed on the interval [ , ]0 1 .
The producers are now solely distributed on [ e and 0,ˆ] [ ,1]e1 and we have the following new density: 1 1 1 1 ˆ 1 if 0 e e ˆ 0 if e e e f '( e ) ˆ e -e if e e 1 if e e 1 < ≤ ⎧ ⎪ ⎪ < < ⎪ = ⎨ = ⎪ ⎪ ⎪ < ≤ ⎩ (11)
In this case, the contamination risk becomes:
1 2 1 0 ˆ 1 ( ) ˆ ( ) ( ) '( ) 2 e e e e f e de σ =
∫
σ = − − (12)It is now possible to determine the supply-demand equilibrium in the intermediary markets by taking into account the contamination risk in the calculation of the quantities marketed by the retailers. At equilibrium, the intermediary prices are given by:
0 1 ˆ Jq( n e ) ˆ ( e ) a ˆ dn [ 1 ( e )] ˆ Jq( m 1 e ) ˆ ( e ) a ˆ dm [ 1 ( e )] ω σ ω σ + = − − + − = − − (13)
The value of eˆ is the solution of the following equation: ˆ [ ( )ˆ ( )]ˆ
1 1 0
e = e − ω e −ω e q (14)
In the appendix, we show the existence and unicity of eˆ corresponding to (14). eˆ is a function of the collective norm level e1 and of the number m of safe retailers. Indeed, these
two parameters influence the intermediary prices and the level of the price differentiation between the two intermediary markets (we show that ω1 >ω0 > ). Formally, the solution of 0
(14) is not easy to obtain. However, using Mathematica, an explicit computation of its value is provided in the appendix (formulas (A24) and (A25)). This leads to the following proposition:
Proposition 2. If 1 m e1 1 R
− < < there exists an E4 equilibrium in which the contamination
risk is lower than in the benchmark E1 equilibrium.
Proof: see appendix.
Depending on the value of eˆ , we denote by 4 G r ( e )ˆ
π and 4 S r ( e )ˆ
π , respectively the profit of a generic retailer and of a safe retailer for the E4 equilibrium. We obtain the following expressions:
ˆ ˆ ˆ ( ) ( ( ) ( ) ,..., ˆ ˆ ) ˆ ˆ ( ) ( ( ) ( ) ,..., ˆ 4 G 2 r 4 S 2 r 1 Jqe 1 e ) e 0 r 1 n d [1- (e )] n Jq(1-e 1 e ) e e r n 1 R d [1- (e )] n π σ Γ σ π σ Γ σ = − = = − = + (15)
The total profit of producers breaks up into three parts: i) the producers who enter the generic market; ii) the producers who enter the safe market with no fixed cost; iii) the producers who enter the safe market after upgrading their equipments.If we denote by
4
B the total profit of
the upstream producers in the E4 equilibrium, we have :
ˆ ˆ ( ) ˆ ( ) [ ( )] [ ˆ ( )] 1 e 2 1 4 0 1 1 1 1 0 1 1 e J e e B Jeq J 1 e q J q e e de Jq e 1 e 2 ω ω ω ω ω − = + − +
∫
− − = + − − (16)4. The choice of the collective norm
In the previous section, we have defined all the equilibriums which can emerge at stage 1 of the game. As we have shown, these equilibriums depend on the level of the collective norm
e1 chosen by the retailers which set up the safe spot market and on the number m of retailers
involved in the implementation of this norm. We call “coalition” this group of retailers. In this section, we consider the coalition size m as given and we discuss the choice of the collective norm by the retailers, in relation to the penalty costs linked to the liability rule. Another important issue would be to determine endogenously the size of the coalition. But it would mean to take into account, not only the retailers’ profit maximization, but also the coalition stability conditions. Such an issue is out the scope of this paper but will be discussed in the last part of this section.
In order to discuss the impact of the collective norm, it is necessary to determine the penalty cost the retailers have to pay in case of a crisis. We adopt the following expression:
S S
( e ) ( 1 e ) ( 0 )
Γ =γ − γ ≥ (17)
with eS = for the retailers in the generic market, and 0 eS = for the coalition of e1
retailers in the safe market. The parameter γ can be seen as a tool to increase/decrease the penalties borne by a retailer in the event of crisis. The greater the value of γ , the more severe the consequences of the fault.
In this section, we try to assess the impacts of these penalty costs on the choice of the collective norm by the retailers. As it is not possible to solve totally the model analytically, we propose several results on the basis of numerical simulations. The parameters used for these simulations are given in the appendix.
Retailers’ profit is determined by the evolution of three components: the total demand which depends on the contamination risk, the intermediary prices which depend on the requirement level of the collective norm, and the individual penalty costs in case of a crisis.
If the penalty costs are null (Figure 2), and if 1 1
m e
R
≤ − , only previously equipped producers enter the safe market. No one invests and the spot market prices are equal on both sides. If
1 1
m e
R
> − , new producers invest and enter the safe spot market. The intermediary prices increase in both markets because the total demand increases for all the retailers as the contamination risk decreases. However, the intermediary prices increase more on the safe market than on the generic market, because fewer and fewer producers enter the safe spot market (due to the necessity of making additional investments).
Figure 2 – Spot market prices and contamination risks according to the collective norm (with γ =0)
In the absence of penalty costs, there is no incentive for the retailers to adopt a high collective norm. Indeed, if e1 1 m
R
> − the demand increase is not sufficient to compensate the increase in spot prices. Moreover, a free-riding phenomenon arises because the retailers’ profit outside the coalition is greater than inside the coalition: indeed, they benefit from the efforts produced by the coalition (in terms of demand increase), without having to bear the consequences of so high spot market prices.
As a result, the retailers inside the coalition maximize their individual profits for e1 1 m
R
≤ − and nothing changes for the consumers in terms of contamination risk (E3 equilibrium if
Intermediary prices e1 Safe market Generic market 1-m/R Contamination Risk Spot Prices Risk
m<R and E1 equilibrium if m=R). For this value of the collective norm, individual retailers’ profits, both outside and inside the coalition, are equal.
These results are consistent with a low level of penalty costs. Indeed, we verify the following result:
Result 1. If the penalty costs in the event of a crisis are positive but low (0< < ), retailers γ γ1
are willing to adopt a collective standard such that e1 1 m
R
= − . Only previously equipped
producers enter the safe market and the contamination risk is not modified.
As shown in Figure 3, if 0< < , for the retailers inside the coalition, the individual profit γ γ1 increases in e1 and reaches a maximum for 1 1
m e
R
= − . Indeed, when e1 increases, the penalty
costs in case of a crisis decrease for the retailers inside the coalition. If 1 1
m R
e ≤ − , only
previously equipped producers enter the safe market, the distribution of the equipment at the upstream level is not modified and total demand remains unchanged. When 1 1 m
R
e > − ,
producers not already equipped enter the safe market, the contamination risk decreases and the total demand increases. However, as soon as 1 1 m
R
e > − , the effect of the increase in the
safe spot market price on retailer profit is more significant than the improvement in demand. In this case, the collective norm only acts as legal protection for individual retailers in the event of crisis. The total demand remains unchanged and the producers earn the same profit as in the benchmark equilibrium.
Retailer’s Profit e1 0 γ = 1 0< <γ γ 1 γ γ> * 1( 1) e γ γ< e1*(γ γ> 1) Retailer’s Profit e1 0 γ = 1 0< <γ γ 1 γ γ> * 1( 1) e γ γ< e1*(γ γ> 1)
Figure 3 – Retailer profits inside the coalition according to the collective norm for various penalty costs
If we consider now the case in which penalty costs are greater, we can observe that:
Result 2. If the penalty costs are sufficiently high (γ γ> ), retailers adopt a collective norm 1
* 1 1
m e
R
> − . For this value of the norm, the contamination risk decreases.
As shown in Figures 3, if γ γ> , the retailers’ profit inside the coalition increases up to 1 * 1 1 m e R > − . If * 1 1 1 m e e R
− < < , producers not already equipped enter the safe market and the total contamination risk decreases. The positive effect of the decrease in both the risk level and the penalties borne by retailers in the event of crisis, is greater than the increase in the intermediary price on the safe market. Abovee1*, the increase in the spot price is greater than the decrease in the contamination risk.
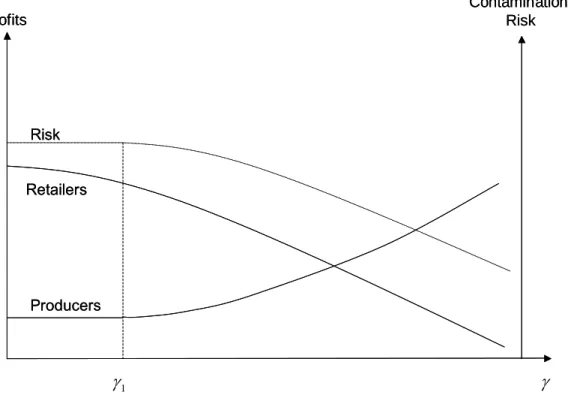
Figure 4 shows the aggregated profits of both all the retailers and all the producers, according to γ and considering that the retailers have adopted a collective norm such that e1= . It is e1*
worthwhile to note that the producers’ profit increases in γ . This means that the liability rule influences not only the choice of the requirement level of the collective standard, but also the value sharing between producers and retailers. In other words, the producers take advantage of the tightening of the liability rule.
Profits Contamination Risk Risk Producers Retailers Profits Contamination Risk Risk Producers Retailers γ1 γ
Figure 4 - Profits and risk according to the penalty costs and for the optimum value of the collective norm
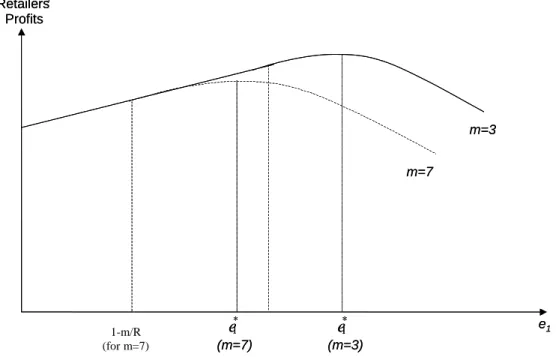
It is interesting to consider now the impact of the coalition size on the collective norm choice. Figure 5 shows the individual profit of retailers inside the coalition, according to the level of the collective norm and the size of the coalition. As we have seen before, if γ is sufficiently high, the optimal level of the norm for these retailers is 1* 1
m e
R
> − . As the individual profit of retailers inside the coalition decreases in the coalition size, it appears that the smaller the coalition size, the greater the level of the collective norm chosen by the coalition.
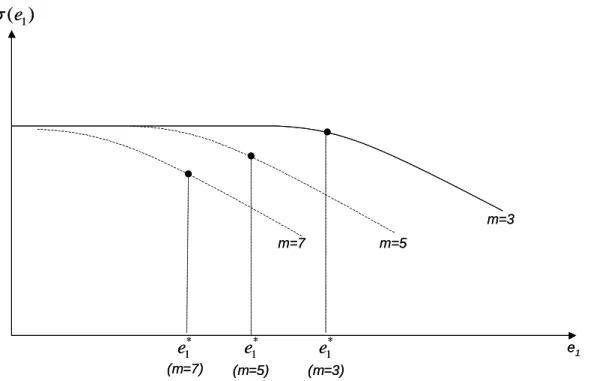
If we look at the consequences in terms of contamination risk, we observe on Figure 6 that the level of the collective norm which maximizes the individual retailers’ profit is such that: the smaller the coalition size, the greater the contamination risk. Therefore, we can identify a contradictory interest between the retailers and the public authorities (or the consumers) about the choice of the coalition size and the level of the collective norm:
- on the one hand, the retailers prefer a small coalition size, imposing a high level of the collective norm on the safe market;
- on the other hand, public authorities prefer a large coalition size, imposing a low level of the collective norm on the safe market.
Figure 5 – Retailer’s profit according to the collective norm and the coalition size
Retailers’ Profits e1 m=3 m=7 * 1 e e1* (m=7) (m=3) Retailers’ Profits e1 m=3 m=7 * 1 e e1* (m=7) (m=3) 1-m/R (for m=7)
e1 m=3 m=5 * 1 e e1* (m=5) (m=3) 1 ( )e
σ
* 1 e (m=7) m=7 e1 m=3 m=5 * 1 e e1* (m=5) (m=3) 1 ( )eσ
* 1 e (m=7) m=7Figure 6 – Contamination risk according to the collective norm and the coalition size
In order to assess finally the impact of the implementation of a collective norm by a coalition of retailers, it would be necessary to consider endogenously the retailers coalition size in the model. Indeed, it is not sure that the result of the game would be, at equilibrium, a small coalition size and a high level of the food safety norm. It would depend on the assumptions concerning the coalition stability and the timing of decisions relatively to the coalition size and the collective norm level. For instance, it would suppose to consider whether or not the initial coalition of retailers is able to control the entry of new members. It would also depend on the possibility to re-negotiate the level of the norm when the coalition size is modified. These issues are important to consider but cannot be addressed in this paper.
5. Conclusion
In this paper, we have presented an original model of a vertical relationship between producers and retailers, some of which attempt to establish a safer spot market. In this model, the contamination risk is endogenously determined by the efforts imposed on the producers by the retailers. The penalty costs related to the liability rule decrease in relation to the requirement level of the collective standard. As a result, retailers can hope to reduce this penalty in the event of a crisis, providing that they belong to a group, which has imposed more stringent specifications on the suppliers.
The optimal level of the collective standard for the retailers depends on a trade-off between (i) a high requirement level resulting in a lower contamination risk and a greater final demand, and (ii) a low requirement level resulting in higher penalty costs and lower spot market prices.
On this basis, we determined the conditions of co-existence between the generic and the safe spot markets, and identified the equilibriums that can arise according to the size of the coalition and the requirement level of the collective standard. We assessed the effect of the liability rule on the co-existence of both spot markets, and on the food safety level. We demonstrated that, if the retailers have no penalty cost to pay in the event of a crisis, their profit decreases in relation to the requirement level of the collective standard, whatever the drop in the final demand during a crisis. For this reason, the group of retailers adopts a low standard level, only previously equipped producers enter the safer spot market and the total food safety risk does not undergo any change. If the penalty costs are high, individual retailer profit is maximized for a higher value of the collective standard and the total contamination risk decreases. In this case, the liability rule influences not only the level of the collective standard, but also the value sharing between producers and retailers. Finally, we showed the contradictory interest between the retailers and the public authorities (or the consumers) about the choice of the coalition size and the level of the collective norm.
In this paper, we have proposed a first attempt to formalize the relationships between producers and a group of retailers voluntarily implementing more stringent food safety specifications. However, further research should be conducted to more closely examine several important issues.
Firstly, we have considered as given the size of the retailers’ group. This assumption should be studied as it necessarily influences the final equilibriums. The main question is whether or not the retailers can decide the size of the group that adopts the collective standard. If they can indeed control this size, the initial group would choose the optimal size in order to maximize their profits. In this case, the group can be seen as a closed cartel. However, it remains uncertain whether an initial group can limit the number of new entrants. This is mainly due to the fact that as the collective standard deals with food safety issues and cannot be used for price differentiation on the final market, it is difficult to set up entry barriers. In this case, the group of retailers must be considered as an open cartel. In both cases, it is important to analyze the stability conditions of the cartel and identify which equilibrium finally emerges.
Another issue to be examined is related to the producers’ costs. In this paper, we have only considered the fixed costthe producers have to pay in order to enter the safer spot market. In reality, they also often have to pay variable costs related to process modifications. Moreover, we have not considered that the retailers could transfer a share of their penalty costs to the producers if a crisis were to occur. In fact, the implementation of traceability would allow them to identify those producers marketing contaminated products. For this reason it would be interesting to analyze stakeholder strategies involving a sharing of penalty costs and the corresponding impacts on food safety.
Finally, we have considered that public authority intervention is related to the liability rule and the penalty the retailers have to pay in the event of a crisis. Public authorities can also act through the tightening of Minimum Quality Standards. An important issue would be to examine the complementarities between ex post public regulation through the implementation of the liability rules and ex ante public regulation through the tightening of MQS. This point has been studied by Kolstad et al. (1990). The inclusion of the collective private standard in such an analysis would be an interesting area for further research.
References
Antle, J.M. Choice and Efficiency in Food Safety Policy, 1995, The AEI Press, Washington D.C. (1995), 109 p.
Barret J., Segerson K., 1997, Prevention and Treatment in Environmental Policy Design,
Journal of Environmental Economics and Management, 33, 2, (June 1997):196-213.
Bazoche, P., Giraud-Héraud, E., Soler, L.G., Premium Private Labels, Supply Contracts, Market Segmentation, and Spot Prices (2005), Journal of Agricultural & Food Industrial
Organization, 2005, vol.3, n°1, Article 7.
Codron, J.M., Grunert K., Giraud-Héraud, E., Soler, L.G., Regmi A., Retail Sector Responses to Changing Consumer Preferences: The European Experience, (2005), In : Regmi, A. ; Gehlhar M. (eds), New Directions in Global Food Markets, USDA, Agriculture Information Bulletin, février 2005, n°794, 81p., partie 3, 15 p.
Codron, J.M., Giraud-Héraud, E., Soler, L.G., (2005) Minimum quality standards, premium private labels, and European meat and fresh produce retailing, Food Policy.
Crespi, J.M., and S. Marette, 2001, How Should Food Safety Certification be Financed?,
American Journal of Agricultural Economics, 83(2001):852–61.
Elbasha, E.H., and T.L. Riggs, 2003, The Effects of Information on Producer and Consumer Incentives to Undertake Food Safety Efforts: A Theoretical Model and Policy Implications,
Agribusiness: An International Journal, 19(2003):29–42.
Fox, J.A., and D.A. Hennessy, 1999, Cost-effective Hazard Control in Food Handling,
American Journal of Agricultural Economics, 81(1999):359–72.
Fulponi L., 2006, Private voluntary standards in the food system: the perspective of major food retailers in OECD countries, Food Policy, under press.
Giraud-Héraud E., Rouached L., Soler L.G., 2006, Private labels and public quality standards: How consumer trust can be restored after the mad cow crisis? Quantitative Marketing and
Economics, 4(2006):31-55.
Golan, E., F. Kuchler, and L. Mitchell, 2001, Economics of Food Labeling, Journal of
Consumer Policy, 24(2001):117–84.
Hennessy, D.A., J. Roosen, and J.A. Miranowski, 2001, Leadership and the Provision of Safe Food, American Journal of Agricultural Economics, 83(2001):862–74.
Henson, S., and G. Holt, 2000, Quality Assurance Management in Small Meat Manufacturers,
Food Control, 11(2000):319–26.
Kolstad C.D., Ulen T.S., Johnson G.V., 1990, Ex Post Liability for Harm vs. Ex Ante Safety Regulation: Substitutes or Complements?, The American Economic Review, 80, 4 (1990):888-901.
Lichtenberg E., Penn T.M., 2003, Prevention versus Treatment under Precautionary Regulation: A Case Study of Groundwater, American Journal of Agricultural Economics, 85, 1(2003):44-58(15)
Lloyd, T., S. McCorriston, C.W. Morgan, and A.J. Rayner, 2001, The Impact of Food Scares on Price Adjustment in the UK Beef Market, Agricultural Economics, 25(2001):347–57.
Lyon T.P., Maxwell J.W, 2003, Self-Regulation, Taxation and public voluntary environmental agreements, Journal of Public Economics, 87 (2003): 1453-1486.
Loureiro, M.L., J.J. McCluskey, and R.C. Mittelhammer, 2001, Assessing Consumers Preferences for Organic, Eco-labeled and Regular Apples, Journal of Agricultural &
Resource Economics 26(2001):404–16.
Salin, V., and N.H. Hooker, 2001, Stock Market Reaction to Food Recalls, Review of
Agricultural Economics, 23(2001):33–46
Segerson K., 1997, Prevention and Treatment In Food Safety: An Analysis Of Conceptual Issues, University of Connecticut - Department of Economics, http://ssrn.com/abstract=48234
Segerson, T.J. Miceli, 1998 - Voluntary environmental agreements: Good or bad news for environmental protection? Journal of Environmental Economics and Management,
36(1998):109-130.
Sporleder, T.L., and P.D. Goldsmith, 2001, Alternative Firm Strategies for Signaling Quality in the Food System, Canadian Journal of Agricultural Economics, 49(2001):591–604.
Starbird, S.A, 1994, The Effect of Acceptance Sampling and Risk Aversion on the Quality Delivered by Suppliers, Journal of the Operational Research Society, 45(1994):309–20.
Thomsen, M.R., and A.M. McKenzie, 2001, Market Incentives for Safe Foods: An Examination of Shareholder Losses from Meat and Poultry Recalls, American Journal of
Agricultural Economics, 83(2001):526–38.
Weiss, M.D, 1995, Information Issues for Principal and Agents in the 'Market' for Food Safety and Nutrition, In J.A. Caswell, ed. Valuing Food Safety and Nutrition. Boulder: Westview Press, 1995, pp. 69–79.
Appendix
E1 Benchmark equilibrium
In this case, we have m = 0. The profit for each retailer r (r=1,…, R) in the benchmark situation is given by:
r r j r 0 r j r 1 [ a ( x x )] x x ( 0 ) r 1,...,R d ( 1 ) π ω σΓ σ ≠ = − + − − = −
∑
(A1)The first order condition for the retailer r leads to:
r j r 0 j r r 1 2 a x x 0 r 1,...,R x d ( 1 ) d ( 1 ) π ω σ ≠ σ ∂ = − − − = = ∂ −
∑
− (A2)Then, each retailer supplies the same quantity to the end market. The individual demand in the generic market is:
0 0 (1 )( ) ( ) 1,..., ( 1) r d a x r R R σ ω ω = − − = + (A3)
Equalizing supply and demand in the generic market (Rxr(ω0)=Jq), we obtain the following intermediary price: 0 Jq( R 1 ) a dR( 1 ) ω σ + = − − (A4)
Then, if a is sufficiently high, we have
0 0
ω > and all the upstream producers agree to take part in the generic market. Using (A3) and (A4), we verify that each retailer supplies xr Jq
R
= at equilibrium. The price level in the end market is given by:
Jq p a
d ( 1 σ )
= −
− (A5)
We then have the mark-up p 0 Jq dR( 1 ) ω
σ
− =
− and the following profits:
j 2 r Jq( R 1 ) B q [ a ] j 1,...,J dR( 1 ) Jq 1 ( ) ( 0 ) r 1,...,R d ( 1 ) R σ π σΓ σ + = − = − = − = − (A6)
Taking 1
2
σ = , we find the expressions (4) and (5).
E2 equilibrium (elimination of the generic market and no modification of sanitary risk)
In this case, we have m = R. Then all the upstream producers have to choose between participating to the safe market or doing nothing (and earn a zero profit). This case is similar to the benchmark case, where we have only one intermediary market. Using (A3), we have the individual demand for each retailer r :
1 1 (1 )( ) ( ) 1,..., ( 1) r d a x r R R σ ω ω = − − = + (A7)
Denote by % the switch value of e , such that the producer is indifferent between the two e
strategies. All the producers between % and e e =1 participate to the safe market. Then the total supply in the intermediary market is Jq( 1 e )−% and the spot price in the safe market is:
1 Jq( R 1 )( 1 e ) a dR( 1 ) ω σ + − = − − % (A8) • If 1 e≥e
% , the sanitary risk is 1
2
σ = . However, if the parameter a is sufficiently high, we have
1q 0
ω > . Then all the producers between
1
e and % want to participate to the safe e
market. • If
1
e<e
% , the producers will be distributed along [0,1] with the following new density:
1 1 1 1 1 if 0 e e 0 if e e e f ''( e ) e -e if e e 1 if e e 1 ≤ ≤ ⎧ ⎪ ⎪ < < ⎪ = ⎨ = ⎪ ⎪ ⎪ < ≤ ⎩ % % % (A9)
In this case, the sanitary risk is now:
1 2 1 1 1 2 ( ) ( ) ''( ) 2 e e e e e e f e de σ =
∫
σ = − + % % % (A10)Then, if the parameter a is sufficiently high, we have ω1q e− > . All the producers 1 0
want to participate to the safe market, that is %e=0. Finally we have:
2 1 1 2 Jq( R 1 ) a dR( 1 e ) ω = − + + (A11)
Each retailer offers the quantity
r
Jq x
R
= ( r=1,...,R) and the price in the end market is such that: 2 1 2 Jq p a d ( 1 e ) = − + (A12)
The profit of each retailer is:
2 2 2 r 1 1 1 Jq 2 1 ( ) ( 1 e ) ( e ) r 1,...,R d ( 1 e ) R 2 Π = − − Γ = + (A13)
E3 equilibrium (co-existence of the two intermediary markets without any change in the contamination risk)
In this case, we have 0 < m < R and e1 ≤ < . ˆe 1
Using (A2) we have the following bestreactions for the retailers:
r 0 1 0 j j r r 0 1 1 j j r d ( 1 ) 1 x ( , ) ( a ) x r 1,...,n 2 2 d ( 1 ) 1 x ( , ) ( a ) x r n 1,...,R 2 2 σ ω ω ω σ ω ω ω ≠ ≠ − = − − = − = − − = +
∑
∑
(A14)The system (A14) is easily solved using the symmetry of the model. We have
r
x = for all r x = 1,..,n, and xr = for all r 1,...,Ry = . We then obtain the following values:
0 1 0 1 a ( m 1 ) m x d ( 1 )[ ] ( R 1 ) a n ( n 1 ) y d ( 1 )[ ] ( R 1 ) ω ω σ ω ω σ − + + = − + + − + = − + (A15)
x and y characterize the demand of the retailers, respectively in the generic market and in the safe market. The equilibrium prices in the intermediary markets are given by nx=( J−G )q
0 1 Jq ˆ a ( n e ) ˆ dn [ 1 ( e )] Jq ˆ a ( m 1 e ) ˆ dm [ 1 ( e )] ω σ ω σ = − + − = − + − − (A16)
Using (A14), (A15) and (A16), we obtain:
ˆ Jqe x n ˆ Jq( 1 e ) y m = − = (A17)
Thus, we can verify that the total quantity supplied in the market is nx+my=Jq. The profits of the retailers are:
0 r 1 1 ˆ ( p ) x ( e ) ( 0 ) for r 1,...,n ˆ ( p ) y ( e ) ( e ) for r n 1,...,m ω σ Γ Π ω σ Γ − − = ⎧ ⎪ = ⎨ ⎪ − − = + ⎩ (A18)
with the mark-ups :
0 1 ˆ Jqe p ˆ dn [ 1 ( e )] ˆ Jq( 1 e ) p ˆ dm [ 1 ( e )] ω σ ω σ − = − − − = − (A19)
Note that in this simple case, we have ( e )ˆ 1 2
σ = . Equalization of producers’ profits in the generic market and in the safe market leads to
0 1 ω =ω ≡ , that is: ω n ˆe R = (A20)
We have ˆe 1≤ and we have
1 ˆ
e ≤ if and only if e
1
m≤R( 1 e )− . Using (A17) and (A20), we obtain xr Jq
R
≡ . The end market price is p a 2 Jq d
= − and the intermediary price is
2 Jq( R 1 ) a
dR
ω = − + . Then the mark-up is p 2 Jq dR
ω
E4 equilibrium (co-existence of the two intermediary markets with a change in the contamination risk)
In this case, we have 0 < m < R and
1
ˆ 0< < . e e
First of all, we obtain the same formula as (A14)-(A17). However, in this case, we have
2 1 ˆ 1 ( e e ) ˆ ( e ) 2
σ = − − . Using (A16) it is demonstrated that the spot price in the safe market is greater than the spot price in the generic market:
1 1 0 ˆ e e 0 q ω ω− = − > (A21)
Equalization of producer profits in the generic market and in the safe market results in:
1 1 0
ˆe= −e (ω ω− )q (A22)
Then we verify that ˆe is the unique solution of the following equation:
2 2 1 1 2 Jq Rx n ( x ) [ ] ( e x ) 0 dnm 1 ( e x ) Ψ = − − − = + − (A23) ( x )
Ψ is continuous and increasing in x. Moreover, Ψ( 0 )< and ( 1 ) 00 Ψ > . Therefore
there exists a unique ˆe∈] 0 ,1[ such thatΨ ( e )ˆ = . 0
Note that 2 1 1 2 Jq ( e ) (Re n ) dnm Ψ = − . Consequently, 1 ( e ) 0 Ψ > if and only ife1 n R > . In this situation, 1
ˆe< and an E3 equilibrium does indeed exist. e
The explicit expression of ˆe can be found using Mathematica. We obtain:
1 / 3 2 2 / 3 1 2 ( 2 Rq ) 2 A ˆe e A 6 α α + = + − (A24) where: 2 2 1 / 3 1 3 4 2 2 3 1 A [ 6 3 54 q (Re n )] dnm [ 27 q (Re n ) ( 2 Rq ) ] β α α β α α α = − − = = − + + (A25) When 1 e tends to n
R , the solution of (A17) is given by ˆe= . Thus we obtain the same e1
Parameters used for the numerical simulations: a 10000 d 1 J 1 R 10 q 50 e1 From 0 to 1 γ From 0 to 30 m From 0 to 10